Deep Dive Into Diabetic Retinopathy Identification: A Deep Learning Approach with Blood Vessel Segmentation and Lesion Detection
Kamal Upreti1,*, Anmol Kapoor2, Sheela Hundekari3, Shitiz Upreti4, Kajal Kaul5, Shreya Kapoor6 and Akhilesh Tiwari1
1CHRIST (Deemed to be University), Delhi NCR, Ghaziabad, India
2Maharaja Surajmal Institute of Technology, Delhi, India
3MIT ADT University, Pune, India
4Maharishi Markandeshwar (Deemed to be University) Mullana-Ambala, Haryana, India
5Bharati Vidyapeeth College of Engineering, Rohini, India
6Dr. Akhilesh Das Gupta Institute of Technology & Management, New Delhi, India
E-mail: kamalupreti1989@gmail.com; kapoor.anmol98@gmail.com; sheelahundekari90@gmail.com; upretiec@gmail.com; kajalkaul19@gmail.com; kapoor.shreya2506@gmail.com; akhileshmatiwari1@gmail.com
*Corresponding Author
Received 03 September 2023; Accepted 03 March 2024; Publication 29 March 2024
Abstract
In the landscape of diabetes-related ocular complications, diabetic retinopathy stands as a formidable challenge, reigning as the leading cause of vision impairment worldwide. Despite extensive research, the quest for effective treatments remains an ongoing pursuit. This study explores the burgeoning domain of AI-driven approaches in ocular research, particularly focusing on diabetic retinopathy detection. It delves into various diagnostic methodologies, encompassing the detection of microaneurysms, identification of hemorrhages, and segmentation of blood vessels, primarily utilizing retinal fundus photographs. Our findings juxtapose conventional machine learning techniques against deep neural networks, showcasing the remarkable efficacy of Convolutional neural network (CNN) and Random Forest (RF) in segmenting blood vessels and the robustness of deep learning in lesion identification. As we navigate the quest for clearer vision, artificial intelligence takes center stage, promising a transformative leap forward in the realm of vision care.
Keywords: Deep learning, diabetic retinopathy, lesions, soft exudates, hemorrhages, and microaneurysms.
1 Introduction
Diabetic retinopathy (DR) casts a pervasive shadow over global vision health, standing as the foremost cause of blindness among working-age adults. This progressive ocular disease, stemming from the detrimental effects of prolonged diabetes on retinal blood vessels, silently threatens the vision of millions. Regardless of age, the risk of developing DR escalates for those grappling with long-term poor insulin sensitivity. Yet, DR often lurks in the shadows, only revealing itself during its final stages when treatments prove ineffective. The imperative for early detection and intervention is clear, yet traditional screening methods are costly, labor-intensive, and inaccessible to many. Enter the transformative potential of artificial intelligence (AI), heralding a new era in DR diagnosis and management. By leveraging AI-driven algorithms and image analysis, we can not only enhance accessibility and affordability but also empower individuals and healthcare providers to combat this insidious threat. As we navigate the intersection of public health and technological innovation, this paper aims to explore the pivotal role of AI in revolutionizing DR diagnosis and management.
Diabetic retinopathy (DR) manifests as a result of prolonged diabetes, leading to the inadequate supply of oxygen to retinal blood vessels. Given the prevalence of diabetes in society, particularly among those over 45 years old, the need for non-invasive methods of DR detection is paramount. Fundus imaging, a technique endorsed by experts, allows optometrists to assess the intensity of DR without invasive procedures. With the purpose of finding DR, variables including cotton wool spots (CWS), hemorrhagic (HEMs), microaneurysms (MAs) and exudates (EXs) are evaluated. Technologies are required to enable non-technical people to snap an image on a cell phone and send it to ophthalmologists, enabling them to give their patients advice by viewing the image on their smartphone. Timely identification can defeat DR. In the present scenario, AI has been demonstrated as a successful means of recognizing specific patterns in ocular ailments, together with related concepts like machine learning (ML) and deep learning (DL) in data science. Automated DR identification methods are substantially more accurate than conventional diagnosis and cost less money and time [1].
Hemorrhages (HM), hard and soft exudates (EX) and microaneurysms (MA) are examples of lesions as shown in Figure 1 and Table 1.
• Microaneurysms: In the fundus illustration, MA is an initial disease indication of diabetic retinopathy, producing retinal malfunction as a result of blood and fluid spilling on retina. Inside the retina, it manifests as little red dots. A yellow lipid rim or hard exudates may surround them. They could be no longer than 125 m and have strong borders all around them.
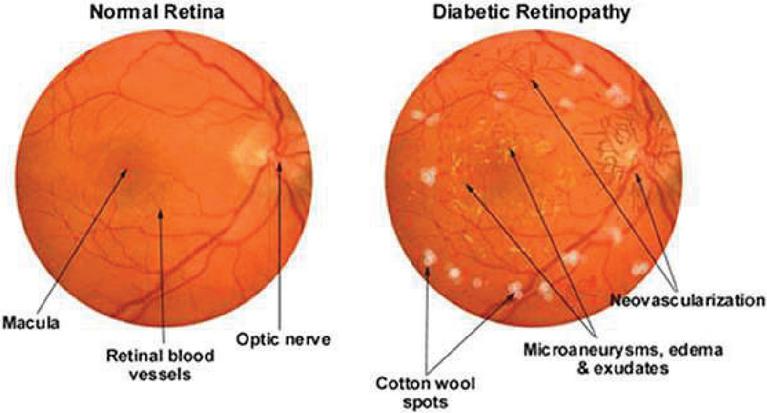
Figure 1 MA, HE, EX in fundus [33].
• Hemorrhages (HM) show up as irregularly shaped spots on the retina which may measure up to 125 meters in diameter. Flames (superficial HM) and blot (deep HM) are its two subcategories.
• Hard exudates: Hemolysis is the root cause of hard exudates that are generally visible as bright yellow spots on the eyes. They have clear boundary in addition to being present in the coastal regions of the eye.
• Soft exudates: soft exudates are white spots on the eye produced by swollen neural cells (cotton wool). They can be round or ovular. White lesions are composed of either hard or soft discharges. DR is divided into non-proliferative DR and proliferative DR. Additional categories for NPDR include faint, intermediate, and severe.
Table 1 Clinical characteristics and medical diagnosis of retinal disorders
| Characteristics | Clinical Presentation | Medical Diagnosis |
| Microaneurysm | Seamless circular edges. displays a centre light that reflects | It can be a proliferative cellular response to focal hypoxia or localized deterioration and swelling of the capillaries wall. |
| Intra retinal hemorrhages | Hemorrhages with dots and blots that are situated in the thicker OPAN retinal layer. Hemorrhages in the form of flames in the superficial RFN. | Bursting of a blood vessel, venule, or microaneurysm. |
| Hard exudates | Typically found inside or close to the macular serum lipoprotein that flow from excessively porous capillaries, having a shimmering yellow and waxy sheen. | Frequently coexists with DNE exudates may define the DME region. |
| DME | Described medically as retinal thickness seen after a physical investigation. | buildup of intra retinal fluid brought on by BRB degradation |

Figure 2 Diabetic retinopathy phases [34].
Vibrant lesions include hard and soft exudates (EX), whereas red lesions include MA as well as HM. The 5 stages of DR – normal, mild, moderate, severe, and PDR – are set out by the development of one or more of these anomalies as shown in Figure 2 and Table 2 [2]. Colored fundus photographs are utilized to detect DR, as outlined in the preceding section. The traditional investigation can be laborious and costly because it requires to be conducted by incredibly knowledgeable subject experts. It is essential to use algorithms based on computer vision to proactively analyze the fundus images in order to support radiologists. There are 2 categories based on vision techniques: hands-on engineering and all-encompassing instruction. The classic techniques used by the hands-on engineering techniques, which include LBP, SIFT, HoG, and others, for acquiring characteristics do not successfully record fluctuations in magnitude, orientation, and luminance. All-encompassing learning effortlessly picks up on the underlying characteristics, improving classification performance. None of the methods has the capacity to identify the Mild phase in the Kaggle database, even though numerous all-encompassing learning-based and hands-on engineering strategies are utilized to discover the DR. The early management of this lethal illness depends on the discovery of the mild phase [4].
Table 2 Diabetic retinopathy classification and proactive interventions [3]
| Severity of DR | Identifying Traits | Proactive Interventions |
| No DR | There are no microvascular deviations | Maintain healthy blood pressure, cholesterol, and blood sugar level. |
| Mild NPDR | Microaneurysms | Manage your blood sugar, cholesterol and blood pressure levels to maintain good health |
| Moderate NPDR | Microaneurysms and other symptoms are also visible, except for severe NPDR (hemorrhages, cotton wool patches, hard exudates) | Control the levels of glucose in your blood, your cholesterol levels and your blood pressure. |
| Severe NPDR | Each of the four quadrants had an average of twenty intraretinal hemorrhages., as well as permanent vascular beading and possible IRMA in at least two of the quadrants, without PDR. | Observe PRP |
| PDR | Preretinal hemorrhage, vitreous hemorrhage, or neovascularization of the optic disc or other areas | PRP, tractional detachment of the retina, or prolonged vitreous hemorrhage should all be strongly considered. |
The emergence of artificial intelligence (AI) has ushered in a transformative era in ocular health assessment and diagnosis, particularly in the realm of retinal diseases. This introduction aims to spotlight the paradigm shift brought about by AI-driven technologies in the screening and management of retinopathy. AI-based solutions have revolutionized disease detection and intervention in ophthalmology. Among these, the FDA-approved IDx-DR software suite stands as a pioneer, enabling non-ophthalmic practitioners to effectively assess retinal abnormalities linked to DR. Additionally, EyeArt, an automated cloud-based application from Europe and Canada, has garnered attention for its exceptional sensitivity (91.7%) and specificity (94.7%) in analyzing retinal images and offering precise recommendations for ophthalmology consultations. Moreover, a spectrum of emerging AI technologies, including Bosch DR Algorithm, Google’s innovations, SERI-NUS from Singapore, Retinalyze, and decision-support tools, underscores the dynamic landscape of retinopathy diagnosis. These technologies have not only permeated diverse populations such as Sub-Saharan, Caucasian, North African, and English inhabitants but have also exhibited promising outcomes, showcasing their potential in transforming global retinal health assessments. The comprehensive landscape of related research conducted by numerous scientists and researchers in the field will be encapsulated in Section 2 of this paper. Section 3 outlines the suggested approach. Section 4 entails the exploration and analysis of the obtained outcomes, whereas Section 5 focuses on elucidating and interpreting these outcomes in detail followed by limitations and challenges and the conclusion.
Research Question: The central research question driving our study is: “Which set of algorithms for segmentation and lesion detection methods demonstrate the highest reliability and precision in identifying retinal blood vessels and identifying lesions for automated diabetic retinopathy (DR) detection?”
Hypothesis: Our hypothesis is that improved matched filtering and feature-based methods, in conjunction with deep learning-based segmentation algorithms like convolutional neural networks (CNNs) and ensemble classifiers, will surpass alternative approaches in precisely segmenting retinal blood vessels and identifying lesions suggestive of diabetic retinopathy across various datasets. We hope to discover innovative strategies that improve the efficacy and efficiency of diabetic retinopathy screening by a methodical evaluation and comparison of these algorithms and methodologies. This will ultimately lead to better patient outcomes and less strain on healthcare systems.
2 Related Work
Recognized globally as a leading cause of severe blindness and impaired vision, retinal diseases have garnered considerable attention and research focus. Astonishingly, an estimated 285 million individuals worldwide grapple with insulin resistance, with approximately one third of them facing the looming threat of DR, risking their eyesight. Varma et al. [6] underscored the transformative impact of intravitreal VEGF suppression, significantly reducing vision impairment and notably improving sight among patients with neovascular AMD and diabetic macular edema. However, the actual scenario, as revealed by Mehta et al. [7], starkly contrasts with the promising outcomes observed in clinical trials. The reality unveils significantly graver consequences primarily stemming from delayed disease diagnosis and progression, coupled with the unpredictable nature of relapses. These challenges pose substantial impediments to long-term care, particularly evident in cases of neovascular AMD, warranting significant attention for effective disease management and treatment.
Computerized detection depending on ocular pictures in ophthalmology has long been a goal for AI according to Abramoff et al. [8]. Recently, CNN was configured to recognize DR with its accuracy at par with a group of ophthalmologists who were qualified to do the job (Gulshan et al. [9]). Using OCT, a CNN was capable of managing to differentiate between instances of progressive AMD or diabetic macular edema that need prompt intervention and less serious conditions (Kermany et al. [10]). The effectiveness was at par with 6 ophthalmologists who used the identical images to make comparable judgments. A model based on CNN was put forth by Gondal et al. [11] for the referable DR. They employed the Kaggle database to train models and the DiaretDB1 database to perform testing on two openly accessible databases. When classifying patients, they adopt a method based on binary values in which the normal as well as mild phases are classified as non-referable DR and the subsequent 3 phases are regarded as referable DR. In accordance with the classification of binary data, the CNN model’s effectiveness on DiaretDB1 is assessed with specificity of 97.6% and sensitivity of 93.6%.
According to Wang et al.’s [12] innovative design, photographs may be classified as normal or aberrant, non-referable or referable DR, achieving a good AUC on both assessments (0.978 for referable and 0.960 for non-referable) along with 0.5 specificity. 3 networks are used in their suggested methodology: main, attention, crop. The main system uses the Inception framework, which underwent ImageNet training, wherein the attention network emphasizes different kinds of lesions in the photographs while the crop network crops the portion of the picture with the utmost degree of focus. A total of three models based on CNN were utilized for binary categorization and DR lesions’ detection. The DiaretDb1 dataset was employed for training and Kaggle for testing.
Chanrakumar and Kathirvel [13] examined the stage-by-stage division and proposed an CNN framework using a dropout regularization method on the DRIVE and STARE datasets was assessed after it had been trained using the Kaggle database. The model they developed obtained a 94% accuracy rate. Employing a visual editing system, they painstakingly carried out the pretreatment and enhancement stages. Kaggle dataset is exposed to the CNN framework. The set of photographs was preprocessed using a delta value and nonlocal mean denoising to ensure that each photograph had the same luminance. a tenth of the photographs were employed for verification, and the average kappa score accuracy for assessment was 0.74. Although Pratt et al. [14] developed a CNN structure for distinguishing 5 phases but due to the complexity of the framework, it was unfit to successfully categorize the mild phase. Another disadvantage is that they utilized a Kaggle database that was distorted, resulting in significant specificity at the expense of poor sensitivity. Deep CNN was suggested by Yang et al. [15] for each of the 2 phases of DR i.e., normal, NPDR. The two types of systems- local and global are supplied with the preprocessed information as inputs. The worldwide network receives the most significant lesions for evaluation. For the framework’s assessment, they considered class weight and kappa scores. Table 3 further shows the contribution of various scientists.
Table 3 Contribution of various scientists
| Authors | Research Questions | Contributions |
| Shu-I Pao et al. [16] | How can the accuracy of the detection of referable DR using a bichannel CNN be enhanced using entropy images generated from the green element of fundus photos, combined with image augmentation by unsharp masking (UM)? | Highlighting the value of early DR detection in preventing visual loss and raising quality of life. Addressing the DR assessment’s resource and skill constraints, particularly in medically poor areas. Recognizing the promise of AI, particularly using deep learning in automating DR detection and delivering affordable and highly successful screening. Introducing the use of entropy pictures of the green element and the green element in RGB images to enhance detection sensitivity and accuracy. Introducing a bichannel CNN model to better detect referable DR by utilizing the traits of both the UM-preprocessed green component and the grey level entropy images. |
| Gao Jinfeng et al. [17] | How can the identification and categorization of all phases of diabetic retinopathy (DR) be improved by employing an ensemble technique based on deep CNN models? Can balanced and unbalanced data sets be used to develop and evaluate CNN frameworks in an efficient manner to achieve reliable DR stage detection, including the mild stage? |
They present two ensemble CNN models for classifying DR stages and these models are utilized with both balanced and imbalanced datasets. Demonstrating that the proposed ensemble models perform better than single deep learning designs like ResNet50, DenseNet-121, Inception-V3, and Dense169 in terms of accuracy. Highlighting the necessity of diversity in base classifiers for the ensemble architecture to achieve high accuracy. Comparing the nonproliferative (NPDR) and proliferative (PDR) stages of DR, with an emphasis on the value of early detection to prevent visual loss. Recognizing the limitations of manual fundus picture analysis and the demand for automated analysis using computer vision techniques. |
| Muhammad Mateen et al. [18] | Is it possible to detect retinal exudates in fundus pictures using a transfer learning-based pre-trained CNN system? How accurate is the suggested framework for exudate detection when compared to current methods? Can the suggested framework be expanded to distinguish between various exudate types and identify other diabetic retinopathy-related retinal abnormalities? |
The development of a transfer learning-based, pretrained framework for spotting retinal exudates in fundus photographs, based on CNN. The proposed framework uses pretrained CNN models Inception-v3, VGG-19 and ResNet-50 for feature extraction. Combining characteristics from pretrained models with a softmax classifier for increased classification precision. A comparison of the proposed framework’s performance with two publicly accessible databases, showing it to be more effective than the methods currently in use. The advice of more research to broaden the framework for identifying various exudate kinds and diagnosing additional retinal problems linked to diabetic retinopathy. |
| D. Siva Sundhara Raja et al. [19] | How successful is the suggested strategy for automatically identifying and classifying blood vessels in retina in DR? Does the removal of the optic disc’s area improve the precision of blood vessel distribution? How effective is the suggested approach at detecting and segmenting retinal blood vessels in comparison to current techniques? Can the proposed system be applied generally to many datasets and produce reliable results? |
The creation of a system for automatically identifying, segmenting and classifying blood vessels in retina with computer assistance in diabetic retinopathy. The suggestion of a strategy that would enhance the precision of blood vessel distribution by excluding the area of optic disc. The analysis of the suggested approach on two accessible datasets: DRIVE and STARE, shows great accuracy in vessel segmentation. On the DRIVE dataset, vessel segmentation was achieved with 93.99 percent sensitivity, 98.37 percent specificity, and 98.08 percent accuracy; on the STARE dataset, it was achieved with 93.6 percent sensitivity, 98.96 percent specificity, and 95.94 percent accuracy. |
| Accurate blood vessel segmentation offered by the proposed approach, which will allow for additional analysis and severity rating, has the potential assist with automatic DR identification and diagnosis. | ||
| Nagaraja Gundluru et al. [20] | How can the identification and categorization of DR be improved by the application of principle component analysis (PCA)? How might the use of the Harris Hawks optimization (HHO) algorithm improve the classification and extraction of features procedures for the identification of DR? How does the suggested deep learning model, which includes PCA and HHO, |
The article presents a novel method for the PCA extraction and selection of features for the dentification and categorization of DR. The accuracy and effectiveness of the preprocessing stage are improved by this contribution. An original contribution is the use of the Harris Hawks Optimization (HHO) algorithm in the feature engineering process. By overcoming issues like multi-modality, local optima, and deceptive optima in the feature space, HHO improves the dimensionality reduction procedure. |
| perform in relation to specificity, recall, accuracy, precision and sensitivity as compared to current techniques for machine learning? | When compared to well-known machine learning algorithms like KNN, SVM, and XGBoost, the suggested deep learning model that integrates PCA and HHO performs better. The model excels in identifying and classifying diabetic retinopathy with improved specificity, precision, accuracy, recall, and sensitivity. |
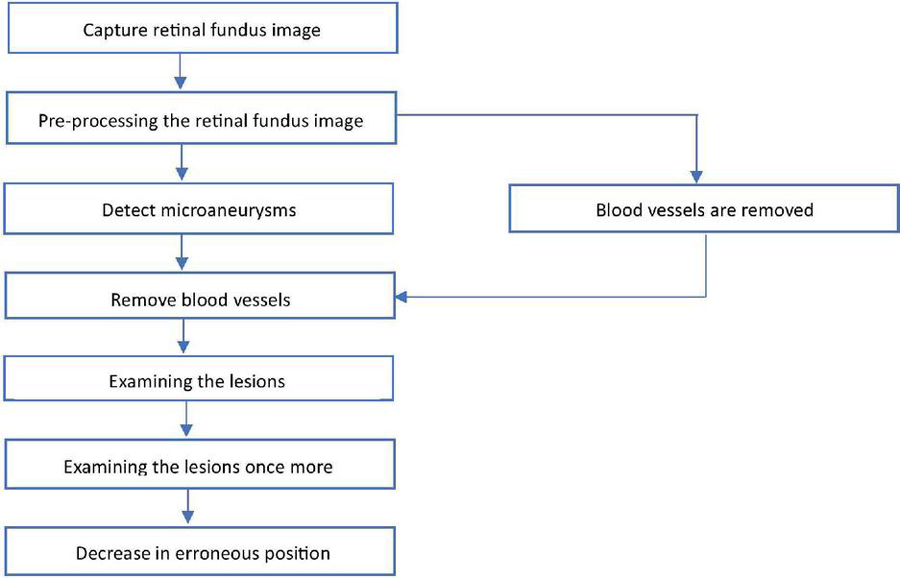
Figure 3 Flowchart for retinal fundus image analysis and lesion identification.
3 Methodology
Commencing with the initial step depicted in Figure 3, the process begins by capturing retinal fundus images using specialized tools like fundus cameras to ensure precise depiction of the retina. The subsequent analysis builds upon these images, starting with crucial preprocessing steps. This phase encompasses tasks like cropping, size adjustment, intensity modification, and noise cancellation, crucial for enhancing image quality and eliminating artifacts that could impede further analysis. Following this, the identification of microaneurysms, early indicators of diabetic retinopathy, is conducted using advanced algorithms that often leverage machine learning and image processing techniques. Once microaneurysms are identified, the process of vessel segmentation is employed to either highlight or remove blood vessels from the image. This segmentation step is pivotal in isolating lesions, eliminating interference from blood vessels, and facilitating a more focused analysis. Subsequently, a review of the lesions visible in the retinal imaging is performed after successful blood vessel segmentation. This examination involves assessing various characteristics such as size, shape, and severity of the lesions, among others, to ascertain their significance in the context of diabetic retinopathy. Sometimes, further investigation may be warranted to refine the analysis, employing additional image processing or machine learning algorithms for accurate lesion diagnosis and characterization. Emphasis is also placed on reducing erroneous conclusions, aiming for fewer false positives or misclassified lesions. This involves fine-tuning the lesion identification algorithms to enhance accuracy and ensure precise outcomes. Furthermore, quantitative parameters like Accuracy, Sensitivity, Specificity, and Area Under the Receiver Operating Characteristic Curve (AUC) are used to compare the segmentation algorithm’s effectiveness against a manually annotated ground truth mask. In order to confirm our methodology’s generalizability and efficacy across a range of retinal pictures and pathological situations, we also validate it using cross-validation approaches and comparison with existing methodologies. This thorough approach allows for the robust and accurate segmentation of blood vessels in retinal pictures, which is useful for a variety of applications in clinical and scientific ophthalmology research. Overall, this systematic and data-driven workflow illustrates the computerized examination of retinal fundus images for diagnosing and evaluating diabetic retinopathy.
3.1 Segmenting Blood Vessels in Diabetic Retinopathy
Databases utilized in this technique include:
(a) DRIVE: Digital Retinal Images for Vessel Extraction formed the focus of a diagnostic investigation involving 400 people in the Netherlands, ranging in age from 25 to 90. Within this dataset, forty samples are available, including seven with minor symptoms of Diabetic Retinopathy (DR) and the remainder being healthy cases. The 40 fundus images in the dataset are split into two sets: 20 images for training and 20 images for testing. Ground truth segmentation of blood arteries is aided by manual annotations accompanying each image in the DRIVE dataset, which has dimensions of 565 by 584 pixels.
(b) STARE (Structured Analysis of Retina) is made up of twenty snapshots taken with a fundus camera. This is separated into two information sets, one of which includes healthy participants and the other of which includes diseases such microaneurysms, hemorrhages, etc. A few of these diseases completely encompass vessels in the body. Each retinal scan typically has dimensions that range from 700 605 pixels to 700 700 pixels. These images are equally divided among the training and test sets. Similar to the DRIVE dataset, STARE offers manual annotations to facilitate the segmentation of blood vessels.
(c) CHASE: The dataset comprises 28 retinal snapshots from children of various ethnic backgrounds in England, each with a resolution of 1280 960 pixels. In comparison to the database pairs, CHASE snapshots have an improved consistent background lighting, poorer vessel-to-background contrast, and a centralised vessel reflex [21]. These 28 retinal scans are divided into 14 images for training and 14 for testing, with dimensions ranging from 999 by 960 pixels to 999 by 960 pixels and manual annotations are incorporated.
The strategies addressed in past studies for vessel segmentation are briefly reviewed in this research, coupled with modern methods.
3.1.1 Use of deep networks in DR
Rectified Linear Units (ReLU) are additionally utilized as function transfers in deep CNNs, assisting in successful training because they remain functional at poles like tangent functions and sigmoid used with standard ANNs. Finally, deep neural networks may be effectively complemented with GPUs due to their numerous levels. CNN is a kind of a neural network with forward-propagation architecture which was developed employing the reverse propagating technique. CNNs generate attributes from photos. The feature selection method of sub sampling or pooling layers reduces the degree of spatial resolution for every feature map which renders the entire network resilient to alterations in picture background information, dimensions, orientation, etc. The blended technique described by Wang et al. [22] combines CNN with Random Forests (RFs). For the purpose of enhancing vascular contrast, they underwent an additional preprocessing phase then, using CNN, topological characteristics that were resistant to image expansion, translation, deformation, etc. were effortlessly extracted. At last, a vessel classifier was produced utilizing RFs with a majority vote. Researchers also used the databases DRIVE and STARE, and on both information sets, respectively, they obtained accuracy/AUC values of 0.9767/0.9475 and 0.9813/0.9751.
Table 4 Data comparison of blood vessel segmentation in DR
| Authors | Lupascu et al. [24] | Wang et al. [22] | Odstrcilik et al. [25] | Liskowski et al. [23] | Fraz et al. [26] |
| Method | AdaBoost | CNN and RF | Improved Matched Filtering | Variants of CNN | Ensemble Classifiers |
| Database | DRIVE | DRIVE/ STARE | HRF | DRIVE/ STARE/ CHASE | DRIVE/STARE |
| Accuracy | 0.9597 | 0.9767/ 0.9813 | 0.9445/ 0.9340 | 0.97 | 0.948/ 0.9534 |
| Sensitivity | 0.72 | 0.8173/ 0.8104 | 0.7463/ 0.7060 | – | 0.7406/ 0.7548 |
| Specificity | – | 0.9733/ 0.9791 | 0.9619/ 0.9693 | – | 0.9807/ 0.9763 |
| AUC | 0.9561 | 0.9475/0.9751 | 0.9589/0.9519 | 0.99 | 0.9747/0.9768 |
Deep neural network-based supervised methodology was also put forth by Liskowski et al. [23]. Although scientists used a variety of visual pretreatment approaches, neural networks operate better on treated visuals than on unprocessed image information. Additionally, because there were only a few pictures in both the DRIVE and STARE databases, the pictures were enhanced with multiple processes including expansion, spinning, and inverting because these networks perform best with a big set of data to train. They used the CHASE dataset to cross-verify their results. A m*m area focused on every pixel is used to determine if it is a vessel or non-vessel. They’ve employed m 27. For every one of the visual’s R, G, and B channels, an area is created. As an outcome, 3 areas are created for every pixel, giving the resultant picture a size of 2187. Twenty thousand training areas from the DRIVE and STARE libraries were utilized for sampling. For instance, DRIVE’s training batch of twenty snapshots yields forty thousand data. In the final stage, they used two CNNs, one through maxpooling and the other with no pooling, along with three entirely interconnected levels. The learning procedure was sped up by using sigmoid output values and a ReLU-based concealed layer. Applying stochastic gradient descent, inaccuracy is reduced. They additionally employed structured anticipating, which uses a network to operate simultaneously to classify several pixels. Their approach, in its multiple iterations, yielded AUC 0.99 and accuracy 0.97. Along with this, they achieved fine vessel detection with a sensitivity 0.87. As Table 4 illustrates, researchers frequently use these datasets to assess different segmentation algorithms. This table contrasts the results of several approaches on several datasets, including AdaBoost, CNN and RF, enhanced matched filtering, CNN variations, and ensemble classifiers. Evaluation metrics that shed light on the efficacy of these techniques include area under the curve (AUC), sensitivity, accuracy, and specificity.
3.2 Identifying Lesions in Diabetic Retinopathy
Databases utilized in this strategy:
Most of the attributes used for detecting lesions are taken from:
1. Messidor database – The primary data source consists of 1,200 color fundus images sourced from diabetic retinopathy screening programs, forming the Messidor database. These images originate from multiple clinical centers and encompass both pathological and normal cases, with a specific emphasis on diabetic retinopathy.
2. Messidor’s Messidor-2 extension – Similar to the existing Messidor database, the Messidor-2 extension supplements this collection with additional retinal photographs, expanding the dataset for diabetic retinopathy testing purposes.
3. EyePACS-1 – This dataset offers a comprehensive array of fundus photographs exhibiting various disorders associated with diabetic retinopathy, including hemorrhages, exudates, microaneurysms, and other lesions.
For automatic identification of these kinds of lesions, a range of techniques have been devised. The primary approach for early identification of DR is finding microaneurysms (MA). To categorize potential areas into vibrant lesions as well as non-lesions, other methods of preprocessing like enhancing contrast, fuzzy logic and color normalization are also necessary. Segmentation of images has been done using C-means clustering. Multi-scale correlation filtration was additionally employed to find microaneurysms. The DR phase is anticipated by considering the different combinations of these lesions. Thus, the majority of the documents focused on differentiating retinopathy lesions versus non-lesions followed by classifying those lesions into vibrant lesions and red lesions like microaneurysms and hemorrhages.
For evaluating the existence of diabetic retinopathy and its severity, numerous characteristics have been gathered periodically in conjunction with feature selection. By incorporating unique filtering parameters and combining ML classification algorithms, Antal et al. [27] introduced a method based on ensembling. They pioneered the idea of preliminary screening digitized fundus images as well as measured the distances in the region spanning from the optic disc centre (ODC) to the macula centre (MC). The visual quality is evaluated for purposes of categorization as an attribute as opposed to an exclusion criterion. They utilized different attributes obtained from the Messidor information set, which is accessible to the general population. Some of their characteristics can be found in the repository maintained by UCI as well. With two classifications of 1-Presence of retinopathy and 0-No retinopathy, they were able to get an AUC score of 0.989.
Table 5 Comparative results of data for identifying lesions in DR
| Roychowdhury | |||||
| Authors | Abramoff et al. [8] | Gulshan et al. [9] | Abramoff et al. [28] | Antal et al. [27] | et al. [30] |
| Method | IDP | Deep Learning | CNN | Classifier Ensemble | Supervised Classifiers |
| Database | Messidor | EyePACS-1/ Messidor-2 | Messidor | Messidor | Messidor |
| #DR classes | 2 | 4 | 2 | 2 | 2 |
| Sensitivity | 0.968 | 0.975/0.961 | 0.968 | 0.9 | 1 |
| Specificity | 0.594 | 0.934/0.939 | 0.87 | 0.91 | 0.5316 |
| AUC | 0.937 | 0.991/0.990 | 0.98 | 0.989 | 0.904 |
Various methodologies have been proposed to identify referable diabetic retinopathy (DR). Abramoff et al. [8] introduced the Iowa Detection Program (IDP), which leveraged 1748 digitized fundus-colored photographs from 847 individuals in France. IDP used multiple factors to generate a DR index ranging from 0 to 1, indicating the presence of referable DR. The initial IDP achieved specificity of 59.4%, sensitivity of 96.8%, and an AUC score of 0.937. Abramoff et al. later proposed integrating deep learning into IDP to enhance its capabilities for diagnosing retinopathy due to diabetes [9]. This upgrade surpassed previous techniques that used wavelet and mathematical morphological transformations. Deep learning, particularly Convolutional Neural Networks (CNN), outperformed conventional methods by directly extracting features from images. The researchers suggested employing personalized learning to identify DR lesions, achieving commendable results using the Messidor-2 database despite CNN’s limitations.
The application of deep learning techniques for diagnosing referable DR has gained prominence. Gulshan et al. [9] introduced a deep learning approach that amalgamated various DR conditions using freely available datasets Messidor-2 and EyePACS-1. Employing Convolutional Neural Networks (CNN), they trained the model by learning pixel intensities from fundus images. The CNN variables were adjusted based on the outcome’s error relative to the desired result [29]. By learning regional and global features from proximity pixels, CNN achieved an outstanding AUC score of 0.990 for Messidor-2 and 0.991 for EyePACS-1. Additionally, Table 5 presents comparison findings from a number of research, including those by Gulshan et al. [9], Antal et al. [27], Roychowdhury et al. [30], and Abramoff et al. [8]. Various techniques, such as deep learning, convolutional neural networks (CNNs), classifier ensembles, and supervised classifiers, are used in these studies to identify lesions in DR. Evaluation metrics, including sensitivity, specificity, and area under the curve (AUC), show how these methodologies perform on various datasets, such as EyePACS-1/Messidor-2 and Messidor, and offer important insights into how well they work for lesion detection in diabetic retinopathy.
4 Evaluation
The evaluation procedure incorporates the use of the confusion matrix, accuracy, sensitivity and specificity. A layout that mimics a table and includes the objective value as well as true positive as well as true negative outcomes is called a confusion matrix. Its definition has the following four components:
I. True positive (TP) items are those that are both declared to be true and are in fact true.
II. False positive (FP) - when values are true but incorrectly classified.
III. False negative (FN) results when a valid outcome is inadvertently interpreted negatively.
IV. True negative (TN) - has an unquestionably negative value that was genuinely present [31].
(a) Accuracy – It is determined by subtracting the results derived from a baseline value. The accuracy of a finding is the ratio of accurately matched all observations to predictions. Only if the database’s FP and FN rates are nearly equal can such an indicator be considered excellent. We must consider other criteria in order to evaluate an algorithm’s efficacy.
(b) Sensitivity – The proportion of instances classified as positive, or TP were foreseen with accuracy. Sensitivity is also known as recall. Thus, a true circumstance was assumed to be false.
(c) Specificity – Assessing the proportion of real cases that were labelled as negative shows how well a model is able to detect negative events. Another name for it is “real negative rate.”
(d) AUC – The likelihood that an arbitrary favourable instance will be placed ahead of an arbitrary unfavourable instance is encapsulated by AUC. AUC has a value which varies from 0 to 1. A system with entirely erroneous forecast possesses an AUC score of 0.0 while a system with 100% prediction accuracy achieves an AUC score of 1.0 [32].

Figure 4 Overall comparison for various methods for segmentation of blood vessels.
5 Results
5.1 Results for Blood Vessel Segmentation
Figure 4 from Lupascu et al. [24] shows that AdaBoost on the DRIVE dataset had an accuracy of 0.9597. A sensitivity of 0.72 indicates there is still space for improvement in identifying all pertinent features, nevertheless. An AUC of 0.9561 suggested that the method’s discrimination was highly effective. The DRIVE and STARE datasets were used by Wang et al. [22] to evaluate CNN and RF methods. While RF displayed competitive performance, albeit with lower accuracy and AUC, CNN demonstrated good accuracy, sensitivity, specificity, and reasonable AUC values. Both techniques successfully categorized dataset features. On the HRF database, Odstrcilik et al. [25] showed that the Improved Matched Filtering technique worked well with good accuracy, sensitivity, specificity, and AUC values. These findings point to its potential uses. In their evaluation of CNN variants on the DRIVE, STARE, and CHASE databases, Liskowski et al. [23] achieved high accuracy and AUC values, demonstrating their effectiveness in classifying database properties. On the DRIVE and STARE datasets, Fraz et al.’s [26] investigation of ensemble classifiers produced high AUC values, sensitivity, specificity, and accuracy. These results demonstrate the efficiency of ensemble-based algorithms in classifying database characteristics, indicating their applicability to image analysis and classification tasks.
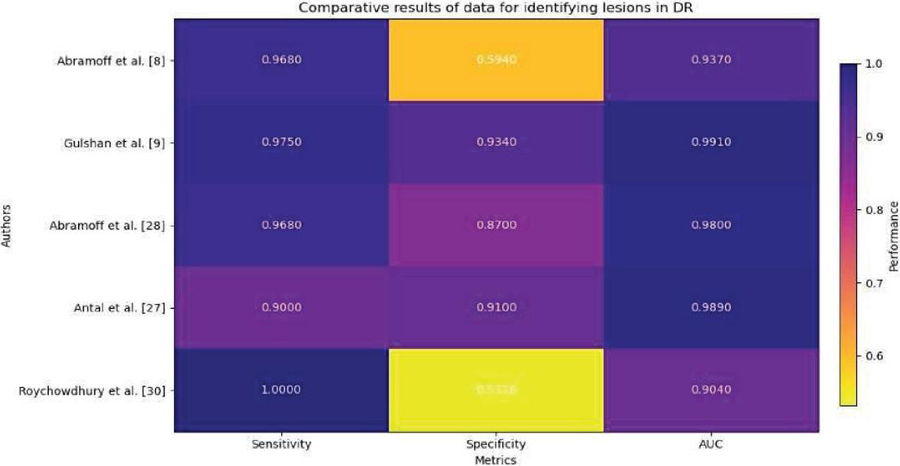
Figure 5 Overall comparison for various methods for detecting lesions.
5.2 Results for Lesion Identification
On the Messidor database, multiple classification schemes for diabetic retinopathy were evaluated in Figure 5. The IDP approach was used by Abramoff et al. [8], who obtained great sensitivity but only mediocre specificity. With an AUC of 0.937, the approach showed good discriminatory power. Deep learning techniques were used by Gulshan et al. [9] to analyze the EyePACS-1 and Messidor-2 datasets, yielding high sensitivity and specificity values as well as high AUC ratings. Using CNN approaches, Abramoff et al. [28] were able to provide results with a high sensitivity and a moderate specificity. With an AUC of 0.98, the CNN technique demonstrated high discriminatory ability. Antal et al.’s [27] Classifier Ensemble method resulted in great sensitivity, outstanding specificity, and a significant capacity for discrimination, as indicated by an AUC of 0.989. Supervised Classifiers were used by Roychowdhury et al. [30] to achieve full sensitivity but poor specificity. With an AUC score of 0.904, the approach exhibited a reasonably strong capacity for discrimination.
For segmentation of blood vessel:
On the DRIVE dataset and the STARE dataset, the approach put forward by Wang et al. [27], which combines Convolutional Neural Networks and Random Forest, achieves a high accuracy of 0.9767 and 0.9813, respectively. Additionally, the sensitivity and specificity scores for this technique are outstanding, demonstrating that it can precisely locate blood vessels in retinal pictures.
To identify lesions:
When examined on the EyePACS-1 and Messidor-2 databases, the deep learning technique developed by Gulshan et al. [9] stood out with a sensitivity of 0.975/0.961 and a specificity of 0.934/0.939. This technique has an impressive AUC of 0.991/0.990, underscoring its potency in locating lesions linked to diabetic retinopathy.
Wang et al. [27] suggested CNN and RF combination appears to be the most efficient technique for diabetic retinopathy blood vessel segmentation, displaying good accuracy and resilience across several databases. The deep learning strategy used by Gulshan et al. [9] to identify lesions performs better than previous approaches because of its elevated specificity and sensitivity.
6 Limitations and Challenges
Our study recognizes a number of limitations and issues, even as it highlights the potential benefits of AI in the detection and identification of lesions in diabetic retinopathy. The dependence of AI models on high-quality data is a major source of concern. Insufficient availability of thorough and precise annotations on datasets could impair algorithmic performance and generalizability. Furthermore, biases in the training data have the potential to compromise algorithmic fairness and exacerbate existing inequalities in healthcare outcomes. Another difficulty is interpreting results produced by AI, especially for healthcare professionals who are not specialists. The acceptance and use of AI models in clinical practice may be impeded by their opaque decision-making processes. The resource requirements and scalability of AI systems are practical challenges. AI solutions may be resource-intensive to deploy and maintain and need technical know-how, which makes them difficult to apply in actual clinical settings, particularly those with minimal resources.
7 Conclusion
The culmination of various studies and methodologies in diabetic retinopathy (DR) detection and diagnosis presents a promising outlook for clinical practice. The utilization of deep neural networks, particularly convolutional neural networks (CNNs) has demonstrated remarkable accuracy in segmenting blood vessels and identifying lesions associated with DR. The findings from Wang et al.’s approach, achieving high accuracy and exceptional sensitivity and specificity scores, underscore the efficacy of combining CNNs with random forests for precise blood vessel segmentation. Similarly, the deep learning technique devised by Gulshan et al. exhibits impressive sensitivity, specificity, and area under the curve (AUC) scores, indicating its proficiency in identifying DR lesions with heightened precision.
These advancements hold significant implications for clinical practice, offering healthcare providers robust tools for earlier and more precise identification of DR. By leveraging automated algorithms and deep learning methodologies, clinicians can streamline the diagnostic process, leading to expedited treatment interventions and improved patient outcomes. Furthermore, the robust performance of these techniques across diverse datasets highlights their potential for widespread application and integration into existing healthcare systems. Moving forward, further research and clinical validation of these methodologies are essential to solidify their efficacy and integration into routine clinical practice. Continued collaboration between researchers, clinicians, and technology developers is crucial to harness the full potential of these innovative technologies and ensuring their seamless integration into clinical workflows. Ultimately, these advancements illuminate a path towards enhanced DR management, offering hope for the prevention of vision loss and improved quality of life for individuals affected by this debilitating condition.
References
[1] Bidwai P, Gite S, Pahuja K, Kotecha K. A Systematic Literature Review on Diabetic Retinopathy Using an Artificial Intelligence Approach. Big Data and Cognitive Computing. 2022; 6(4):152. https://doi.org/10.3390/bdcc6040152.
[2] Wejdan L. Alyoubi, Wafaa M. Shalash, Maysoon F. Abulkhair, Diabetic retinopathy detection through deep learning techniques: A review, Informatics in Medicine Unlocked, Volume 20, 2020, 100377, ISSN 2352-9148, https://doi.org/10.1016/j.imu.2020.100377.
[3] Kusuhara, Sentaro, Fukushima, Yoko, Ogura, Shuntaro, Inoue, Naomi, Uemura, Akiyoshi. (2018). Pathophysiology of Diabetic Retinopathy: The Old and the New. Diabetes & Metabolism Journal. 42. 364. doi: 10.4093/dmj.2018.0182.
[4] S. Qummar et al., “A Deep Learning Ensemble Approach for Diabetic Retinopathy Detection,” in IEEE Access, vol. 7, pp. 150530–150539, 2019, doi: 10.1109/ACCESS.2019.2947484.
[5] Nakayama Luis Filipe, Ribeiro Lucas Zago, Malerbi Fernando Korn, Regatieri Caio Vinicius Saito, Ophthalmology and Artificial Intelligence: Present or Future? A Diabetic Retinopathy Screening Perspective of the Pursuit for Fairness, Frontiers in Ophthalmology, 2, 2022. 2674-0826, doi: 10.3389/fopht.2022.89818. https://www.frontiersin.org/articles/10.3389/fopht.2022.898181.
[6] Varma, R., Bressler, N. M., Doan, Q. V., Danese, M., Dolan, C. M., Lee, A., and Turpcu, A. (2015). Visual impairment and blindness avoided with ranibizumab in Hispanic and non-Hispanic whites with diabetic macular edema in the United States. Ophthalmology, 122(5), 982–989.
[7] Mehta, H., Tufail, A., Daien, V., Lee, A. Y., Nguyen, V., Ozturk, M., …and Gillies, M. C. (2018). Real-world outcomes in patients with neovascular age-related macular degeneration treated with intravitreal vascular endothelial growth factor inhibitors. Progress in retinal and eye research, 65, 127–146.
[8] Abràmoff, M. D., Folk, J. C., Han, D. P., Walker, J. D., Williams, D. F., Russell, S. R., …and Niemeijer, M. (2013). Automated analysis of retinal images for detection of referable diabetic retinopathy. JAMA ophthalmology, 131(3), 351–357.
[9] Gulshan, V., Peng, L., Coram, M., Stumpe, M. C., Wu, D., Narayanaswamy, A., …and Webster, D. R. (2016). Development and validation of a deep learning algorithm for detection of diabetic retinopathy in retinal fundus photographs. jama, 316(22), 2402–2410.
[10] Kermany, D. S., Goldbaum, M., Cai, W., Valentim, C. C., Liang, H., Baxter, S. L., …and Zhang, K. (2018). Identifying medical diagnoses and treatable diseases by image-based deep learning. cell, 172(5), 1122–1131.
[11] W. M. Gondal, J. M. Köhler, R. Grzeszick, G. A. Fink and M. Hirsch, “Weakly-supervised localization of diabetic retinopathy lesions in retinal fundus images”, Proc. IEEE Int. Conf. Image Process. (ICIP), pp. 2069–2073, Sep. 2017.
[12] Z. Wang, Y. Yin, J. Shi, W. Fang, H. Li and X. Wang, “Zoom-in-net: Deep mining lesions for diabetic retinopathy detection” in Int. Conf. Med. Image Comput. Comput.-Assist. Intervent, Berlin, Germany:Springer, pp. 267–275, 2017.
[13] T. Chandrakumar and R. Kathirvel, “Classifying diabetic retinopathy using deep learning architecture”, Int. J. Eng. Res. Technol., vol. 5, no. 6, pp. 19–24, Jun. 2016.
[14] H. Pratt, F. Coenen, D. M. Broadbent, S. P. Harding and Y. Zheng, “Convolutional neural networks for diabetic retinopathy”, Procedia Comput. Sci., vol. 90, pp. 200–205, Jan. 2016.
[15] Y. Yang, T. Li, W. Li, H. Wu, W. Fan and W. Zhang, “Lesion detection and grading of diabetic retinopathy via two-stages deep convolutional neural networks”, Proc. Int. Conf. Med. Image Comput. Comput.-Assist. Intervent, pp. 533–540, 2017.
[16] Shu-I Pao, Hong-Zin Lin, Ke-Hung Chien, Ming-Cheng Tai, Jiann-Torng Chen, Gen-Min Lin, “Detection of Diabetic Retinopathy Using Bichannel Convolutional Neural Network”, Journal of Ophthalmology, vol. 2020, Article ID 9139713, 7 pages, 2020. https://doi.org/10.1155/2020/9139713.
[17] Gao Jinfeng, Sehrish Qummar, Zhang Junming, Yao Ruxian, Fiaz Gul Khan, “Ensemble Framework of Deep CNNs for Diabetic Retinopathy Detection”, Computational Intelligence and Neuroscience, vol. 2020, Article ID 8864698, 11 pages, 2020. https://doi.org/10.1155/2020/8864698.
[18] Muhammad Mateen, Junhao Wen, Nasrullah Nasrullah, Song Sun, Shaukat Hayat, “Exudate Detection for Diabetic Retinopathy Using Pretrained Convolutional Neural Networks”, Complexity, vol. 2020, Article ID 5801870, 11 pages, 2020. https://doi.org/10.1155/2020/5801870.
[19] D. Siva Sundhara Raja, S. Vasuki, “Automatic Detection of Blood Vessels in Retinal Images for Diabetic Retinopathy Diagnosis”, Computational and Mathematical Methods in Medicine, vol. 2015, Article ID 419279, 12 pages, 2015. https://doi.org/10.1155/2015/419279.
[20] Nagaraja Gundluru, Dharmendra Singh Rajput, Kuruva Lakshmanna, Rajesh Kaluri, Mohammad Shorfuzzaman, Mueen Uddin, Mohammad Arifin Rahman Khan, “Enhancement of Detection of Diabetic Retinopathy Using Harris Hawks Optimization with Deep Learning Model”, Computational Intelligence and Neuroscience, vol. 2022, Article ID 8512469, 13 pages, 2022. https://doi.org/10.1155/2022/8512469.
[21] Gupta, Ankita and Chhikara, Rita. (2018). Diabetic Retinopathy: Present and Past. Procedia Computer Science. 132. 1432–1440. doi: 10.1016/j.procs.2018.05.074.
[22] Wang, Shuangling, et al. (2015) “Hierarchical retinal blood vessel segmentation based on feature and ensemble learning.” Neurocomputing 149: 708–717.
[23] Liskowski, Paweł, and Krzysztof Krawiec.(2016) “Segmenting retinal blood vessels with deep neural networks.” IEEE transactions on medical imaging 35(11): 2369–2380.
[24] Lupascu, Carmen Alina, Domenico Tegolo, and Emanuele Trucco. (2010) “FABC: retinal vessel segmentation using AdaBoost.” IEEE Transactions on Information Technology in Biomedicine 14(5): 1267–1274.
[25] Odstrcilik, Jan, et al. (2013) “Retinal vessel segmentation by improved matched filtering: evaluation on a new high-resolution fundus image database.” IET Image Processing 7(4): 373–383.
[26] Fraz, Muhammad Moazam, et al. (2012) “An ensemble classification-based approach applied to retinal blood vessel segmentation.” IEEE Transactions on Biomedical Engineering 59(9): 2538–2548.
[27] Antal, Bálint, and András Hajdu. (2014) “An ensemble-based system for automatic screening of diabetic retinopathy.” Knowledge-based systems 60: 20–27.
[28] Abràmoff, Michael David, et al. (2016) “Improved automated detection of diabetic retinopathy on a publicly available dataset through integration of deep learning.” Investigative ophthalmology & visual science 57(13): 5200–5206.
[29] Singh, Anju, Singh, Divakar, Sharma, Shikha, Upreti, Kamal, Maheshwari, Manish, Mehta, Vimal, Sharma, Jitender, Mehra, Pratishtha and Dabla, Pradeep. (2022). Discovering Patterns of Cardiovascular Disease and Diabetes in Myocardial Infarction Patients Using Association Rule Mining. Folia Medica Indonesiana. 58. 242–250. doi: 10.20473/fmi.v58i3.34975.
[30] Roychowdhury, Sohini, Dara D. Koozekanani, and Keshab K. Parhi. (2014) “Dream: Diabetic retinopathy analysis using machine learning.” IEEE journal of biomedical and health informatics 18(5): 1717–1728.
[31] Kapoor, Anmol, Kapoor, Shreya, Upreti, Kamal, Singh, Prashant, Kapoor, Seema, Alam, Mohammad, and Nasir, Mohammad. (2023). Cardiovascular Disease Prognosis and Analysis Using Machine Learning Techniques. doi: 10.1007/978-3-031-25088-0_15.
[32] Singh, Anju, Singh, Divakar, Sharma, Shikha, Upreti, Kamal, Maheshwari, Manish, Mehta, Vimal, Sharma, Jitender, Mehra, Pratishtha, Dabla, Kumar and Dabla, Pradeep. (2022). Original Research Report Discovering Patterns of Cardiovascular Disease and Diabetes in Myocardial Infarction Patients using Association Rule Mining. 242–250. doi: 10.20473/fmi.v58i3.34975.
[33] Rakhlin, Alexander. (2018). Diabetic Retinopathy detection through integration of Deep Learning classification framework. doi: 10.1101/ 225508.
[34] S. Qummar et al., “A Deep Learning Ensemble Approach for Diabetic Retinopathy Detection,” in IEEE Access, vol. 7, pp. 150530–150539, 2019, doi: 10.1109/ACCESS.2019.2947484.
Biographies

Kamal Upreti is currently working as an Associate Professor in Department of Computer Science, CHRIST (Deemed to be University), Delhi NCR, Ghaziabad, India. He completed is B. Tech (Hons) Degree from UPTU, M. Tech (Gold Medalist), PGDM(Executive) from IMT Ghaziabad and PhD in Department of Computer Science & Engineering. Recently, he has completed Postdoc from National Taipei University of Business, TAIWAN funded by MHRD.
He has published 50+ Patents, 45+ Books, 32+Magazine issues and 100+ Research papers in in various international Conferences and reputed Journals. His areas of Interest are Data Analytics, Cyber Security, Machine Learning, Health Care, Embedded System and Cloud Computing. He is having enriched years’ experience in corporate and teaching experience in Engineering Colleges.
He has attended as a Session Chair Person in National, International conference and key note speaker in various platforms such as Skill based training, Corporate Trainer, Guest faculty and faculty development Programme. He awarded as best teacher, best researcher, extra academic performer and Gold Medalist in M. Tech programme.

Anmol Kapoor has completed his graduation in Department of Computer Science and Engineering from Guru Gobind Singh Indraprastha University. He has embraced a career as a software engineer. He is having more enthusiasm in exploring the forefront of technology, particularly Machine Learning (ML) and Blockchain. Through dedicated research, he has investigated ML’s role in revolutionizing healthcare and Blockchain’s potential for transformative impact. Currently, his focus areas include diabetic retinopathy analysis, object tracking, and sentiment analysis in finance, where he strive to bridge the gap between technology and real-world applications. Beyond my professional pursuits, he is actively engage in hackathons, mentorship programs, and community initiatives, seeking to contribute to the tech ecosystem.

Sheela Hundekari, presently working as Associate Professor in MITCOM, MCA dept. at MIT ADT University, Loni kalbhor, Pune 412201, Her research interests are Artificial intelligence, Machine Learning, Deep Learning. She has published research papers in reputed Scopus and Springer Journals. A certified full stack Java trainer.

Shitiz Upreti is currently working as an Assistant Professor (MBA) in the Department of IT & Management, Maharishi Markandeshwar (Deemed to be University), Mullana-Ambala, Haryana. He has around 11 years of experience in the field of teaching, training and research development. He completed his B.Tech and M.Tech in the field of Electronics & Communication Engineering. He also done MBA in the field of IT & Operation Research. Currently, pursuing Ph.D. (Final Viva Pending) in the field of IT & Wireless Communication Engineering.
His area of interest includes Wireless communication, Machine Learning, Cloud Computing and Data Analytics. He also attended various FDPs and workshops regarding Machine Learning, SPSS & Blockchain Technology.
Kajal Kaul is working as an Assistant Professor at Bharati Vidyapeeth College of Engineering, New Delhi. She has a teaching experience of 3 years in this field. She is pursuing her PhD in Computer Science Engineering from University School of Information, Communication & Technology(USICT), Guru Gobind Singh Indraprastha University(GGSIPU). Her research interest is Deep Learning, Image Processing, IOT, etc.
Shreya Kapoor is currently doing B.Tech in department of Computer Science and Engineering at Guru Gobind Singh Indraprastha University. Her academic journey aligns with a deep interest in cutting-edge technologies, specifically ML in healthcare and Blockchain. Through dedicated research, she has explored these fields, leading to a significant research paper. This work delves into the potential of ML to revolutionize healthcare while leveraging the transformative impact of blockchain technology. She has more enthusiastic about contributing fresh insights at the intersection of these domains, driven by a genuine passion for advancing technology’s role in healthcare. In upcoming research, She is exploring diabetic retinopathy analysis, object tracking, and sentiment analysis in finance.

Akhilesh Tiwari, an MBA and PhD holder, boasts 23 years of teaching experience. With a consistent academic performance, he excels in teaching and researching subjects such as Quantitative Techniques, Operations Research, Operations Management, Digital Marketing, Business Mathematics and Statistics, E-Business, E-Commerce, and Supply Chain Management. As a consultant and external trainer, Dr. Tiwari has conducted successful workshops on various Operation Research Models and Optimization Techniques for esteemed institutions including the Armed Forces, University of Allahabad, and Ericsson India Ltd.
Over his 23-year academic journey, he has groomed management students in subjects like Operation Research, Quantitative Techniques, Digital Marketing, E-Business, E-commerce and Production and Operations Management. Currently pursuing post-doctoral challenges (D. Litt) to explore the impact of online marketing on consumer behavior, Dr. Tiwari has also led the introduction of new management programs at Devi Ahilya University Indore, including Hospital Administration, E-Commerce, and Financial Administration. He is the author of three textbooks published by Shail Publications Allahabad, namely “Fundamentals of Operations Research,” “Business Statistics and Mathematics,” and a PhD entrance test book. His extensive experience encompasses a range of academic, administrative, and developmental assignments crucial to management institutes, including organizing management conferences, conducting training programs, facilitating faculty development, managing examinations, coordinating specialization programs, and overseeing student cultural affairs and summer training projects.
Journal of Mobile Multimedia, Vol. 20_2, 495–524.
doi: 10.13052/jmm1550-4646.20210
© 2024 River Publishers