Downlink Power Allocation with Stackelberg Game in NOMA System
Chih-Cheng Tseng1, Yao-Jen Liang2, Hwang-Cheng Wang2, Chi-Han Chen2 and Fang-Chang Kuo2,*
1No.2, Beining Rd., Jhongjheng District, Keelung City 202301, Taiwan (R.O.C.)
2No.1, Sec. 1, Shennong Rd., Yilan City, Yilan County 260, Taiwan (R.O.C.)
E-mail: cctseng@mail.ntou.edu.tw; yaojen@niu.edu.tw; hcwang@niu.edu.tw; tonyredjjj@gmail.com; kfc@niu.edu.tw
*Corresponding Author
Received 31 January 2024; Accepted 02 December 2024
Abstract
Non-Orthogonal Multiple Access (NOMA) is regarded as one of the most promising technologies for the fifth generation (5G) mobile communications. This paper delves into the NOMA downlink power allocation under the introduction of a Stackelberg game with uniform pricing and discounted pricing strategies, specifically addressing scenarios involving imperfect successive interference cancellation (SIC). The Stackelberg game is commonly employed to characterize strategic interactions, inherently involving a leader and followers. In this paper, the base station plays the role of the leader, making decisions regarding the price charged to the followers. On the other hand, users take on the role of followers, deciding the quantity of power to purchase. In each round of the game, driven by the pursuit of maximizing their respective utility functions, both roles iteratively adjust their strategies based on the decisions proposed by the other party until reaching the Stackelberg Equilibrium. Through the simulations, we compare the power allocated to the users and the obtained achievable rates under different scenarios, including imperfect SIC with uniform (ISIC-U) pricing strategy, imperfect SIC with discounted (ISIC-D) pricing strategy, and perfect SIC (PSIC). Simulation results reveal that the proposed ISIC-U and ISIC-D can obtain better power saving and fairness among achievable rates, while only sacrifice quite limited total achievable rate.
Keywords: 5G, game theory, Stackelberg game, NOMA.
1 Introduction
Traditional Fourth Generation (4G) mobile communication employs Orthogonal Multiple Access (OMA) technology, utilizing different orthogonal channels for transmission to enable multiple users to communicate simultaneously without interference. This technology has significantly improved spectrum efficiency but falls short in meeting the increasing demand for wireless communication posed by emerging technologies such as the Internet of Things (IoT), Vehicle to Everything (V2X), Extended Reality (XR), and others. The advent of the Fifth Generation (5G) mobile communication aims to enhance Quality of Experience (QoE) and provide better Quality of Service (QoS). To meet the requirements of QoE and QoS of 5G, Non-Orthogonal Multiple Access (NOMA) technology allows multiple users to use the same channel simultaneously, thereby greatly improving transmission efficiency.
NOMA technology can be further classified into Power Domain NOMA (PD-NOMA) and Code Domain NOMA (CD-NOMA) [1]. This paper primarily focuses on PD-NOMA, where multiple users are differentiated based on different power levels when using the same channel simultaneously. To achieve this, PD-NOMA relies on Successive Interference Cancellation (SIC) [2, 3] at the receiver to eliminate interference between different users on the same wireless channel. Although the use of SIC increases receiver complexity, it significantly enhances transmission efficiency. However, the principle of interference elimination and user discrimination through SIC relies on clear differences in power allocation among users. The strength of these differences directly impacts the interference elimination capability of SIC, thereby affecting transmission rates.
Different from the performance analyses of the PD-NOMA under the perfect SIC assumption, the study of PD-NOMA under the assumption of imperfect SIC attracted limited attention [4] distorted the signal by adding Rayleigh fading and AWGN to the signals of far users, that made SIC unable to proceed perfectly, and analyzed the performances of perfect SIC and imperfect SIC. The authors in [5] analyzed the residual interference in the case of imperfect SIC and proposed a power allocation plan that targets energy-efficiency and reduces the impact of residual interference. The concept of imperfect SIC is also widely used to discuss on the sharing bandwidth [6]. In [7], the authors used improper Gaussian signaling to interpret imperfect SIC and analyzed the resulted performance. Furthermore, studies considering only the perfect SIC and employing price-based method to find out the best power allocation schemes can be found in [8, 9]. Unlike previous researches related to PD-NOMA that assumed perfect SIC interference elimination, this paper considers the imperfect SIC scenario and introduces a Stackelberg game [10] to maximize the utility functions of the Leader and Follower in downlink power allocation. This paper captures the iterative decision-making process and continuous strategy adjustments through the game-theoretic approach.
This paper is organized as follows. The system model is described in Section 2. Sections 3 and Section 4 depict the proposed design of the downlink power allocation with uniform pricing and its simulation results. Section 5 describes the proposed design of the downlink power allocation with discounted pricing. The simulation results of the proposed approach and the performance comparisons with the existing price-based power allocation method [8] are discussed in Section 6. Section 7 concludes this paper.
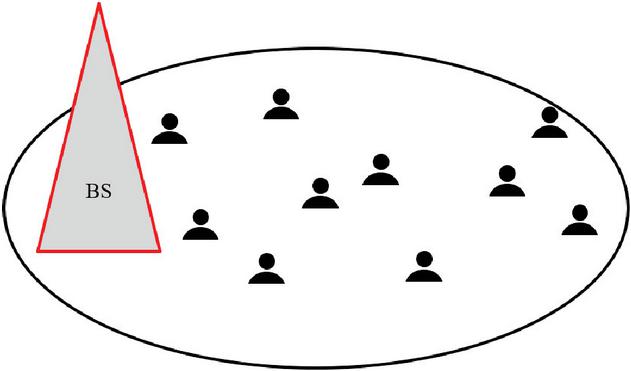
Figure 1 System model.
2 System Model
In the considered NOMA system depicted in Figure 1, the system comprises a base station and multiple users. The distinctive feature of NOMA lies in its ability to allocate wireless resources to users in a non-orthogonal manner, enabling simultaneous usage by multiple users at the same time [11]. Assuming the system has N channels, and each channel can accommodate a maximum of 2 users simultaneously. Hence, the total number of users the system can accommodate is 2N. The power allocated to users on the channels varies based on the proximity of users to the base station. Stronger power is allocated to users farther away, while weaker power is assigned to users closer to the base station. The subsequent explanation will delve into the grouping methodology based on the proximity of users.
2.1 Grouping Users
The methodology used to group 2 users on every channel is based on the proximity of users and is illustrated in Figure 2. Assuming that the distances between the base station and any 2 users are different, the N users farthest from the base station among the 2N users are labelled from farthest to nearest as 1 to N. This group constitutes the set of distant users . The remaining N users, who have not yet been grouped, are similarly labelled from farthest to nearest as 1 to N based on their distances from the base station, forming the set of near users .
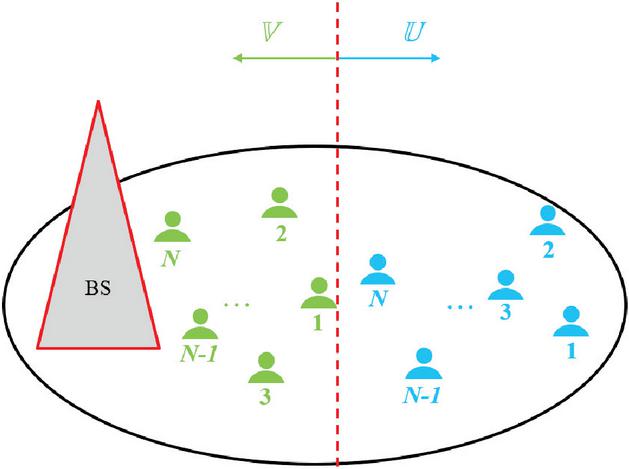
Figure 2 Illustration of grouping users.
2.2 The Grouping Results
The combination of the grouping results and channel allocation is illustrated in Figure 3. Users in the sets U and V with the same label are assigned to the corresponding numbered channel. The two users on the same channel are referred to as a user pair. The horizontal axis of Figure 3 represents the channel number denoted by i, where , and the vertical axis denotes the power allocated to the channel, with P representing the total power limit available for each channel. This paper assumes a fixed maximum transmission power for the base station. Therefore, the maximum usable power P on each channel is influenced by the total number of channels. Specifically, with more channels, the total usable power P for each channel decreases, and conversely, with fewer channels, the total usable power P for each channel increases.
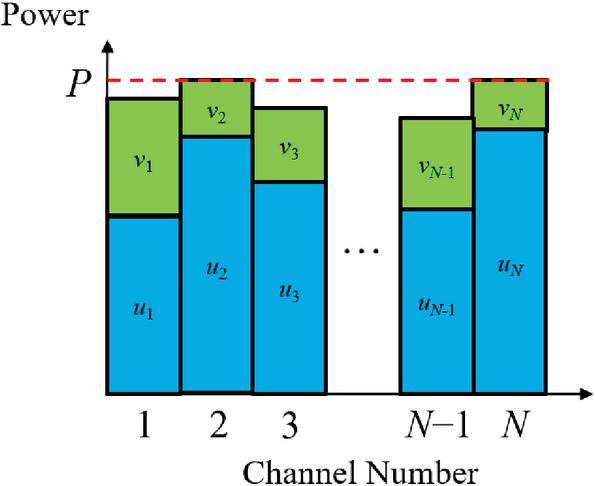
Figure 3 Allocation of channels to groups.
3 Downlink Power Allocation with Uniform Pricing Strategy
3.1 Achievable Rate
Given the allocated power, the achievable rate can be calculated according to Shannon’s law. Therefore, the achievable rate for user located on the i-th channel can be defined as
| (1) |
where the channel bandwidth is represented by B, the power of user is represented by , the power of user is represented by , the channel gain of is denoted by , and the channel coefficient h is defined as , where G represents antenna gain, represents the fading coefficient, represents shadow fading, d represents the distance between the user and the base station, and represents the path loss exponent [12–14]. In this paper, the channel fading and the impact of antenna gain are not considered, so the values of G, , and are set to 1. Finally, the channel coefficient is simplified as . In the calculation objective of (1), considering the distance between the base station and user , the channel gain can be expressed as , and represents noise power.
Taking into account the imperfect interference elimination caused by SIC, the achievable rate for users on the i-th channel can be defined as
| (2) |
The computation objective of (2) takes into account the distance between the base station and the user . Therefore, the channel gain can be expressed as . Besides, represents the interference weighting factor, indicating the impact of interference that cannot be eliminated by SIC. In this paper, this weighting factor is defined as
| (3) |
3.2 Utility of the Leader
Similar to the applications of Stackelberg game to solve the power allocation problem in the mobile communications [15, 16], the utilities of Leader and Follower need to be defined. In the designed Stackelberg game, the base station acting as the Leader can be likened to a seller in the market, acquiring profits by selling power. If the Leader charges users based on the per-unit power , then the utility for the Leader on the i-th channel is defined as
| (4) |
The optimization problem for the utility of Leader can be formulated as
| (5) |
with the constraint
| (6) |
3.3 Utility of the Follower
In the designed Stackelberg game, the users are playing the role of the Follower and can be likened to buyers in the market. On the -th channel, the Follower determines the desired power levels and to purchase based on the price proposed by the Leader. Subsequently, the power acquired from the Leader is converted into transmission power using Equations (1) and (2). This is considered as the revenue of Follower. The cost associated with purchasing power is considered as an expense. The profit of Follower is calculated by subtracting the cost from the revenue. Therefore, the utility for the Follower on the i-th channel is defined as
| (7) |
By applying (1) and (2), (7) can be rewritten as
| (8) |
The optimization problem of can be defined by
| (9) |
with the constraints
| (10) |
The lower bound of the second constraint requests that the power of the user must be at least 1 mW.
3.4 The Designed Stackelberg Game
The Stackelberg game, composed of a Leader and a Follower, begins with the Leader formulating the initial strategy as the starting point of the game. Subsequently, during the course of the game, the Follower determines its strategy based on the strategy of the Leader. The Leader, in turn, adjusts its strategy in response to the choices of the Follower. This iterative process continues until the game reaches equilibrium, wherein both parties aim to maximize their respective utilities, leading to a convergence of strategies and approaching optimal outcomes.
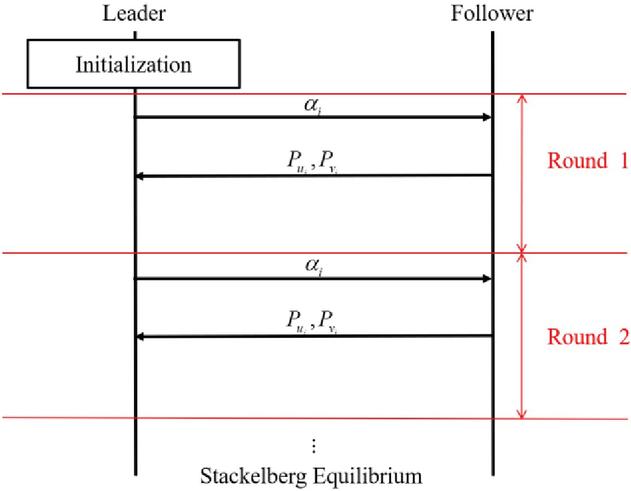
Figure 4 Illustration of the operations of the proposed Stackelberg game.
The operations of the Stackelberg game are illustrated in Figure 4. Throughout the operations, the Leader and Follower continually make strategic decisions based on known conditions, involving the calculation and updating of (5) and (3.3). Both (5) and (3.3) represent constrained non-linear convex optimization problems, which can be solved using the interior point method. The resulting profits from each round serve as the basis for determining the range of the price, facilitating the contraction of the range to approach the Stackelberg equilibrium (SE).
3.4.1 Operations in the initialization stage
According to the constraint in (6), the pricing strategy of Leader is upper and lower bounded by and with the initial values of and , respectively. Hence, the initial pricing strategy of the Leader is determined by . In the designed Stackelberg game, the Leader compares the profit of the current round with that of the previous round , using the comparison result as a basis for adjusting pricing strategies in subsequent rounds. The profit of the first round is set to 1 in the proposed design, serving as a crucial criterion to effectively identify whether it is the initial round of the game. This also helps avoid incorrect comparisons between the profit of the current round and the previous round , especially when the Leader proposes a high price that discourages the Follower from purchasing power. In such cases, it could lead to an inaccurate comparison between the profit of the two rounds. Additionally, the profit from the previous round is not meaningful in the first round. The definition of rounds in the designed Stackelberg game is determined by the Leader, starting from the decision-making process of pricing and concluding when the Leader computes the profit for the current round .
3.4.2 Operations in the First Round
Based on the given initial power pricing and , Leader utilizes the interior point method to determine the optimal pricing strategy for (5). The obtained result is then forwarded to the Follower.
Based on the pricing strategy of the Leader, the Follower employs the interior point method to find the optimal power allocation scheme and for (3.3). The Follower assesses whether this power allocation strategy is profitable. If the price proposed by the Leader is too high, leading to potential losses for the Follower, the Follower chooses not to purchase power, i.e., and . Based on such a strategy, the Follower compels the Leader to lower the proposed price. After determining the power purchase decision for the current round, the Follower forwards the results to the Leader.
Considering the returned power allocation results and from the Follower, as well as the current pricing , the Leader calculates the actual profit for the round using (4). The value of is then updated to for reference in adjusting pricing in the next round.
3.4.3 Operations in the other rounds
In the rounds other than the first one, the Leader makes decisions based on two different scenarios: and . If , it indicates that the pricing strategy determined in the last round was too high, causing the Follower unable to afford the cost of purchasing power. As a result, the Leader gets no profit. Consider the situation where excessively high price also prevents the Leader from making a profit. At the beginning of the round, the Leader will adjust the upper limit of price through to mitigate this issue. Subsequently, the Leader will recalculate the optimal pricing strategy based on the new pricing range and forward the updated price to the Follower.
According to the updated , the Follower is tasked with determining and updating a new power allocation strategy and . Similarly, after examining whether there is any deficit under this power allocation strategy, the Follower will forward the updated power allocation strategy to the Leader.
Table 1 Stackelberg game algorithm
| 1: Initialization: |
| , count=0 |
| 2: Repeat |
| 3:RepeObtain by using (5) |
| 4:RepeObtain and by using (3.3) |
| 5:Repeif |
| 6: Repe if |
| 7: Repe if Obtain by using (4) |
| 8: Repe if |
| 9:Repeend if |
| 10:Re0if |
| 11:Re0 if |
| 12:Re0else if |
| 13:Re0 else if |
| 14:Re0else if |
| 15:Re0 else if |
| 16:Re0end if |
| 17:Re0if |
| 18:Re0 ekscount=count+1 |
| 19:Re0else |
| 20:Re0 ekscount=0 |
| 21:Re0end if |
| 22: Until count==Target |
The Leader will utilize the received power allocation strategy and , along with the updated price , to calculate the profit for the current round through (4), and then update the values of as , serving as a reference for adjusting price in the next round. If , the optimal price found by utilizing the interior point method would be the upper limit among the possible range of price. Therefore, continual updating and narrowing the range will be required in the subsequent price adjustment process. The Leader adjusts the upper or lower limit of the price by determining whether the profit based on the decision in the current round is better than the profit in the previous round . If lowering the price results in profit growth, i.e., , the Leader adjusts the upper limit of price by setting . Subsequently, the Leader continues to lower the upper limit of the price through , while the lower limit remains unchanged. Conversely, if lowering the price leads to reduced profit, i.e., , the Leader increases the lower limit of price by setting . Subsequently, the Leader continues to lower the upper limit of pricing through (. The process is regarded as converged to the Stackelberg equilibrium (SE) state if is less than a threshold value, , for a target consecutive number of rounds, . Before that, the process is repeated. The algorithm of Stackelberg game mentioned above is shown in Table 1.
4 Simulation Results for Downlink Power Allocation with Uniform Pricing Strategy
The simulations are conducted in MATLAB to illustrate the power allocation results determined by the user pair in a Stackelberg game with respect to the four distance cases shown in Table 2. In the simulation, it is assumed that the coverage area of the base station is a circular region with a radius . The value of maximum power on each channel P is obtained by uniformly assigning the transmit power of the BS (38 dBm) (in Table 6.2.1-1 of [17]) to N channels. For simplicity, the initial power values for users and in the simulation are assumed the same and fixed for the four cases. The parameter values used in the simulation are outlined in Table 3. Based on Table 3, the value of P is 525 mW.
Table 2 The four distance cases
| Item | Definition | Distance Pattern |
| Case 1 | Users and are located around the cell edge | |
| Case 2 | User is at the cell edge, User is close to the base station | |
| Case 3 | Users and are located around | |
| Case 4 | Users and are close to the base station |
| Parameter | Value | Parameter | Value |
| Channel bandwidth (B) | 15 kHz | Number of channels (N) | 12 |
| Cell radius () | 250 m | Utility of Leader in the first round () | 1 bps |
| Noise power () | 610 mW | Threshold value () | 10 bps |
| Path loss exponent () | 3 | Target number of rounds () | 5 |
| Upperbound of initial price () | 10000 bps/mW | Initial power of user () | 300 mW |
| Lowerbound of initial price () | 1 bps/mW | Initial power of user () | 100 mW |
Figure 5 shows the relationship between the allocated power and rounds for Case 1. From the figure, it can be observed that for the first 6 rounds, users and purchase zero power. This is because the pricing strategy of the Leader in these rounds is too expensive, resulting in the Follower being unable to profit from purchasing power. Therefore, they choose not to purchase power. As the pricing continues to decrease, starting from the 7-th round, the Follower begins to be willing to purchase power. Additionally, in the subsequent rounds, the proportion of power allocation varies due to adjustments in the pricing strategy of Leader in each round, until the 24-th round where convergence is achieved by satisfying the target number of consecutive occurrences falling below the allowable value.
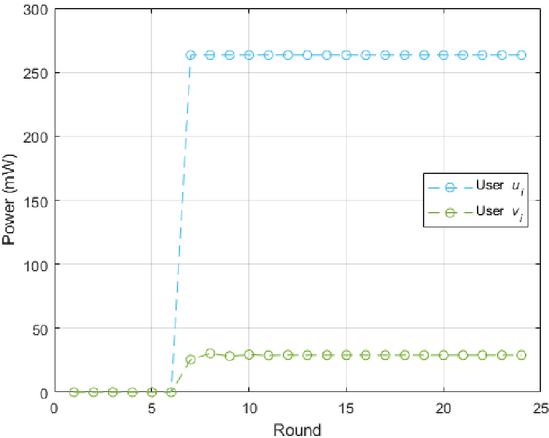
Figure 5 The relationship between the allocated power and rounds for Case 1.
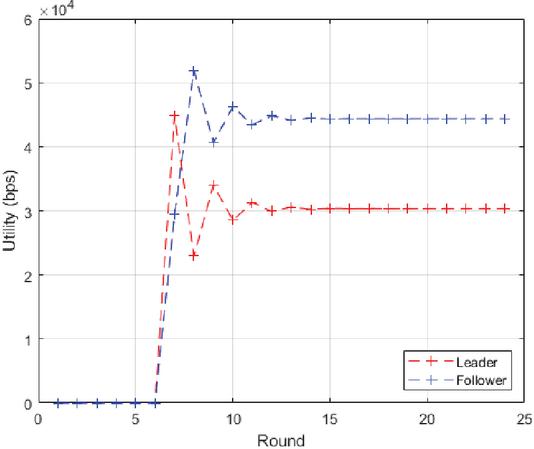
Figure 6 The relationship between the utility and the rounds for Case 1.
Figure 6 illustrates the relationship between the utility and rounds for Case 1. From the figure, it can be observed that the utility for both the Leader and the Follower is zero for the first 6 rounds. Referring to Figure 5, this is because the price proposed by the Leader is too high, resulting in the Follower not purchasing power, thereby preventing both parties from profiting. Starting from the 7-th round, as the Leader reduces the price, the Follower starts to purchase power and the Leader begins to profit under this strategy. In the subsequent rounds, there is a clear characteristic of trade-off between the strategies of both parties. This is because the optimal decisions made by the Leader and the Follower based on their respective utility functions are not necessarily optimal for the other party. Therefore, through the progression of the game, both parties continuously adjust their strategies to find an equilibrium point.
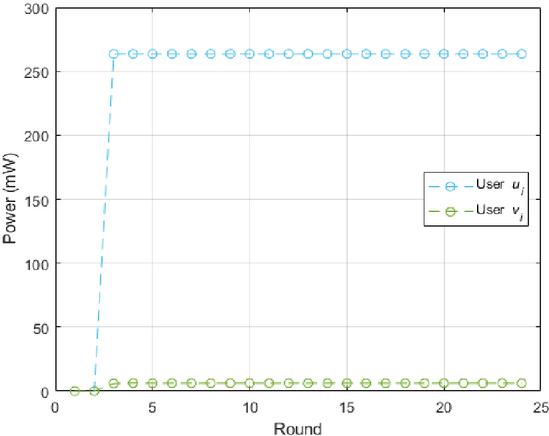
Figure 7 The relationship between the allocated power and rounds for Case 2.
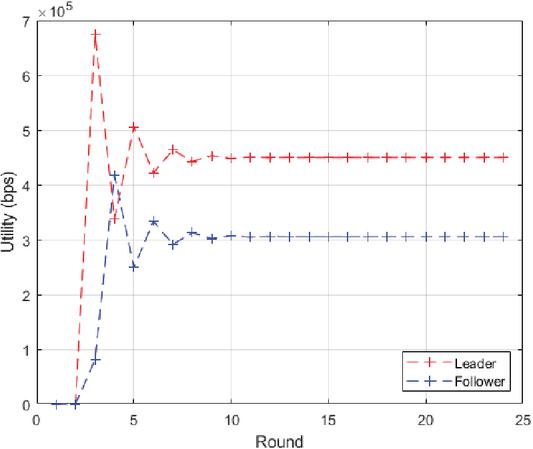
Figure 8 The relationship between the utility and the rounds for Case 2.
Figure 7 shows the relationship between the allocated power and rounds for Case 2. Similar to Case 1, users and do not purchase power initially due to the high initial pricing set by the Leader. Because the Follower is reluctant to purchase power, the Leader also fails to profit as indicated in Figure 8. However, as the price proposed by the Leader decreases, the Follower becomes willing to purchase power, leading to profits for the Leader. After the 2-nd round in Figure 8, the proportion of power allocation varies due to adjustments in the price proposed by the Leader in each round. The strategies of both the Leader and the Follower also mutually influence each other. Convergence is achieved by the 24-th round due to satisfying the target number of consecutive occurrences falling below the allowable value.
The simulation results for Case 3 and Case 4 exhibit similar trends to Case 1. Therefore, it can be inferred that the Stackelberg game with the uniform pricing designed in this paper facilitates interaction between the Leader and the Follower. The Leader adjusts pricing strategies based on actual profits, while the Follower adjusts its power purchasing strategies in response. By comparing the growth or decrease in profits, the upper and lower limits of the price are updated, allowing for the contraction of the adjustable pricing range. This gradual convergence in the game leads to the determination of optimal pricing strategies and downlink power allocation.
However, from the analysis of the simulation results for the four different cases, it is evident that the impact of reducing the price proposed by the Leader on user is not significant. Regardless of the pricing adjustment, user tends to purchase power at the minimum power constrained by (10). This is because the designed Stackelberg game considers the perspectives of both the Leader and the Follower, with utility functions designed to consider the interests of both parties. However, within the role of the Follower, which encompasses users and , there are differences in distance and factors such as interference, making user disadvantaged. Therefore, the Stackelberg game conducted under a uniform pricing strategy may find the optimal power allocation scheme for the Follower, but it may not be fair for user and may not accurately reflect the impact of different pricing on the power purchase of users. To address this issue, this paper attempts to introduce the concept of offering preferential measures by proposing different pricing strategies for users.
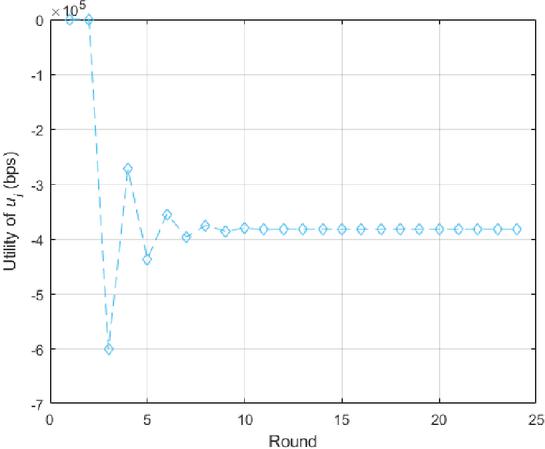
Figure 9 The relationship between the utility of and the rounds for Case 2.
5 The Downlink Power Allocation with Discounted Pricing Strategy
5.1 Reasons for User Purchasing The Lowest Power
Taking Case 2 as an example, Figures 9 and 10 respectively depict the relationship between utility and rounds for the two Followers and . From Figure 9, it can be observed that the profits of user are negative. This is because the high pricing strategy set by the Leader results in user incurring losses regardless of the amount of power purchased. However, from Figure 10, such problem does not happen to user . Therefore, user tends to opt for purchasing the minimum power to reduce losses so that the overall profit of the Follower can be maximized. Consequently, the optimal decision for the Follower is actually achieved by sacrificing the profits of user.
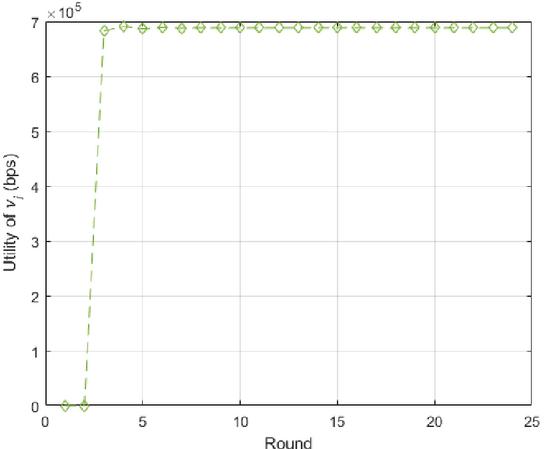
Figure 10 The relationship between the utility of and the rounds for Case 2.
5.2 The Design of The Discounted Pricing Strategy
Under the uniform pricing strategy, user incurs losses no matter how much power it purchases. In order to solve this problem and to ensure fairer profitability among users, this strategy needs to be modified. The pricing decision-making process is retained, but the distance difference between users and is converted to benefit the weaker party in terms of providing discounted pricing. As the distance between two users increases, e.g., user is close to the base station while user is at the cell edge, the weaker party, i.e., user , receives higher discounts. However, if the users and are close to each other, the discount for the weaker party decrease. Under the discounted pricing strategy, the pricing for user is with an upper limit of and an initial value of . Since power cannot be sold for free, and considering the maximum distance between users, the maximum discount is capped at 99% off. The calculation of the price offered to the weaker party in the discounted pricing strategy is defined as
| (11) |
where represents the distance between user and the base station, and represents the distance between user and the base station, both in meter. This discounted pricing strategy ensures that power is not given out for free while also allowing user who are further away from the base station to enjoy certain discounts.
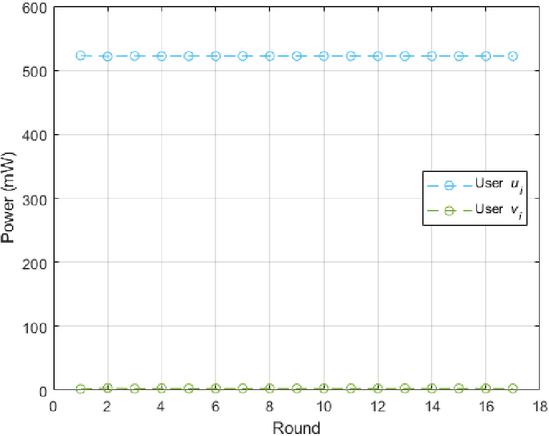
Figure 11 The relationship between the power and the rounds for Case 2.
5.3 Simulation Results for Downlink Power Allocation with Discounted Pricing Strategy
Figure 11 depicts the relationship between the allocated power and rounds for Case 2 under discounted pricing strategy. Contrasting with Figure 7, it is evident that by offering discounts to weaker user based on the distance, there is a noticeable increase in the amount of power purchased by user . Comparing the utilities for Case 2 under uniform pricing in Figure 9 and the discounted pricing in Figure 12, it can be observed that providing discount to user has alleviated the burden of high costs, preventing user from incurring losses and instead turning their situation from loss to profit, resulting in a significant improvement.
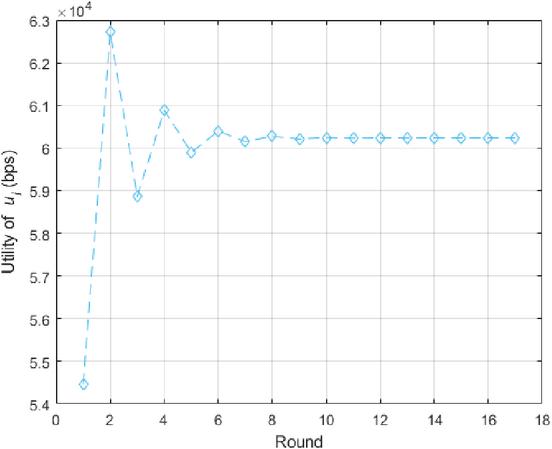
Figure 12 The relationship between the utility of and the rounds for Case 2 under discounted pricing.
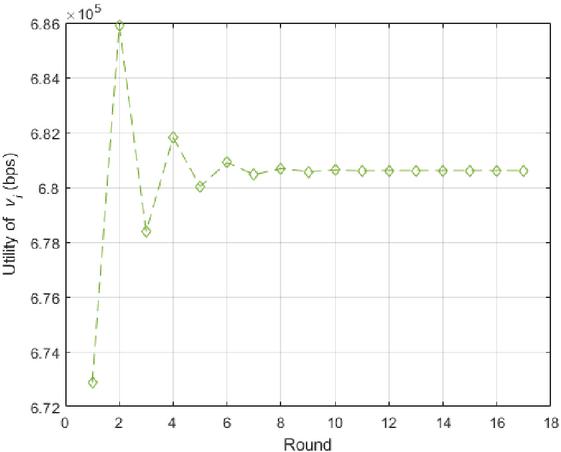
Figure 13 The relationship between the utility of and the rounds for Case 2 under discounted pricing.
However, as the utility of user increases, it is inevitable that the utility of user will be affected as shown in Figures 10 and 13. However, comparing the overall utility of the Follower under uniform pricing in Figure 8 with the overall utility of the Follower under the discounted pricing as shown in Figure 14, there is an increase in the overall utility of the Follower despites the increase in the profit of user and the decrease in the profit of user . This implies that the implementation of the discounted pricing, which considers the differences between users and provides different pricing strategies, not only addresses the fairness issue among users compared to the uniform pricing but also further enhances the profit of Follower.
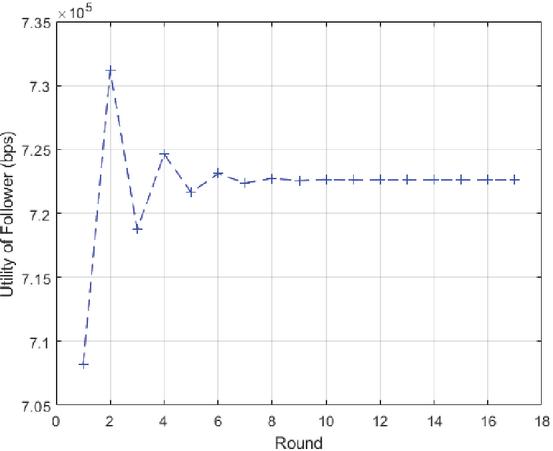
Figure 14 The relationship between the utility and the rounds for Case 2 under discounted pricing.
Based on the comprehensive simulation results, the data is organized into Table 4. For simplicity, the ISIC-U and ISIC-D are used to represent the imperfect SIC with the uniform pricing strategy and the imperfect SIC with discounted pricing strategy, respectively. Implementing the discounted pricing strategy effectively increases the power purchase volume of user , eliminates losses of user , and also leads to profit growth for followers. Compared to the uniform pricing strategy, the discounted pricing strategy enhances fairness in profit distribution between users and .
Table 4 Comparisons between uniform and discounted pricing strategies
| Distances of user & 1 (m) | ||
| Case 2 | ISIC-U | ISIC-D |
| Power of (mW) | 263.5 | 522 |
| Power of (mW) | 6.2 | 2.7 |
| Utility of (bps) | 382624 | 60231 |
| Utility of (bps) | 687944 | 680606 |
| Total Utility (bps) | 305320 | 740837 |
6 Comparisons between Different SICs and Pricing Strategies
Different from previous studies where power allocation in PD-NOMA scenarios typically assumed perfect SIC (PSIC) [8], this paper first proposes using uniform pricing strategy for downlink power allocation under imperfect SIC (i.e., ISIC-U). Then, this paper identifies the unfairness inherent in the uniform pricing strategy and proposes a discounted pricing strategy (i.e., ISIC-D) for downlink power allocation to address this issue. The power allocated by the ISIC-U, ISIC-D, and PSIC [8] to maximize (7) and (3.3) are summarized in Table 5.
Table 5 Comparisons of the allocated power
| Distances of user | |||
| & 227 (m) | |||
| Case 1 | ISIC-U | ISIC-D | PSIC |
| Power of (mW) | 263.5 | 263.5 | 263.5 |
| Power of (mW) | 28.9 | 28.9 | 261.5 |
| Distances of user | |||
| & 1 (m) | |||
| Case 2 | ISIC-U | ISIC-D | PSIC |
| Power of (mW) | 263.5 | 522 | 263.5 |
| Power of (mW) | 6.2 | 2.7 | 261.5 |
| Distances of user | |||
| & 114 (m) | |||
| Case 3 | ISIC-U | ISIC-D | PSIC |
| Power of (mW) | 263.5 | 263.5 | 263.5 |
| Power of (mW) | 6.4 | 3.8 | 261.5 |
| Distances of user | |||
| & 1 (m) | |||
| Case 4 | ISIC-U | ISIC-D | PSIC |
| Power of (mW) | 263.5 | 263.5 | 263.5 |
| Power of (mW) | 1 | 1 | 261.5 |
As we can see from Table 5, because the interference can be completely removed under the perfect SIC for the four cases, in order to reach the maximum total achievable rate, user is allocated with 261.5 mW, which is slightly smaller than the maximum power that can be allocated to it as defined in (10). Similarly, to maximize the achievable rate, the rest of 263.5 mW is allocated to user . As stated in (3), when imperfect SIC is considered, the interference from user to user cannot be ignored if there is no significant difference between the power allocated to them. In the ISIC-U, since there is no incentive, user would only purchase the power slightly greater than the minimum power needed to be allocated to it (i.e., 263.5 mW in Table 5). In the ISIC-D, only when the separation distance between users and is significantly long, e.g., the Case 2, the big discount calculated by (11) encourages user to purchase much power. Hence, as shown in Table 5, 522 mW is allocated to user .
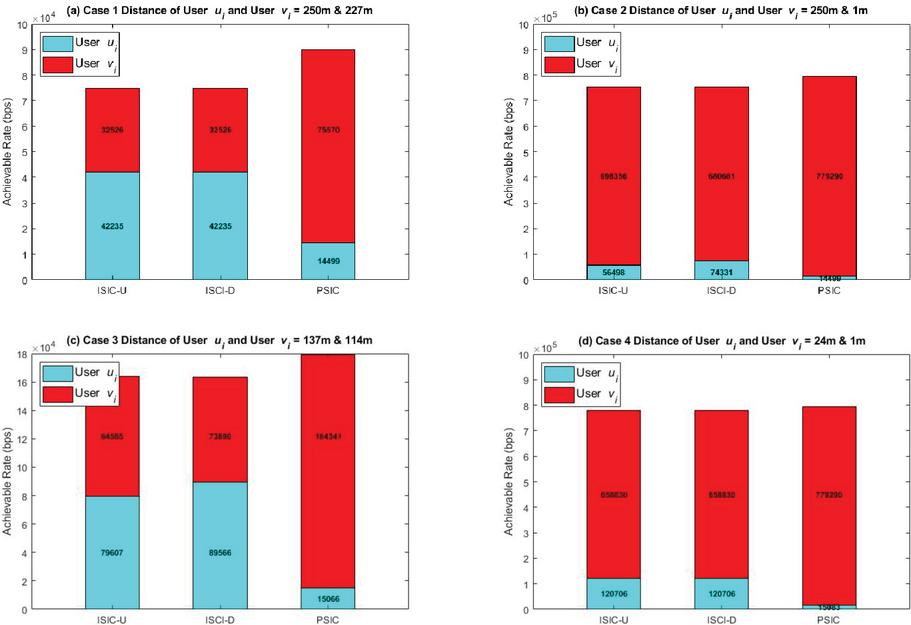
Figure 15 Achievable rates corresponding to the power allocated to users in (a) Case 1; (b) Case 2; (c) Case 3; (d) Case 4.
| ISIC-U | ISIC-D | PSIC | |
| Case 1 | 0.77 | 0.77 | 0.19 |
| Case 2 | 0.08 | 0.11 | 0.02 |
| Case 3 | 0.94 | 0.82 | 0.09 |
| Case 4 | 0.18 | 0.18 | 0.02 |
Table 7 Percentages of the reduction of the total achievable rate
| ISIC-U | ISIC-D | |
| Case 1 | 16.88% | 16.88% |
| Case 2 | 4.90% | 4.88% |
| Case 3 | 8.48% | 8.89% |
| Case 4 | 1.87% | 1.87% |
Based on the allocated power in Table 5, the obtained achievable rates under ISIC-U, ISIC-D, and PSIC are shown in Figure 15 with respect to the four cases. In the PSIC, since users and are allocated with the near minimum and near maximum power that can be allocated to them, the achievable rate of user is greatly higher than that of user . Let and be the maximum and minimum achievable rates among the obtained achievable rates of users and . The fairness is defined as the ratio of to . The higher the value of the fairness , the fairer of the achievable rates between users and . The values of fairness for the obtained achievable rates under ISIC-U, ISIC-D, and PSIC correspond to the four cases are listed in Table 6. Obviously, the proposed ISIC-U and ISIC-D greatly improve the fairness of the achievable rates between users and under the four cases. The cost for the fairness improvement is the reduction of the total achievable rates. The percentages of the reduction of the total achievable rates are listed in Table 7. Evidently, the cost is quite limited. Consequently, the proposed I-SIC-U and ISIC-D not only perform power saving but also the fairness among the achievable rates between users and .
7 Conclusions
Power allocation is a major challenge for the PD-NOMA in 5G communication systems. This paper employs Stackelberg game to allocate the power in the scenarios with imperfect SIC, which would fail if users using the same channel are allocated with similar power. The first proposed approach employs uniform pricing strategy. The second approach employs discounted pricing strategy. The proposed ISIC-U and ISIC-D can obtain much better fairness in term of achievable rates among users and save much power. Furthermore, the total achievable rate obtained by the proposed ISIC-U and ISIC-D is close to that obtained by the PSIC.
References
[1] A. A. Khansa, Y. Yin, G. Gui, and H. Sari, “Power-Domain NOMA or NOMA-2000?” 2019 25th Asia-Pacific Conference on Communications (APCC), Ho Chi Minh City, Vietnam, 2019. doi: 10.1109/APCC47188.2019.9026468.
[2] S. Tomida and K. Higuchi, “Non-Orthogonal Access with SIC in Cellular Downlink for User Fairness Enhancement,” in Proc. Int. Symp. Intell. Signal Process. Commun. Syst. (ISPACS), Chiang Mai, Thailand, 2011. DOI: 10.1109/ISPACS.2011.6146188.
[3] Y. Saito, Y. Kishiyama, A. Benjebbour, T. Nakamura, A. Li, and K. Higuchi, “Non-Orthogonal Multiple Access (NOMA) for Cellular Future Radio Access,” in Proc. IEEE Veh. Technol. Conf., Dresden, Germany, 2013. DOI: 10.1109/VTCSpring.2013.6692652.
[4] M. R. Usman, A. Khan, M. A. Usman, Y. S. Jang, and S. Y. Shin, “On The Performance of Perfect and Imperfect SIC in Downlink Non Orthogonal Multiple Access (NOMA),” In 2016 international Conference on Smart Green Technology in Electrical and Information Systems (ICSGTEIS), Denpasar, Indonesia, 2016. DOI: 10.1109/ICSGTEIS.2016.7885774.
[5] H. Wang, Z. Zhang, and X. Chen, “Energy-Efficient Power Allocation for Non-Orthogonal Multiple Access with Imperfect Successive Interference Cancellation,” In 2017 9th International Conference on Wireless Communications and Signal Processing (WCSP), Nanjinh, China, 2017. DOI: 10.1109/WCSP.2017.8171091.
[6] S. M-B. Fakhrildin, A. G. Wadday, and A. H. Al_Nakkash, “A Comparative Study of Perfect and Imperfect SIC in Downlink PD-NOMA based on Sharing Bandwidth,” In The Fifth Scientific Conference for Engineering and Postgraduate Research (PEC 2020), vol. 1105, no. 1. DOI: 10.1088/1757-899X/1105/1/012029.
[7] I. A. Mahady, E. Bedeer, and S. Ikki. “Non-Orthogonal Multiple Access: The Case of Improper Gaussian Signaling and Imperfect Successive Interference Cancellation,” Frontiers in Communications and Networks, 2022. DOI: 10.3389/frcmn.2022.821037.
[8] C. Li, Q. Zhang, Q. Li, and J. Qin, “Price-Based Power Allocation for Non-Orthogonal Multiple Access Systems,” in IEEE Wireless Communications Letters, vol. 5, no. 6, pp. 664–667, Dec. 2016, DOI: 10.1109/LWC.2016.2613972.
[9] N. Zhao, X. Wang, and X. Zhang, “Multi-Level Price-Based Power Allocation with User Number Limit for Non-Orthogonal Multiple Access,” 2019 IEEE Wireless Communications and Networking Conference (WCNC), Marrakesh, Morocco, 2019, pp. 1–5, DOI: 10.1109/WCNC.2019.8885853.
[10] Z. Han, D. Niyato, and W. Saad, Game Theory in Wireless and Communication Networks: Theory, Models, and Applications. Cambridge, U.K.: Cambridge Univ. Press, 2011.
[11] L. Dai, B. Wang, Y. Yuan, S. Han, Chih-Lin I, and Z. Wang, “Non-Orthogonal Multiple Access for 5G: Solutions, Challenges, Opportunities, and Future Research Trends,” in IEEE Communications Magazine, vol. 53, no. 9, pp. 74–81, September 2015, DOI: 10.1109/MCOM.2015.7263349.
[12] B. Di, L. Song, Y. Li, and G. Y. Li, “Orthogonal Multiple Access for High-Reliable and Low-Latency V2X Communications in 5G Systems,” in IEEE Journal on Selected Areas in Communications, vol. 35, no. 10, pp. 2383–2397, Oct. 2017, DOI: 10.1109/JSAC.2017.2726018.
[13] International Telecommun. Union (ITU), Guidelines for Evaluation of Radio Interface Technologies for IMT-Advanced, Geneva, Switzerland, Tech. Rep. ITU-R M.2135-1, 2009.
[14] M. Glavic and L. Wehenkei, Interior Point Methods: A Survey, Short Survey of Applications to Power Systems, and Research Opportunities, Tech. Rep., University of Liège, 2004.
[15] C.-C. Tseng, H.-C. Wang, K.-C. Ting, S.-H. Lo, and F.-C. Kuo, “Co-Tier Uplink Power Control in Small Cell Networks by Stackelberg Game with Two-Way Pricing Mechanism,” Mobile Networks and Applications, vol. 26, no. 6, pp. 1093–1106, June 2021. DOI: 10.1007/s11036-020-01619-y.
[16] C.-C. Tseng and C.-S. Peng, “Co-tier Uplink Interference Management by Stackelberg Game with Pricing in Co-Channel Femtocell Networks,” Wireless Personal Communications, vol. 100, no. 1, pp. 7–23, May 2018. DOI: 10.1007/s11277-018-5613-9.
[17] 3GPP, TS 38.104, Base Station (BS) radio transmission and reception, V18.5.0 Release 18, March 2024.
Biographies

Chih-Cheng Tseng received his B.S. and M.S. degrees from the National Taiwan University of Science and Technology, Taipei, Taiwan, Republic of China, in 1994 and 1997 respectively, all in Electronic Engineering. He received his Ph. D. from the Graduate Institute of Communications Engineering, National Taiwan University, Taipei, Taiwan, Republic of China, in 2007. He is currently a full professor with the Department of Computer Science and Engineering, National Taiwan Ocean University, Keelung, Taiwan, Republic of China. He was a visiting researcher at the Center for TeleInFrastruktur (CTIF), Aalborg University, Denmark in 2007 summer. He has been actively involved in professional activities, serving as a Sponsorship Co-Chair of IEEE Globecom 2020, TPC Co-Chair of Qshine 2015, co-organizer of NGWiFi workshop in IEEE WCNC 2014, HetCarrierCom workshop in IEEE Globecom 2015, 5G CAT workshop in Qshine 2016, and New Radio Technologies workshop in IEEE PIMRC 2017, general secretariat of WPMC 2012, special session organizer of the GWS 2013 and GWS 2014, and reviewer for SCI journals and international conferences. He is currently serving as the editor of the international journals IET Electronic Letters (SCI) and Journal of Mobile Multimedia. He also served as the guest editor of SCI journals such as International Journal of Sensor Networks, Wireless Personal Communications, and Wireless Communications and Mobile Computing. His research interests include the design and performance evaluation of the next generation mobile communication technologies.

Yao-Jen Liang received the Ph.D. degree in Communication Engineering from National Taiwan University, Taiwan, in 2010. He has more than six years experience in industry. From 2010 to 2011, he was a postdoctoral fellow at Institute of Information Science, Academia Sinica, Taiwan. From February 2011 to February 2012, he was a visiting scholar at the School of Electrical and Computer Engineering, Georgia Institute of Technology. He is currently an associate professor with the Department of Electronic Engineering, National Ilan University. His current research interests include MIMO and OFDM systems, statistical signal processing, and molecular communications.

Hwang-Cheng Wang received an M.S. degree in Computer Science and a Ph.D. degree in Electrical Engineering, both from the University of Southern California, Los Angeles, California, USA. He is a professor in the Department of Electronic Engineering, National Ilan University (NIU), Taiwan. He is the director of the Embedded Systems and Mobile Computing Laboratory at NIU. Prior to joining NIU, he was with the Data Communication Institute, Ministry of Transportation and Communications. He has been a visiting scholar at the Next Generation Internet Research Center, Beijing Jiaotong University, Information Science Institute, Academia Sinica, and LNM Institute of Information Technology, India. His research interests and expertise are in mobile communications, embedded systems, internet of things, machine and deep learning, and UAV. He has authored or co-authored journal and conference papers in these areas. He has also served as a technical committee member of international conferences and a reviewer for reputed journals and conferences.

Chi-Han Chen received the M.S. and B.S. degrees in Department of Electrical Engineering from National Ilan University in 2023 and 2019, respectively. His research expertise is in the mobile communications.

Fang-Chang Kuo received the B.S. degree in E. E. from Tatung University in 1986, and Ph.D. degree in E. E. from National Central University, Taiwan, in 1997. He is currently a professor with the Electronic Engineering department, National Ilan University, Taiwan. Since 2014, he was a visiting scholar with the Department of Computer Science, University of Freiburg, Germany for one year. His research interests are in the areas of AIoT, communication networks and wireless communications.
Journal of Mobile Multimedia, Vol. 20_6, 1153–1180.
doi: 10.13052/jmm1550-4646.2061
© 2025 River Publishers