Outlier Detection Methods and the Challenges for their Implementation with Streaming Data
Ankita Karale
Department of Computer Engineering, Sandip Institute of Technology and Research Centre, Nashik, Maharastra, India
E-mail: ankita.karale9@gmail.com
Received 25 April 2020; Accepted 19 August 2020; Publication 25 November 2020
Abstract
Outlier detection has been a generally examined issue and highly used in a varied range of spaces. For example, transaction fraud, certain rise and fall in share market, sudden changes in weather, interruption detection for digital security, and fraud detection in security design patterns in data. Data mining is the rule of dealing with big amounts of data and choosing the important. Outlier detection is data mining procedures that identify uncommon occasions and special cases. This paper discusses fundamental concepts of outlier detection, the outlier types and the challenges in their detection. An in-depth presentation of outlier detection techniques is given which are divided into three major categories: supervised, semi supervised, and unsupervised. Special attention is given to unsupervised outlier detection. The existing algorithms and techniques in this category are elaborated in detail and the advantages and shortcomings of these techniques are summarized. The analyses of the existing algorithms for outlier detection show that no one of them completely satisfies all the requirements for scalability, work on high dimensional datasets with satisfactory time complexity and efficient memory usage especially when applied on streaming data. This is why the study suggests that there is a need of a hybrid approach that combines classical algorithms and artificial intelligence algorithm to provide efficient solution for outlier detection of streaming data with good key performance indicators.
Keywords: Outlier detection, data mining, streaming data, artificial intelligence.
1 Introduction
1.1 Outlier Detection
Outlier detection has been an imperative idea in the field of data investigation. Until now few application areas understood the immediate mapping between outliers in data and anomalies in real word that are of incredible enthusiasm to an investigator. Outlier detection focuses on the issue of discovering designs in data that outperforms to expected ordinary behavior.
In numerous data handling tasks, big amounts of data is being gathered and prepared for processing. One prime advance in getting a reasonable investigation is the detection of odd patterns. Outlier detection focuses on the issue of discovering designs in data that don’t fit in with expected typical behavior.
Outlier detection includes the task of distinguishing data patterns that don’t show the same behavior with the rest of the objects in the dataset. These abnormal patterns are called as outliers, exceptions, anomalies, defects, discordant observations, faults, aberrations, damage, noise, errors, surprise, novelty, peculiarities or contaminants in different application areas.
Outlier detection techniques have been proposed for various applications, for example, detection of credit card transaction frauds, clinical preliminaries, analysis of voting irregularities, data preprocessing, network interruption, extreme climate prediction, geographic information systems, competitor execution examination, stock market movement and other data-mining assignments. Distinguishing outliers are of the most extreme significance as they may prompt model misspecification, data and so on. Thusly, outlier detection is a very dynamic research field of study with numerous new strategies proposed recently, in light of various hidden approaches like statistical reasoning [1], distance [2–6], or densities [7, 8].
The importance of outlier detection can be analyzed by the fact that outlier in data can be improved to helpful data in a broad cluster of the application domain. For example, a network variation from the regular pattern of network traffic implies that the system could be hacked and is delivering out sensitive information. In general healthcare data, outlier detection strategies are broadly used to find out an odd examples inside the patient health records which may speak to indications of another disorder. Overall prosperity data, outlier detection frameworks are comprehensively used to sort out strange examples from the patient medical report which may address appearance of another disorder [9, 10].
In the same way, abnormal observations in the transaction history of a credit card could show illegal use or theft of the card. Outliers can be proved useful in crucial entities like military examination, where the existence of an unusual region in a satellite picture of enemy territory could show the movement of the enemy. An irregular perusing from a spacecraft would be able to identify the fault in aircraft.
The observation that doesn’t show similarity with other observations is called outlier as it generates doubt that it was created by some special intension. However, outlier detection techniques can also be used to discover significant information in the data.
The varied meaning of outliers demonstrates that it is independent of the application, regardless of if it is a traffic network, card data, sensor data in some scientific investigation, or human digestion. To manage the issue of handling voluminous data proficient anomaly detection strategy should be utilized.
In Figure 1, a point named O1 and point named O2 deviates exclusively from areas named G1 and G2. Outlier detection has been considered broadly in the data mining research network. Nonetheless, as the generation of a tremendous amount of data, outlier detection faces a series of challenges.

Figure 1 Example of two-dimensional outliers.
2 Outlier Types
There are three fundamental kinds of outliers can be defined: point outliers, contextual outliers, and collective outliers.
2.1 Point Outlier
If a single instance of data is outperforming when compared with the remainder of data, at that point the occurrence is called as a point outlier. This is the simplest kind of outlier. Point outliers are likewise considered as global outliers. A point outlier is different from the remaining data points focuses on speaking to its outlierness. They are recognized by analyzing these outlierness metrics. This outlierness metric demonstrates the degree to which single data gets fluctuated from remaining data in the data set. Consider a genuine example dataset of card fraud detection. The dataset contains the details of the transaction of an individual utilizing a credit card. On the off chance that one of the qualities of the dataset is the sum spent by the person for a specific period, an inconsistency can be distinguished as a transaction that is exceptionally high when compared with the ordinary scope of the person’s expenses. An example of point outlier is given in Figure 2
Figure 2 Point outliers.
2.2 Contextual Outliers
Data instance is named as a contextual outlier if it is exceptional in a particular context or behavior. Normally, a contextual outlier highlights to a small collection of instances that shows similar qualities to some attributes with a fundamentally bigger reference group of objects. This kind of outliers fluctuates strongly from the reference bunch on some other attributes. Every data occurrence is characterized by utilizing two sets of attributes. The first attribute is context and other attribute is behavior. The decision of applying a this detection method is decided by the importance of the relevant anomalies in the objective application space. The utilization of a contextual outlier detection system would be meaningful if the traits are accessible promptly.
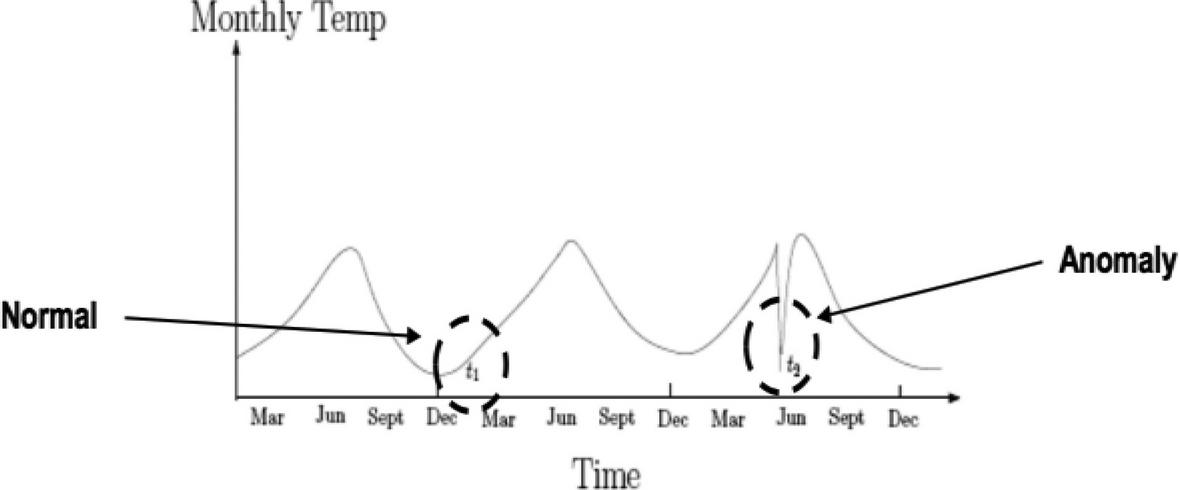
Figure 3 Contextual anomaly.
An example of contextual outlier is specified in above Figure 3. Here temperature at time t and time t is equal but observed in a different context. Hence is not considered as an anomaly.
2.3 Collective Outliers.
Any gathering of data objects related to one another and irregular in relation to the whole data set is named as a collective outlier. The property to be noted, every instance of data may not be an outlier when considered independently from anyone else. Rather, when they appeared in collective manner, in group of instances in that case together they said to be anomalous. Collective outliers have been investigated from different sorts of data like sequence data, graph data, and spatial data. Collective outliers have a limitation that it can be identified just in the data sets where the data instances are identified with one another.
Figure 4 Collective anomaly.
As shown in Figure 4, a group of correlated data objects is termed as a collective anomaly if it is unusual concerning the rest of the data.
3 Challenges of Outlier Detection
Reasonably, outliers are points that show exceptional fluctuations from anticipated ordinary behavior. All typical observations are pictured as ordinary objects and the remaining are treated as outliers. Even though this methodology looks basic, it is surely a profoundly challenging task because of the listed reasons. It is exceptionally hard to characterize ordinary behavior or a normal region. The challenges in outlier detection are as follows:
• The meaning of an outlier is profoundly subject to the area and the application of it.
• Here challenging task is to specify each conceivable ordinary conduct in a dataset for a specific application. The reason is that the boundary between ordinary and irregular items is normally a hazy area.
• The decision of separation measure among items and demonstrating the relationship among them is decided by kind of its use in specific area. For example, in a health care dataset, a little deviation can be named as an outlier while in marketing-related studies, bigger changes are distinguished as outliers.
• At the point when outliers result from malicious activity, it is challenging to adopt such a malicious adversary to mention the outlier analysis.
• The idea of outliers differs for various application spaces. This makes difficult to directly apply the strategy created in one area to another area. E.g. in medical field, a little distinction in typical body temperature may be treated as an outlier, while comparative contrast in the share marketplace may be taken as normal.
• Accessibility of labeled data for the phases of training and approval of the models completed by outlier detection methods might be problematic.
• Noise in the data will, in general, be like genuine outliers and consequently is hard to recognize from malicious outliers. The existence of noise in the data set twists ordinary instances and makes complicated to distinguish between ordinary data items and outlier objects. Noise hides outlier objects, in this manner dropping the feasibility of the outlier detection calculation.
Above listed difficulties makes the outlier detection task more challenging, in its most broad structure, is hard to grasp
4 Outlier Detection Data Mining
Data developments growth is rapid. Increase in the number of databases, their estimation and multidimensional nature there is need for automated analysis of a huge amount of heterogeneous composed data. Hence, data mining systems are used. The fundamental point of the data mining frameworks is to recognize hidden interdependent abilities in databases. The investigation outcomes are then utilized for settling on a judgement, with the true objective that the decision made depends upon the knowledge of the data mining. Outlier detection strategy examines objects in the databank that don’t follow rules considerable for the majority of the database. The outlier detection issue is like the classification problem. The recognizable proof of a thing as an outlier is impacted by various components, whose a vast segment is of huge interest for real time use. For instance, an exceptional stream of bundles of system, revealed by analyzing the framework log, might be categorized as an outlier, since it might be a virus attack or attempt of intrusion. For example, a data mining structure can separate changes in the business area sooner than a human master.
5 Outlier Detection Methods
Outlier detection techniques might be ordered into three major categories: supervised, unsupervised strategies and semi-supervised strategies. A survey of the considerable number of techniques and algorithms is given below.
5.1 Supervised Methods
Supervised methods for outlier detection have requirement of a sample database which has marked examples for both typical and outlier objects. The average methodology in this type of case is to build relevant prototypes for ordinary and outlier objects. Any concealed occurrence of data is compared with both the models to figure out which category it has a place with. Due to express idea abb out behavior of the typical and outlier objects exact models may be formed in this procedure. One disadvantage this method faces is precisely marked sample data may be restrictively costly to acquire. The quantity of outliers is almost negligible when matched with the quantity of normal examples in the training data. Naming procedure can be done physically by a person and thus requires a great deal of exertion to acquire the marked sample data set. Acquiring exact and relevant instances particularly for the outlier class is usually challenging tasks.
5.2 Semi-Supervised Methods
On account of semi-supervised category for outlier detection, the data instances in the training dataset are compared with the examples in the usual class. Items that are distinguished as abnormal do not require any marks, and subsequently, are broadly appropriate when contrasted with the usual models. The typical approach in the semi-supervised category for outlier detection utilized in such procedures is assembling a model related to the class objects. Subsequently this model can be applied in recognition of outliers in the test data. This strategy for intrusion detection requires the accessibility of only the outlier instances for the training data set. Such procedures are not generally utilized as it’s hard to get a training data set which includes all conceivable odd instances that may present in the dataset.
5.3 Unsupervised Methods
Unsupervised strategies for outlier detection don’t require labeled training data and thus they don’t need any special effort for accessibility of marked training data. Different suppositions about the training data are made in unsupervised approach. A consistent observed data sample is ordinarily viewed as representative while an uncommon event is an outlier. The techniques in this category make a presumption that data objects with typical occurrences are distinctly more regular than outliers in the test data. Unsupervised strategies experience the adverse effects of a high false alert rate, as the hidden hypothesis does not often remain constant. Taking into consideration the assumptions about ordinary data, these methods can be additionally classified into other sub-categories as shown in Figure 5. The sub-categories of unsupervised outlier detection methods are discussed in details as follows.
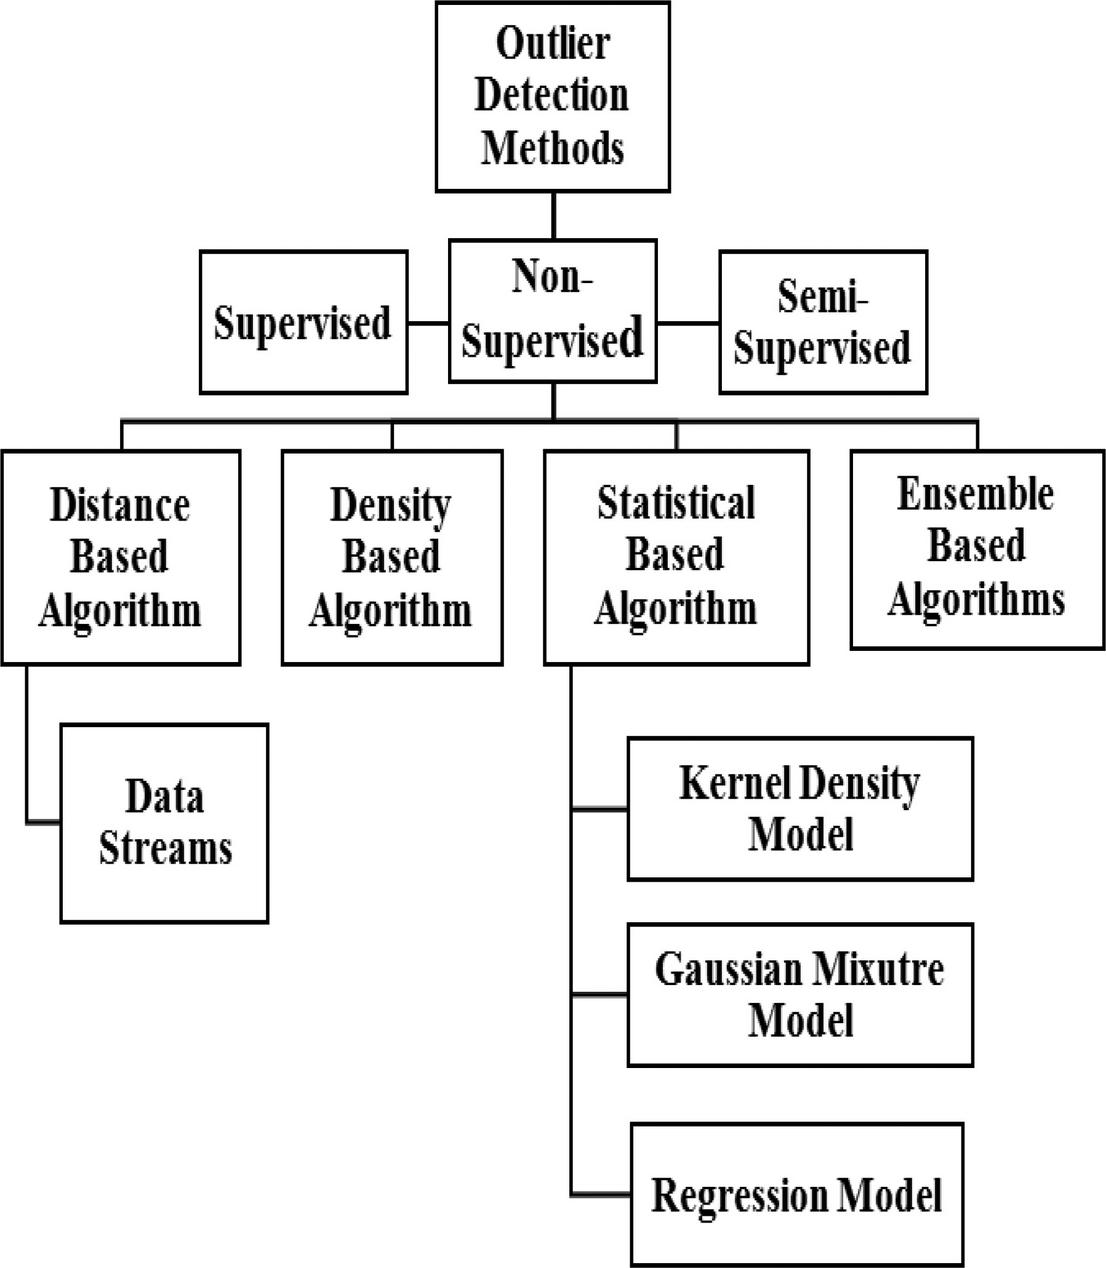
Figure 5 Outlier detection methods.
i. Density-based Algorithms
Density based techniques are popular anomaly identification to deal with anomaly identification problems. Less-dense area have higher chances of presence of anomaly is the key guideline for this technique, though normal data objects rather than anomalies are expected to found in crowded regions. The items resided long way from their nearest neighbors, are marked and constantly treated as exceptions. In density-based outlier discovery strategies, progressively complex methodologies are used to identify the anomalies, when distinguished with distance-based techniques. These algorithms are broadly accepted to recognize outliers due to their effortless performance and efficiency.
Local Outlier Factor (LOF) strategy given by Breunig et al. [12], is one of the principal crucial, approximately relevant density-based clustering anomaly discovery techniques. The system utilizes the k-nearest neighbors (KNN). For every point in the group of KNN, LOF utilizes the local reachability density (LRD) and also contrasts it with those of the neighbors of each member of the KNN group. The primary benefit of this algorithm is that the detection of an outlier is not the only property that can be considered but in addition attention is given by which degree it is fluctuating from adjacent neighborhood. Nevertheless the crucial part of such technologies is the usage of an appropriate index. If such an index is not assigned for the data set whose size is n it will take time in the case of linear search which is the main drawback of the LOF.
To overcome this disadvantage of LOF Schubert et al. [20] proposed new solution that claims density estimation for the LOF can be made simpler. The suggested approach implies that the reachability distance of LOF can be replaced by KNN distance. So the proposed approach is known as Simplified LOF. But this Simplified LOF when compared with LOF in terms of computational complexity shows similar complexity to LOF.
Additional enhancement to LOF [12] and Simplified LOF [20] are suggested by author Tang et al [21]. The improvement is named as Connective based Outlier Factor (COF). Except for the method of density computation of records both the approaches COF and LOF are closely related to each other. In order to compute the shortest path COF takes into account chaining distance while LOF goes for Euclidean distance for choosing nearest neighbors. But this approach is suffering from the shortfall of incorrect density estimation because of the way of making an indirect hypothesis towards the distribution of information. COF tries to adjust the simplified LOF density estimate. Unfortunately this study shows similar time complexity as the LOF exceptional in a few cases.
Though different numbers of techniques were invented, they could not resolve the problem of confusion over which threshold score should be taken into account as an anomaly in LOF. Kriegel et al. [22] proposed more vigorous technique which focused on local density estimation. This outlier identification technique is called Local Outlier Probabilities (LoOP) which works on the concept of providing outlier scores. The suggested approach uses distance distribution based density estimation and probability which is nothing local outlier score. It tries to resolve issue of LOF by putting the outlier score. The advantage of this probability score is that it provides better comparison concerning various datasets. However it gives similar complexity of O(k) when compared with Simplified LOF [20].
The problem of multi-granularity is not addressed by LOF [12], and COF [21]. To handle this shortfall the technique called Local correlation Integral (LOCI) and an outlier metric of multi-granularity deviation factor (MDEF) is suggested by Papadimitriou et al. [30]. They marked an outlier as points which show minimum three standard deviations from MDEF’s neighbor. The new approach is effective in the case of local density variation and it is able to find out clusters and outliers distinctly. Its maximization technique addresses the problem of choosing the best value of k. Despite of showing good performance it suffers from the problem of longer runtime. Papadimitriou et al. [30] suggested another method called aLOCI which is an approximation of LOCI. It uses quad trees to fasten the speed of the two neighborhoods.
Ren et al. [24] suggested a method depending on the pruning ability. It is called Relative Density Factor (RDF) method. When compared with LOF [8] and LOCI [23] the suggested technique shows efficient results. The main advantage of this technique is that it is more robust when it comes to scalability. It performs well with increase in data size.
Jin et al. [25] introduced another technique called INFLuenced Outlierness (INFLO), which is used to find local outliers. The approach is symmetric to LOF and considers relationship of symmetric neighborhoods to find anomalies. LOF degrades its performance in closely related clusters. This shortfall is addressed by INFLO. Nearest Neighbour (NN) and reverse nearest neighbors (RNNs) both are considered to estimate density distribution of close neighborhood so that to achieve better computation performance. Higher value of INFLO indicates highest probability of outlier.
Coming forward Cao et al. [31] suggested a novel density based local outlier detection algorithm (UDLO) which is useful on data that is uncertain and has discrete objects. This algorithm focuses on density of instance and it does not need to find all k neighbors to detect the anomalies.
As discussed above LOF [8] was improved by various versions such as COF [21], INFLO [25] and LOCI [30]. However the challenge of the application of these algorithms for high dimensional datasets is distance computation. Keller et al. [32] suggested a high contrast subspace method (HiCS) that emphasis on the evaluation of outliers and their ranking.
A number of methods for outlier detection are suggested for only local outliers while here are other methods that extend their focus who take in account global outliers also. Campello et al. [33] introduced a new algorithm called Global-Local Outlier Score from Hierarchies (GLOSH) for the intrusion detection measure. The suggested technique considers not only local outliers but also global outliers thus GLOSH is capable of finding both local and global outliers. Though it is not able to perform well in all cases when compared with other techniques, it is still better option when it comes to scalability.
Momtaz et al. [34] go astray a little from the focal core interest of most past calculations in processing the local anomalies. They presented a density based outlier discovery method that recognizes the top-n anomalies by accommodating each element a score known as DWOF. It is nothing but Dynamic-Window Outlier Factor (DWOF) which is an advanced version of the suggested by Fan et al. [35] Resolution-based Outlier Factor (ROF).
With the enormous progression of high-dimensional information, new look into inspirations are connected with improving the viability and productivity of calculations in distinguishing anomalies in huge datasets. Wu et al. [36] proposed a calculation for the location of anomalies in massive information streams. A quick and precise density calculator called RS-Forest and machine learning are proposed. Bai et al. [27] came with a density based anomaly identification in big data and proposed a Dispersed LOF Computing (DLC) technique, which distinguishes anomalies in parallel. The principle thought here is twofold. At first, the pre-processing stage utilizes the Grid-Based Partitioning (GBP) calculation and the DLC for finding outliers. Regardless of the improved performance it doesn’t scale well when contrasted with Lozano et al. [37] Parallel LOF Algorithm (PLOFA). Enhancing the adaptability of the calculation might be an intriguing examination issue for future scope.
Utilizing Local KDE Tang and He [28] suggested an anomaly identification technique. Relative density Based Outlier Score (RDOS) is utilized and it gives more attention on the reverse and common closest neighbors as reverse to the k-nearest neighbor of an item. For this solution only Euclidean distance metric is used when compared to UDLO in [31].
Vázquez et al. [38] introduced Sparse Information Observers (SDO) algorithm for the detection of anomalies in low density regions. It seriously decreased the computational expense, which thus achieves good when contrasted with rest of the best-positioned anomaly detection techniques. Ning et al. [39] suggested a relative method depending on density for outlier detection that uses a new method to calculate neighborhood density of objects. Su et al. [40] suggested a productive plan depending on density for the identification of local outlier. This technique is specially planned by thinking about scattered data items and known as E2DLOS. Method for pre-processing of datasets RCMLQ is also suggested by them. It helps in improving the performance of present techniques of Local outlier identification. It shows better results with performance indicator factors like time and detection precision.
1. Advantages
Table 1 Summary of density-based algorithms
| Paper | Performance Indicator | Findings | Shortcomings |
| LOF (2000) [7] |
1. Good Index O 2. High Dimension: |
1. Solves the issue of detection of outlier in local density. 2. It solves the problem of consideration of anomalies as a binary property. |
1. This algorithm not able to deal with the problem of multigranularity. 2. MinPts selection is sensitive issue here. 3. Expensive in terms of computation |
| COF (2002) [21] |
1. Time complexity same like LOF 2. High Dimension: |
1. LOF is not hat accurate when it comes to decision making of outliers nearby to non-outliers in low density. COF solves this problem of LOF 2. COF detects outliers efficiently |
1. Computationally expensive than LOF |
| LOCI (2003) [23] |
1. Computational Complexity: 2. For Memory: |
1. Solves major problems like selection of parameters, multigranularity, and handling local densities |
1. For computation of standard deviation it requires extra computational cost. |
| RDF (2004) [24] |
1. Gives better performance in comparison with LOF and LOCI when it comes to large data. 2. Highly Scalable |
1. By pruning the data points depending on the RDF it finds the outliers in smaller data subsets |
1. Slower performance in terms of time for small size data base, when compared with [7] |
| INFLO (2006) [25] |
1. Gives good time complexity for smaller size data sets but computationally expensive in terms of time when d |
1. By using the exclusive method to od can detect more significant outliers |
1. Its aimed to find out only local anomalies |
| LoOP (2009) [8] |
1. Stable Performance for larger values. 2. Robust than others when it comes to selection of k |
1. The LoOP values are stable. 2. For every data point it gives probability score of an outlier which is easy for interpretation and comparison too. |
1. LoOP method is not more concerned about efficiency of technique. It is more concerned about precision and recall of the technique. |
| DWOF(2013) [34] |
1. It gives good performance accuracy when compared with LOF |
1. Performance enhanced and drawback’s like reduced accuracy or sensitivity issue for the number of parameters are addressed well here. |
2. Better in detection accuracy but not considered computational cost. |
| GBPDLC (2016) [27] |
1. Good performance in terms of the Processing time. |
1. Can detect outliers in distributed environment which solves issues generated in centralized environment. |
1. Scalability is issue when data size grows. |
| RDOS (2017) [28] |
1. For huge datasets it shows enhanced performance as than PLOFA |
1. Outlierness is measured effectively using various factors in result gives robust outlier detection. |
1. There is scope to use other methods of distance but it uses only single metrics. |
Few of the density based methods such as [12, 25, 29, 30] have filled the gap and proved as a basic benchmark for some resulting calculations. They have tentatively been appeared to function admirably for present day strategies, frequently outperforming their contenders like some current methods [18, 41, 42]. Since exceptions in these strategies are frequently dissected through the item’s neighborhood density [12, 30], this, thus, gives it a more favorable position in recognizing significant anomalies missed by most other exception identification based strategies. They require just least early information like the distribution probability. These techniques are popular for their capacity to detect local outliers effectively.
2. Disadvantages
Though little density based techniques enhanced time complexity, these techniques are not easy and costly when contrasted particularly with statistical strategies in most cases [43]. They require setting of parameters, for example, estimation of the size of the neighbors that might not always be possible in an efficient manner. Due to lack of update in the measures of outlierness and time complexity few algorithms like INFLO and MDEF are not able to handle data stream effectively.
ii. Statistical-based Algorithms
Outlier detection algorithms that utilize statistical techniques can be applied as unsupervised, semi-supervised and supervised approach. In these techniques, the information focuses are rarely displayed utilizing a stochastic dissemination, and a few information focuses can be named as anomalies relying upon the association with the distribution model. Anomalies and non-anomalies are announced relying upon the information dissemination model. Statistical algorithms can be further grouped into two important categories – the parametric and non-parametric strategies. The significant distinction between the two strategies is that the parametric technique uses a presumption of hidden appropriation model and from the known information, it concludes the factors of distribution model. The non-parametric strategy doesn’t use any hypothesis of prior information on the distribution model [44].
a. Gaussian Mixture Model
One of the most predominant statistical-based approaches to distinguish anomalies is the Gaussian Mixture Model. It is a parametric approach. The model uses two main stages. One is training phase which uses MLE i.e. maximum likelihood estimates (MLE) and other is the test stage which goes for some discordancy test.
Yang et al. [46] suggested an unsupervised outlier detection method that mostly focuses on global factors and estimates the outlier factor. If this outlier factor F is smaller in value then the probability of data point to be an outlier is higher. Like existing techniques [12, 21, 23] this method doesn’t focus on local factor, rather it focuses on global properties. Despite all these features this algorithm still faces a problem of high complexity. Nevertheless the algorithm proved to be effective and improvements of its computational complexity can be a good option for future study.
Tang et al. [47] proposed more robust way for outlier detection. Here GMM and subspace learning is combined for the detection of anomaly. Outliers and normal samples have significant distance which is exactly reverse condition as in Saha et al. [48], that was depending on Principal Component Analysis (PCA). It overcomes the issues unaddressed by techniques like LOF [12] and Tang et al. [21].
b. Regression Model
Distinguishing intrusion utilizing regression models is one of the simplest ways to deal with anomaly identification issues. It falls in the parametric statistic-based methods. Depending upon the application the model used may be linear based or non-linear based. As a rule, while using this system initial step is preparation step or training state, involves developing a regression model as per the information. In the second step, that is a testing phase, the model is examined by assessing each data object. Data object with visible deviance came across in observation it is declared as an outlier.
Interestingly, a technique contrast to the existing technique was suggested by Satman [49] to recognize exceptions in linear regression. In short time this algorithm can detect multiple outliers, so it reduces the computational time which makes it cost effective. The limitation of this approach is bias variance based estimation as few times it differentiated by small preferences so work can be done on this shortfall.
A new technique which focuses on identification of anomalies in sensor estimations is suggested by Park et al. [50]. This system utilizes a weighted summation approach. As this method is validated by test results on the only specific environment, it will be interesting study that may achieve exact model estimation for various sensor settings and circumstances.
The recent study by Dalatu et al. [51] has done a comparative examination on the two main methods of linear and nonlinear regression models for anomaly detection. For future researchers this examination gives knowledge into the prescient results for both kinds of approaches. As per this, the researcher can conclude that nonlinear model gives better results up to 93% and linear goes up to 68% accuracy, which gives clear picture to them which option to opt for.
Table 2 summary of Statistical- Based algorithms
| Paper | Performance Indicator | Findings | Shortcomings |
| Yang et al. [46] | For number of iteration’s | When most of the papers focus on any one property to get deal with, This paper works on two major properties, Global properties and local properties | Complexity is higher |
| Tang et al. [47] | It proves the enhanced detection accuracy in the case of true positive | It provide solution to the algorithms which was not able to find outliers in multiple process states. | Computational complexity |
| Regression Models | |||
| Satman [49] | Improved computational time | Able to find out multiple anomalies in short span | Intercept estimator need more attention which could be minimized to improve performance |
| Dalatu et al. [51] | Nonlinear models shows good accuracy whereas linear shows average | Gives performance comparison of linear and nonlinear models | It is not detailed. |
| Kernel Density Models | |||
| Latecki et al. [53] | Improved performance of detection than LOF[7] | Find out local outlier depending on density. | Not suitable for large dimensional database |
| Gao et al. [54] | Enhanced performance and Good scalability. | Handle the problem of imprecise outlier detection in high volume database. | Method is too complex |
| Boedihardjo et al. [56] | Cost of computation | Applies this method in streaming database environment | High computation required |
| Other Statistical Methods | |||
| Hido et al. [42] | Good accuracy when compared with LOF | This statistical method provide solution for outlier detection in inlier – based manner | Density ratio accuracy |
| Du et al. [63] | Good running time and Detection Rate. It is also provenit experimentally | Works on finding of local as well as global outliers | Method Efficiency is shortfall here |
c. Kernel-based Methods
Kernel-based Methods (KDE) are non-parametric techniques for density estimation and is a typical methodology for detecting intrusion [52]. Latecki et al [53] give an unsupervised approach to outlier recognition. For the anomaly recognition each data object is evaluated to compare local density with neighbor’s density. This method gives better results when compared with some previous popular techniques like [12, 30]. But it doesn’t show better results in the case of large and multidimensional datasets. Afterward, Gao et al. [54] suggested a superior way to address the portion of the past deficiencies. The strategy shows improved execution and scalability for large datasets with good time complexity when contrasted with LOF and Latecki et al. [53]. For the information distribution in sensors, Kumar and Verma [55] use KDE approach for intrusion detection.
It’s challenging to apply KDE strategies for streaming data. In spite of the difficulties in applying the KDE strategies, Boedihardjo et al. [56] use this approach on streaming data. Uddin et al. [57] adopt this technique in different areas of application such as power grid.
The researchers in [56] suggested an approximation technique for increasing accuracy and robustness of system. Even though that the system creates a superior estimation quality than the first KDE, it is still with high computational expense. However, it shows a superior execution in many zones when contrasted with the first KDE. Further examinations for multivariate dimensions should be possible.
Zheng et al. [14] is one more investigation that utilized KDE in multi-media network for identifying anomalies. Smrithy et al. [58] suggested an online algorithm for distinguishing exceptions from big data. The advantage of the algorithm is that it is not based on parametric conditions.
For recognizing outliers in non-linear systems, Zhang et al. [59] uses Gaussian kernel. Qin et al. [60] suggested algorithm to recognize local outliers from data streams adequately. It gives efficient solution to the shortfalls of existing techniques which fails to address high velocity data streams.
The generalized conclusion about KDE methods shows that they face issues like problem of dimensionality and high computational cost.
d. Other Statistical Methods.
Though various statistical methodologies have been suggested to recognize outliers, but still methods like histogram [61] and Boxplot, Trimmed mean like statistical tests [19] can classify as the more simple approach for outlier identification.
Barnett et al. [18] examine a number of tests for the optimization of various distribution models to successfully distinguish intrusion. Here optimization is dependent on factors like number of outliers and space they are expecting. Rousseeuw and Hubert [62] additionally gave a more extensive study of these techniques for anomaly discovery. Gold-stein and Dengel [61] offered a Histogram-Based Outlier (HBOS) discovery method using histogram. They used histograms to figure out the anomaly score for every data objects. It gives improved performance with few existing popular algorithms like LOF [12], COF [21], and INFLO [25] in terms of parameters like computational speed. But still, it doesn’t reach expectations to find local outliers.
Hido et al. [42] offered another methodology of outlier recognition issues for inlier-based anomaly. The proposed method finds to be more featured when contrasted with the non-parametric KDE, as it can relief complex density estimation calculation. For most of cases they have indicated a superior execution and improved results in accuracy.
Du et al. [63] introduced another technique for anomaly discovery named the Robust Local Outlier Detection (RLOD). This investigation considers that most of techniques works on finding global outliers and number of techniques [64, 65] are delicate to parameter changes. The technique works on both global and local outlier detection like in Campello et al. [33], and it has been evidenced by experimental results that it performs better when compared with other methods [12, 16] in speed and discovery rate.
1. Advantages
• They are scientifically adequate and have a quick assessment procedure if the models are constructed.
• These models are commonly suitable for data sets having real values. So in result they show improved handling time for complex information.
• They are simpler to execute despite the fact that they are constrained to specific issues which are discussed in disadvantages.
2. Disadvantages
The nature of the outcomes created is mostly not reliable for real word situations and applications.
• It is not useful in multiple-dimensional situation. As it causes large costs of computation if managing multivariate information, thus they are poor choice for real word problems.
• Statistical techniques undergo different methods when they are dealing with problem of dimensionality which results in degraded performance and increase processing time.
iii. Distance-Based Approaches
Distance dependent strategies identify anomalies by finding distances between data objects. A data object is called as an exception when it is not closer from its closest neighbor. The most usually utilized distance based outlier discovery method is dependent on the idea of the local surrounding region and k-closest neighbor (KNN) [66]. These methods are best when it comes to large data sets as they scale well. If compared with statistical techniques they are more robust, good in terms of computational efficiency and flexibility. More generalized distance based techniques are discussed below.
a. K-Nearest Neighbor Methods
These are one of the most popular methods used popularly for finding global outliers. The main idea here is to manipulate neighborhood data to identify the exceptions. Here the environment of an object is inspected with respect to its neighbourhood with other data objects to observe whether they are close to their neighbours or not.
Knorr and Ng [67] proposed a methodology, which is as opposed to some past statistical strategies [46, 49]. The advantage of the method is its nonparametric nature. There is no need to have former knowledge of data distribution. It gives computational complexity of O(kN) where k is dimensionality and N is number of datasets.
Ramaswamy et al. [68] represented a cell-based technique to enhance the past calculation in the paper [67]. They successfully address shortfalls of [67] like computational cost and ranking method by their cell based technique.
In the extended study of [67] to find the closest neighbor of every node structure the various trees are utilized [45]. This is achieved by questioning the file structure for every model for the nearest k and finally in accordance with the exception statement, the topmost n competitor is chosen. One primary drawback of this strategy is that the list structures breakdown with an expansion in the dimensionality.
Angiulli et al. [11] are different from the conventional methodology to identify outliers by getting familiar with a model in an information dataset and predict anomalies in an approaching dataset. They planned an algorithm that distinguishes top exceptions from a given unlabelled dataset and predicts if an undetected information point is an anomaly or not.
Ghoting et al. [69] introduced a technique called the RBRP for upgrading the operating speed of multi-dimensional datasets and enhance the disadvantages of past strategies [67, 68] in terms of speed. The main distinction from the prior calculations is that it allows the quick converging of a point’s overall closest neighbors. Rather than utilizing the closest neighbors here the approximate closest neighbor is utilized, which makes the calculation quicker. This feature makes it stand out when compared with rest of other strategies.
Instead of going for global outlier detection Zhang et al. [26] chose to redirect to local outlier detection. They suggested a technique named as the Local Distance-based Outlier Factor (LDOF). Their investigation shows improved execution over LOF [12]. It is more stable to parameter values when compared with k-nearest neighbor techniques.
Huang et al. [106] introduce a strategy Rank-Based Detection Algorithm which provide rank to the neighbors. It gives an efficient solution. The RBDA utilizes the rank of individual items that are close as proximity degree. Moving ahead Bhattacharya et al. [71] suggested a strategy that utilises the ranking and positions of the closest neighbors and vice versa. This guarantees successful estimation of the outlier score for every instance.
Table 3 Summary of distance-based algorithms
| Algorithm name | Performance | Findings/Problem Solved | Shortfalls |
| ORCA [67] | where Database dimensions and number of objects in database | Solves Problem of absence of support for database with multiple number of attributes | For , complexity is very high |
| Partitioning based or cell – based [68] | For solving quadratic complexity it makes use of tuple by tuple method. Moreover it gives assurance of at max three passes so suitable for < = 4. | Complexity increases with dimensions and volume of dataset. | |
| VDBLP [78] | Where dimensionality | It is efficient in terms of scalability by making use of pruning when compared performance with [68]. | Assessment method should be improved in order to evaluation for the memory size and dimensionality |
| DOLPHIN [77] | Near linear time | It gives good performance in terms of CPU Cost and also reduced I/O cost. | Not applicable for data stream which could go for only single scan |
| MIRO [79] | Linear in time with respect to | It uses pruning methods to minimize execution time. | Not suitable for large database and in high dimensional too |
| Data Streams | |||
| Exact-N [83] | Performance improved when compared with Abstract-C | Minimizes computations by preserving neighborship. It also minimizes the amount of searching range query. | Highest Memory consumption than other techniques as it keeps in memory neigbourship in between all data points |
| Extra-N [83] | Performance enhanced than Abstract-M | It does not maintain all data point’s exact neighborship within the window. It is able to achieve minimized number of range query search. | Necessity of maintaining lifetime of all data points require high amount of memory |
| Abstract-M [83] | Performance enhanced than Exact-N but consumes more CPU time than Exact-N | It addresses shortfall of Abstract-C. | Though it makes improvement it suffers with drawback that it requires extra range query search for every window. |
| Data Streams | |||
| Abstract-C [83] | Computational Cost | It solves time consumption problem. It is able to keep the compressed summary of its neighbourships which is important achievement | This algorithm also suffers from high memory consumption issue like other algorithm in this category. |
| Approximate Storm [80] | where window size Performance enhanced over Exact-Storm | This algorithm able to achieve low memory utilization. | Results are not precise. |
| Exact-Storm [80] | where window size Dimension | Proved efficient over computation cost problem | Required extra CPU time |
| Thresh-Leap [86] | Where S Slide size | Efficient utilization of CPU time Usage | At small slide size it writhes from memory issues |
In another examination Dang et al. [66] applied k-nearest neighbor to identify exceptions in everyday traffic database in some smart urban areas. It gives good results when compared with KDE (95%) and GMM (80.9%). But here they consider a single distance based measurement metric. The performance can be improved by paying attention to this issue and by using multiple distance measure. In another study Wang et al. [72] applied minimum spanning tree method. This paper successfully enhances efficiency of KNN neighbors by using technique of minimum spanning tree.
Radovanovi’c et al. [73] give an approach to handle one of the major issues known as “curse of dimensionality”. From the experimental discussion, it is stated that this methodology could be successfully applied in both minimum and high dimensions. When compared with KNN technique [68] it gives better results in the terms of detection rate.
Huang et al. [74] executed the idea of regular neighbors. By using regular neighbors the information of the neighboring region is obtained in this technique. Ha et al. [75] suggested a heuristic way. The problem of deciding an appropriate value for k is solved using this technique by iterative asymmetrical testing.
b. Pruning Methods
Bay et al. [76] introduced a method dependent on a nested loop. They tried to improve quadratic performance in linear time considered in a previous method [67]. But lots of assumptions degrade its performance. Angiulli et al. [77] proposed a innovative technique called Detecting Outliers Pushing data into an Index (DOLPHIN). It deals with issues like CPU costing and in limiting the I/O costing which most past research [45, 67, 68] were not able to satisfy.
Ren et al. [78] displayed an enhanced variant of Ramaswamy et al. strategy [68]. In their investigation the vertical structure is used which is unusual as other method uses the horizontal structure. This approach encourages the efficient recognition of outliers.
In another study Vu et al. [79] presented the Multi-Rule Outlier (MIRO) strategy which is mostly same to strategy in [78]. It makes use of the pruning method. This technique accelerates the way toward recognizing exceptions.
c. Data Streams
Data streams contain high volume incoming continuous data. The mining of such kind of unlimited streaming data is mainly relying on a time interval and uses windows for computation.
The most popular data stream models for windows are landmark and sliding window [80]. Angiulli et al. [80] suggested a clever method for firing single time query for anomalies in data streams rather than continuous query technique stated by previous methods [81, 82]. Here three different types of algorithms are proposed using distance based technique. One of the algorithms is based on firing exact query for outlier and other two are techniques which extract approximate output of query. Computational cost of saving window objects is the drawback of this method. It is not even appropriate in case of large memory.
Yang et al. [83] suggested few techniques for the sliding window situations over data streams dealing with finding of incremental patterns based on neighbours. Yang et al. [83] address the problem of dealing with sliding windows, which was not addressed in the previous study like DBSCAN [16].The old techniques were costly and highly complex while the proposed shows less CPU utilization.
Kontaki et al. [84] invented technique that can handle a few problems related to intrusion identification in data stream [85] and in sliding window cases [83] in data streams.
This technique [84] improves effectiveness and storage consumption.
Another technique called ThreshLEAP is given by Cao et al. [86]. This technique is specially designed for data stream of high volume. It doesn’t store all data points in same window. So it tries to remove costly range queries.
1. Advantages
• They are simple and understandable. They doesn’t go with assumption.
• Contrasted to statistical techniques they are efficient in terms of computation and scalability.
2. Disadvantages
• Just like statistical and density based techniques they face issues with high dimensionality as their performance suffers from problem of dimensionality
• When it comes to high volume database, the scalability is expensive task.
iv. Clustering-Based Approaches
Clustering based approaches utilize grouping strategies to recognize nature of data. To do this, smaller size of groups that comprises less amount of data objects when compared to rest of the groups are marked as anomalies. Note that the grouping strategies are not the same as the anomaly detection methods. The fundamental point of clustering techniques is to finding out clusters while anomaly detection is to identify anomalies. The exhibition of clustering methods is profoundly dependent on viability of which clustering method is used for identification of clusters [87]. Clustering techniques are unsupervised since they don’t require any earlier information.
The Dual stage algorithm DenStream suggested by Cao et al. [13] and D-Stream suggested by Chen et al. [89] provide solution to both offline and online outlier detection. For this purpose they used density clustering approach. Denstream works in two phases. The very first step is summary and second phase is cluster formation from the summary. Comparing DenStream with CluStream [90], the former showes improved performance in terms of memory, though that this technique has some disadvantages such as a problem in adjusting dynamic parameters.
There is another strategy known as D-Stream [89] which is like DenStream. They are equivalent for online and offline purpose except for the fact that it is clustering algorithm based on density grid. Here outlier detection is made easy when contrasted to previous method Denstream[13] due to new concepts like sparse, dense etc. It shows better performance concerning time and clustering than the technique in CluStream[90].
Further Assent et al. [91] suggested AnyOut to process and recognise exceptions any time on streaming data. This technique uses ClusTree technique to develop tree which is best suited for anytime clustering.
Elahi et al [92] recommended clustering-dependent anomaly detection procedure for the data stream that divide the information stream into pieces to deal with outliers. But in any case, it doesn’t fit well for grouped anomalies. The test results represented that their strategy accomplished a superior execution than some current procedures [85, 93] for finding significant exceptions over the information stream. Furthermore finding different approaches to give the outlierness degree to the identified exceptions is important study to examine.
The authors in [94] proposed an algorithm which uses a concept same as k-means. They gave weight to the component as for their importance which helps to control the impact of noise in the algorithm and bring up the weight of the significant components. When this system is contrasted with LOF [12] with better time utilization it gives a greater outlier recognition rate. Despite the fact that the work shows improved execution over the other standard algorithm (LOF), still it is not compatible with real world database.
In a further study Bhosale [95] proposed algorithm based on outlier recognition that makes use of both density dependent and partitioning dependent methods for streaming data. The strategy is steady and can adjust to the idea of development. It has a higher anomaly identification rate than [92]. The creator suggested future scope of the work for mixed and categorical information for future research.
Moshtaghi et al. [96] suggested a clustering based technique. As per the suggested model the instances which are outside the cluster limits are marked as outliers. The matrix of mean and covariance are consistently added with new data elements. Here variations in distribution are observed in the data stream. with the help of the matrix. Moshtaghi et al. in another study suggested eTSAD [97] a methodology which uses fuzzy rules for detection of outliers in streaming data. The same technique as in [96] is used to update fuzzy parameters here.
Salehi et al. [98] suggested a method to create clustering model using ensemble approach. Here data streams are updated with the help of ensemble approach in the place of modelling it over time. The outlierness estimation of incoming information is determined by using just the relevant group of clustering models.
Chenaghlou et al. [99] recommended an efficient outlier recognition technique, where the new idea of active clusters is used for improved time and memory efficient anomaly detection results. The input information is part into several chunks, and for every current information chunk, active groups are recognized. Rizk et al. [100] proposed an advanced computation calculation that improves the way toward scanning for outliers in both big and small clusters. Chenaghlou et al. [101] goes on another level with their work in [99] to identify the exceptions in real time. The calculation identifies anomalies in real time and finds the sequential advancement of the clusters.
1. Advantages
• Being unsupervised methods they are good choice.
• No matter of different types of data, these techniques are robust on them.
• These methods are versatile and show good performance. They also give flexibility to the user to choose different portions of data stream.
2. Disadvantages
• They do not support the backtracking feature, so cannot reverse what is committed already.
• In most of the techniques, users have to specify the count of clusters in prior, which is a tough job.
• Sensitiveness of partitioning methods to the noise and start-up phase is also a major performance issue. Here also curse of dimensionality degrades the performance.
v. Ensemble-Based Approaches
These strategies are commonly utilized in machine learning because of their comparatively better results when contrasted with other related techniques. They are utilized in situations to address the question of whether outlier is based on which type of model. These techniques are typically useful in differentiation and clustering issues. They unite the outcomes from unrelated models to produce more durable models and afterward decrease the dependency of one model to a specific dataset or data region. But these techniques in the perception of anomaly discovery are known to be very difficult.
Lazarevic et al. [17] suggested the earliest known ensemble technique on enhancing anomaly identification. It utilizes the feature capturing way to deal with exceptionally large datasets. The strategy combines the outcome of multiple exception recognition techniques. Every technique chooses small portion of the original feature set at random and then allocates an outlier score to them. The experiments show that the joined strategy can deliver a superior outlier identification performance. Though, taking into account how to completely characterize these techniques for exceptionally huge and high dimensional datasets would be interesting future work.
Aggarwal [103] conducted study on outlier ensemble analysis, which has incited extraordinary enthusiasm on literature of outlier detection using ensemble techniques. He talks about different anomaly ensemble strategies and how they can be efficient. A few instances of anomaly gatherings with regards to classification and grouping were then given. In the classification framework, boosting [105] and bagging [17] are two cases of ensemble dependent strategies that have been proposed. With regards to clustering the Multiview [53] and alternative clustering [54] are example.
Other succeeding surveys about [108–110] in later years that concentrated on utilizing ensembles for outlier identification faced various difficulties.
Schubert et al. [109] differentiate outlier ranking dependent on the scores utilizing common factors. This study proposed greedy ensemble technique, which implies the importance of execution of ensembles through various aspects. Nguyen et al. [110] examined the difficulties of ensemble outlier detection strategies for high dimensional datasets. The study suggested a system which unites various techniques of several outlier detection methods. Rather than applying a similar methodology each time to decide the anomaly score, different discovery strategies are applied to surmised the outlier score. Utilizing the conventional idea of the exception score, they introduced Heterogeneous Detector Ensemble on irregular Subspaces (HeDES), to address problem of heterogeneity. From experimental evaluation this approach shows better results in outlier detection. However, stretching out the examination to bigger and higher dimensional datasets could be fascinating future work.
Zimek et al. [102] proposed an irregular subsampling procedure to find out the closest neighbors and afterward its local density. Utilizing other intrusion finding techniques combined using a subsampling method may provide different outcomes and increased efficiency. This method improves performance for outlier detection.
In [104] the authors thought about their procedure from the viewpoint of learning theory making use of the concept of interval and density calculations. For more detail understanding of Ensemble-Based Approaches one can refer to the outlier ensemble book of Aggarwal et al. which gives deep understanding of ensemble methods [111].
The advantages of the Ensemble-Based approaches are as follows.
1. Advantages
• Presence of updated methods makes them perform efficiently and they are also stable in nature
• Suitable for high dimensional database
• Where other methods fail in the case of noisy and streaming case they are able to give better results.
2. Disadvantages
• The techniques are not developed efficiently result in problems in well-known problem of feature evaluation of ensemble method.
• Due to tiny size of samples, analysis is difficult to be performed.
6 Outlier Detection in Streaming Data
Paper focuses on several outlier detection techniques. Number of algorithms on anomaly detection are suggested which work on static data sets. Though finding outlier in streaming data is more difficult task. Because information is mostly in constant flow and storing of all the information is not practical due to requirement of large amount of memory and high competency speed. The data generation rate is also high and tremendous in volume. Which makes it tougher to work on. The Researchers face several challenges such as multi-dimensionality, vulnerability issues and the notion of time etc. Analysts have seen these as fascinating difficulties, and they have concentrated on distinguishing exceptions in the data stream condition.
The research area demands study on the real time data, which are large volume and multi-dimensional datasets. Most of the outlier detection techniques fail to prove their effectiveness when it comes to streaming data. There is need to think out of the box from the old methods which uses conventional outlier detection techniques. So the study suggests that there is a need of a hybrid approach that combines classical algorithms and artificial intelligence algorithms in order to provide efficient solution for outlier detection of streaming data with good key performance indicators.
7 Conclusion
This paper study what is outlier detection and why it is important to focus on it as research problem. It also discusses various challenges and the approaches for outlier detection methods. The advantages and disadvantages of each of the strategies are discussed in view of some key performance indicators used for comparison of different algorithms. Special attention is given to the density based, statistical, distance based and clustering methods for unsupervised outlier detection. The existing outlier detection strategies cannot satisfy all the requirements for scalability, working on high dimensional datasets with satisfactory time complexity and efficient memory usage. The future study suggested by the paper is there is need of a hybrid technique who will better outperform the conventional techniques and which will be scalable, can handle large dimensional datasets, and have a minimum run time with least amount of memory.
Acknowledgment
I would like to express my gratitude and deep thanks to my research guide Dr. Vladimir Poulkov and Dr Milena Lazarova, Technical University of Sofia, Bulgaria, Europe. for their keen interest, inspiring guidance, constant encouragement with my work during all stages, to bring this paper and my research work into fruition.
References
[1] Vries, T, De., Chawla, S., and Houle, M, E., (2010), Finding local anomalies in very high dimensional space, In Proc. International Conference on Data Mining, pp. 128–137.
[2] Knorr, E.M., Ng, R. T., and Tucakov, V., (2000), Distance-based outliers: algorithms and applications, The VLDB Journal, Vol. 8, pp. 237–253.
[3] Orair, G, H., Teixeira, C., Wang, Y., Meira, W, Jr., and Parthasarathy, S., (2010), Distance-based outlier detection: Consolidation and renewed bearing, PVLDB, Vol. 3(2), pp. 1469–1480.
[4] Ramaswamy, S., Rastogi, R., and Shim, K., (2000), efficient algorithms for mining outliers from large data sets. In Proc. SIGMOD, pp. 427–438
[5] Vu, N, H., and Gopalkrishnan, V., (2009), Efficient pruning schemes for distance-based outlier detection, In Proc. European Conference on Machine Learning and Knowledge Discovery in Databases, pp. 160–175.
[6] Zhang, K., Hutter, M., and Jin, H., (2009), A new local distance-based outlier detection approach for scattered real-world data, Proc 13th Pacific Asia Conference Knowledge Discovery in Data Mining, pp. 813–822.
[7] Breunig, M. M., Kriegel, H. P., Ng, R. T., and Sander, J., (2000). LOF: identifying density-based local outliers, In ACM sigmod record, Vol. 29(2), pp. 93–104.
[8] Kriegel, H, P., Kriegel, P., Schubert, E., and Zimek, A., (2009), LoOP: local outlier probabilities, In Proceedings of the 18th ACM Conference on Information and Knowledge Management (CIKM), Hong Kong, China, pp. 1649–1652.
[9] Slezak, D., Yao, J., Peters, J., Ziarko, W., Hu, X., (2011), Rough Sets, Fuzzy Sets, Data Mining, and Granular Computing, Lecture Notes in Computer Science, Vol. 3642, Springer, Berlin Heidelberg, pp. 79–87.
[10] Zimek, A., Campello, R. J., and Sander, J. (2014), Ensembles for unsupervised outlier detection: challenges and research questions a position paper, ACMSIGKDD Explorations Newsletter, Vol. 15(1), pp. 11–22.
[11] F. Angiulli, S. Basta, and C. Pizzuti, “Distance-based detection and prediction of outliers,” IEEE Trans. Knowl. Data Eng., vol. 18, no. 2, pp. 145–160, Feb. 2006
[12] M. Breunig, H. Kriegel, R. T. Ng, and J. Sander, “LOF: Identifying density-based local outliers,” ACM SIGMOD Rec., vol. 29, no. 2, pp. 93–104, 2000.
[13] F. Cao, M. Ester, W. Qian, and A. Zhou, “Density-based clustering over an evolving data stream with noise,” in Proc. SIAM Conf. Data Mining, Apr. 2006, pp. 328–339.
[14] Z. Zheng, H. Y. Jeong, T. Huang, and J. Shu, “KDE based outlier detection on distributed data streams in multimedia network,” Multimedia Tools Appl., vol. 76, no. 17, pp. 18027–18045, Sep. 2017.
[15] H. P. Kriegel, P. Kröger, E. Schubert, and A. Zimek, “Outlier detection in axis-parallel subspaces of high dimensional data,” in Proc. Pacific-Asia Conf. Knowl. Discovery Data Mining, Berlin, Germany: Springer, 2009,pp. 831–838.
[16] J. Zhang, “Advancement of outlier detection: A survey,” ICST Trans. Scalable Inf. Syst., vol. 13, pp. 1–26, Feb. 2013.
[17] A. Lazarevic and V. Kumar, “Feature bagging for outlier detection,” in Proc. 11th ACM SIGKDD Int. Conf. Knowl. Discovery Data Mining, Aug. 2005, pp. 157–166.
[18] V. Barnett and T. Lewis, Outliers in Statistical Data. Hoboken, NJ, USA: Wiley, 1994
[19] S. Wallsh, “A review of statistical outlier methods,” Pharmaceutical Technol., vol. 30, no. 11, pp. 1–5, 2006
[20] E. Schubert, A. Zimek, and H.-P. Kriegel, “Local outlier detection reconsidered: A generalized view on locality with applications to spatial, video, and network outlier detection,” Data Mining Knowl. Discovery, vol. 28, no. 1, pp. 190–237, 2014.
[21] J. Tang, Z. Chen, A. Fu, and D. Cheung, “Enhancing effectiveness of outlier detections for low density patterns,” in Advances in Knowledge Discovery and Data Mining. Berlin, Germany: Springer, 2002, pp. 535–548.
[22] H. Kriegel, P. Kröger, E. Schubert, and A. Zimek, “LoOP: Local outlier probabilities,” in Proc. 18th ACM Conf. Inf. Knowl. Manage., Nov. 2009, pp. 1649–1652
[23] S. Papadimitriou, H. Kitagawa, P. B. Gibbons, and C. Faloutsos, “LOCI: Fast outlier detection using the local correlation integral,” in Proc. 19th Int. Conf. Data Eng., Mar. 2003, pp. 315–326.
[24] D. Ren, B. Wang, and W. Perrizo, “RDF: A density-based outlier detection method using vertical data representation,” in Proc. Int. Conf. Data Mining, Nov. 2004, pp. 503–506.
[25] W. Jin, A. K. Tung, J. Han, and W. Wang, “Ranking outliers using symmetric neighborhood relationship,” in Proc. 10th Pacific-Asia Conf. Adv. Knowl. Discovery Data Mining, 2006, pp. 577–593.
[26] K. Zhang, M. Hutter, and H. Jin, “A new local distance-based outlier detection approach for scattered real-world data,” in Proc. Pacific-Asia Conf. Knowl. Discovery Data Mining, 2009, pp. 813–822.
[27] M. Bai, X. Wang, J. Xin, and G. Wang, “An Efcient algorithm for distributed density-based outlier detection on big data,” Neurocomputing, vol. 181, pp. 19–28, Mar. 2016.
[28] B. Tang and H. He, “A local density-based approach for outlier detection,” Neurocomputing, vol. 241, pp. 171180, Jun. 2017. [Online]. Available: http://www.sciencedirect.com/science/article/pii/S0925231 217303302
[29] H. Kriegel, P. Kröger, E. Schubert, and A. Zimek, “LoOP: Local outlier probabilities,” in Proc. 18th ACM Conf. Inf. Knowl. Manage., Nov. 2009, pp. 1649–1652.
[30] S. Papadimitriou, H. Kitagawa, P. B. Gibbons, and C. Faloutsos, “LOCI: Fast outlier detection using the local correlation integral,” in Proc. 19 Int. Conf. Data Eng., Mar. 2003, pp. 315–326.
[31] K. Cao, L. Shi, G. Wang, D. Han, and M. Bai, “Density-based local outlier detection on uncertain data,” in Web-Age Information Management. WAIM (Lecture Notes in Computer Science), vol. 8485, F. Li, G. Li, S. Hwang, B. Yao, and Z. Zhang, Eds. Cham, Switzerland: Springer, 2014.
[32] F. Keller, E. Müller, and K. Bohm, “HiCS: High contrast subspaces for density-based outlier ranking,” in Proc. IEEE 28th Int. Conf. Data Eng. (ICDE), Apr. 2012, pp. 1037–1048.
[33] R. J. G. B. Campello, D. Moulavi, A. Zimek, and J. Sander, “Hierarchical density estimates for data clustering, visualization, and outlier detection,” ACM Trans. Knowl. Discovery Data (TKDD), vol. 10, no. 1, 2015,Art. no. 5. doi: 10.1145/2733381
[34] R. Momtaz, N. Mohssen, and M. A. Gowayyed, “DWOF: A robust density-based outlier detection approach,” in Proc. Iberian Conf. Pattern Recognit. Image Anal., 2013, pp. 517–525.
[35] H. Fan, O. R. ZaÏane, A. Foss, and J. Wu, “Resolution-based outlier factor: Detecting the top-n most outlying data points in engineering data,” Knowl. Inf. Syst., vol. 19, no. 1, pp. 31–51, 2009.
[36] K.Wu, K. Zhang,W. Fan, A. Edwards, and P. S. Yu, “RS-forest: A rapid density estimator for streaming anomaly detection,” in Proc. IEEE Int. Conf. Data Mining, Dec. 2014, pp. 600–609.
[37] E. Lozano and E. Acua, “Parallel algorithms for distance-based and density-based outliers,” in Proc. 5th IEEE Int. Conf. Data Mining, Nov. 2005, pp. 729–732
[38] F. I. Vázquez, T. Zseby, and A. Zimek, “Outlier detection based on low density models,” Proc. ICDM Workshops, 2018, pp. 970–979.
[39] J. Ning, L. Chen, and J. Chen, “Relative density-based outlier detection algorithm,” in Proc. CSAI/ICIMT, Dec. 2018, pp. 227–231.
[40] S. Su, L. Xiao, L. Ruan, F. Gu, S. Li, Z. Wang, and R. Xu, “An efficient density-based local outlier detection approach for scattered data,” IEEE Access, vol. 7, pp. 1006–1020, 2019
[41] W. Wang, J. Yang, and R. Muntz, “STING: A statistical information grid approach to spatial data mining,” in Proc. 23rd VLDB Conf., Aug. 1997, pp. 186–195.
[42] S. Hido, Y. Tsuboi, H. Kashima, M. Sugiyama, and T. Kanamori, “Statistical outlier detection using direct density ratio estimation,” Knowl. Inf. Syst., vol. 26, no. 2, pp. 309–336, 2011.
[43] H. Kriegel, P. Kröger, and A. Zimek, “Outlier detection techniques,” in Proc. Tutorial KDD, 2009, pp. 1–10.
[44] E. Eskin, “Anomaly detection over noisy data using learned probability distributions,” in Proc. 17th Int. Conf. Mach. Learn. (ICML). Jul. 2000, pp. 255–262.
[45] E. M. Knorr, R. T. Ng, and V. Tucakov, “Distance-based outliers: Algorithms and applications,” VLDB J., vol. 8, nos. 34, pp. 237–253, 2000.
[46] X. Yang, L. J. Latecki, and D. Pokrajac, “Outlier detection with globally optimal exemplar-based GMM,” in Proc. SIAM Int. Conf. on Mining (SDM), Apr. 2009, pp. 145–154.
[47] X. Tang, R. Yuan, and J. Chen, “Outlier detection in energy disaggregation using subspace learning and Gaussian mixture model,” Int. J. Control Autom., vol. 8, no. 8, pp. 161–170, 2015
[48] B. N. Saha, N. Ray, and H. Zhang, “Snake validation: A PCA-based outlier detection method,” IEEE Signal Process. Lett., vol. 16, no. 6, pp. 549–552, Jun. 2009.
[49] M. H. Satman, “A new algorithm for detecting outliers in linear regression,” Int. J. Statist. Probab., vol. 2, no. 3, pp. 101–109, Aug. 2013.
[50] C. M. Park and J. Jeon, “Regression-based outlier detection of sensor measurements using independent variable synthesis,” in Proc. Int. Conf. Data Sci., Dec. 2015, pp. 78–86.
[51] P. I. F. Dalatu, A. Fitrianto, and A. Mustapha, “A comparative study of linear and nonlinear regression models for outlier detection,” in Proc. Int. Conf. Soft Comput. Data Mining, 2017, vol. 549, pp. 316–327.
[52] M. Pavlidou and G. Zioutas, “Kernel density outlier detector,” in Topics Nonparametric Statistics. New York, NY, USA: Springer, 2014, pp. 241–250.
[53] L. J. Latecki, A. Lazarevic, and D. Pokrajac, “Outlier detection with kernel density functions,” in Proc. 5th Int. Conf. Mach. Learn. Data Mining Pattern Recognit., 2007, pp. 61–75.
[54] J. Gao, W. Hu, Z. Zhang, X. Zhang, and O. Wu, “RKOF: Robust kernel based local outlier detection,” in Proc. Pacific-Asia Conf. Knowl. Discovery Data Mining, 2011, pp. 270–_283
[55] V. S. K. Samparthi and H. K. Verma, “Outlier detection of data in wireless sensor networks using kernel density estimation,” Int. J. Comput. Appl.,vol. 5, no. 7, pp. 28–32, Aug. 2010
[56] A. O. Boedihardjo, C.-T. Lu, and F. Chen, “Fast adaptive kernel density estimator for data streams,” Knowl. Inf. Syst., vol. 42, no. 2, pp. 285–317,Feb. 2015.
[57] M. S. Uddin, A. Kuh, and Y. Weng, “Online bad data detection using kernel density estimation,” in Proc. IEEE Power Energy Society General Meeting, Jul. 2015, pp. 1–5.
[58] S. Smrithy, S. Munirathinam, and R. Balakrishnan, “Online anomaly detection using non-parametric technique for big data streams in cloud collaborative environment,” in Proc. IEEE Int. Conf. Big Data (Big Data), Dec. 2016, pp. 1950–1955.
[59] L. Zhang, J. Lin, and R. Karim, “Adaptive kernel density-based anomaly detection for nonlinear systems,” Knowl.-Based Syst., vol. 139, pp. 50–63, Jan. 2018.
[60] X. Qin, L. Cao, E. A. Rundensteiner, and S. Madden, “Scalable kernel density estimation-based local outlier detection over large data streams,” in Proc. EDBT, 2019, pp. 421–432.
[61] M. Goldstein and A. Dengel, “Histogram-based outlier score (HBOS): A fast unsupervised anomaly detection algorithm,” in Proc. Poster Demo Track, Sep. 2012, pp. 59–63.
[62] P. J. Rousseeuw and M. Hubert, “Robust statistics for outlier detection,” Data Mining Knowl. Discovery, vol. 1, no. 1, pp. 73–79, 2011.
[63] H. Du, S. Zhao, and D. Zhang, “Robust local outlier detection,” in Proc. IEEE Int. Conf. Data Mining Workshop (ICDMW), Nov. 2015, pp. 116–123.
[64] J. Gebhardt, M. Goldstein, F. Shafait, and A. Dengel, “Document authentication using printing technique features and unsupervised anomaly detection,” in Proc. 12th Int. Conf. Document Anal. Recognit., Aug. 2013, pp. 479–483.
[65] F. Angiulli and C. Pizzuti, “Fast outlier detection in high dimensional spaces,” in Proc. Eur. Conf. Princ. Data Mining Knowl. Discovery, Sep. 2002, pp. 15–26.
[66] T. T. Dang, H. Y. T. Ngan, and W. Liu, “Distance-based k-nearest neighbors outlier detection method in large-scale traffic data,” in Proc. IEEE Int. Conf. Digital Signal Process., Jul. 2015, pp. 507–510.
[67] E. M. Knorr and R. T. Ng, “Algorithms for mining distance based outliers in large data sets,” in Proc. 24th Int. Conf. Very Large Databases Conf., 1998, pp. 392–403.
[68] S. Ramaswamy, R. Rastogi, and S. Kyuseok, “Efficient algorithms for mining outliers from large data sets,” in Proc. ACM SIGMOD Int. Conf. Manage. Data, May 2000, pp. 427–438.
[69] A. Ghoting, S. Parthasarathy, and M. E. Otey, “Fast mining of distance based outliers in high-dimensional datasets,” Data Mining Knowl. Discovery, vol. 16, vol. 3, pp. 349–364, Jun. 2008.
[70] H. Huang, K. Mehrotra, and C. K. Mohan, “Rank-based outlier detection,” J. Stat. Comput. Simul., vol. 83, no. 3, pp. 518–531, Oct. 2013.
[71] G. Bhattacharya, K. Ghosh, and A. S. Chowdhury, “Outlier detection using neighborhood rank difference,” Pattern Recognit. Lett., vol. 60, pp. 24–31, Aug. 2015
[72] X. Wang, X. L. Wang, Y. Ma, and D. M. Wilkes, “A fast MST-inspired kNN-based outlier detection method,” Inf. Syst., vol. 48, pp. 89–112, Mar. 2015.
[73] M. Radovanovic, A. Nanopoulos, and M. Ivanovic, “Reverse nearest neighbors in unsupervised distance-based outlier detection,” IEEE Trans. Knowl. Data Eng., vol. 27, no. 5, pp. 1369–1382, May 2015
[74] J. Huang, Q. Zhu, L. Yang, and J. Feng, “A non-parameter outlier detection algorithm based on natural neighbor,” Knowl. Based Syst., vol. 92, pp. 71–77, Jan. 2016.
[75] J. Ha, S. Seok, and J.-S. Lee, “A precise ranking method for outlier detection,” Inf. Sci., vol. 324, pp. 88107, Dec. 2015.
[76] S. Bay and M. Schwabacher, “Mining distance-based outliers in near linear time with randomization and a simple pruning rule,” in Proc. ACM SIGKDD Int. Conf. Knowl. Discovery Data Mining, Aug. 2003, pp. 29–38.
[77] F. Angiulli and F. Fassetti, “Very efficient mining of distance-based outliers,” Proc. 16th ACM Conf. Inf. Knowl. Manage., Nov. 2007, pp. 791–800.
[78] D. Ren, I. Rahal, W. Perrizo, and K. Scott, “A vertical distance-based outlier detection method with local pruning,” in Proc. 13th ACM CIKM Int. Conf. Inf. Knowl. Manage., Nov. 2004, pp. 279–284.
[79] N. H. Vu and V. Gopalkrishnan, “Efficient pruning schemes for distance based outlier detection,” in Proc. Eur. Conf. Mach. Learn. Knowl. Discovery Databases, 2009, pp. 160–175.
[80] F. Angiulli and F. Fassetti, “Distance-based outlier queries in data streams: The novel task and algorithms,” Data Mining Knowl. Discovery, vol. 20, pp. 290–324, Mar. 2010.
[81] C. C. Aggarwal, “On abnormality detection in spurious populated data streams,” in Proc. SIAM Int. Conf. Data Mining, Apr. 2005, pp. 80–91.
[82] S. Subramaniam, T. Palpanas, D. Papadopoulos, V. Kalogeraki, and D. Gunopulos, “Online outlier detection in sensor data using nonparametric models,” in Proc. Int. Conf. Very Large Data Bases, Sep. 2006, pp. 187–198.
[83] D. Yang, E. A. Rundensteiner, and M. Ward, “Neighbor-based pattern detection for windows over streaming data,” in Proc. 12th Int. Conf. Extending Database Technol., Mar. 2009, pp. 529–540.
[84] M. Kontaki, A. Gounaris, A. N. Papadopoulos, and K. Tsichlas, “Continuous monitoring of distance-based outliers over data streams,” in Proc.IEEE 27th Int. Conf. Data Eng., Apr. 2011, pp. 135–146.
[85] F. Angiulli and F. Fassetti, “Detecting distance-based outliers in streams of data,” in Proc. 16th ACM Conf. Inf. Knowl. Manage., Nov. 2007, pp. 811–820.
[86] L. Cao, D. Yang, Q. Wang, Y. Yu, J. Wang, and E. A. Rundensteiner, “Scalable distance-based outlier detection over high-volume data streams,” in Proc. IEEE 30th Int. Conf. Data Eng., Apr. 2014, pp. 76–87.
[87] M. B. Al-Zoubi, “An effective clustering-based approach for outlier detection,” Eur. J. Sci. Res., vol. 28, no. 2, pp. 310–316, Jan. 2009.
[88] J. MacQueen, “Some methods for classification and analysis of multivariate observations,” in Proc. 5th Berkeley Symp. Math. Statist, Prob.,Jun. 1967, vol. 1, pp. 281–297.
[89] Y. Chen and L. Tu, “Density-based clustering for real-time stream data,” in Proc. 13th ACM SIGKDD Int. Conf. Knowl. Discovery Data Mining,Aug. 2007, pp. 133–142.
[90] C. C. Aggarwal, J. Han, J. Wang, and P. S. Yu, “A framework for clustering evolving data streams,” in Proc. 29 th Int. Conf. Very Large Database, vol. 29, pp. 81–92.
[91] I. Assent, P. Kranen, C. Baldauf, and T. Seidl, “Any Out: Anytime outlier detection on streaming data,” in Proc. 17th Int. Conf. Database Syst. Adv. Appl., 2012, pp: 228–242.
[92] M. Elahi, K. Li, W. Nisar, X. Lv, and H. Wang, “Efficient clustering based outlier detection algorithm for dynamic data stream,” in Proc. 5th Int. Conf. Fuzzy Syst. Knowl. Discovery, vol. 5, Oct. 2008, pp. 298–304.
[93] D. Pokrajac, A. Lazarevic, and L. J. Latecki, “Incremental local outlier detection for data streams,” in Proc. IEEE Symp. Comput. Intell. Data Mining, Apr. 2007, pp. 504–551.
[94] Yogita and D. Toshniwala, “A framework for outlier detection in evolving data streams by weighting attributes in clustering,” in Proc. 2nd Int. Conf. Commun., Comput. Secur., vol. 6, 2012, pp. 214–222. doi:10.1016/j.protcy.2012.10.026.
[95] S. V. Bhosale, “Outlier detection in streaming data using clustering approached,” Int. J. Adv. Comput. Sci. Inf. Technol., vol. 5, no. 5, pp. 6050–6053, 2014.
[96] M. Moshtaghi, J. C. Bezdek, T. C. Havens, C. Leckie, S. S. Karunasekera, S. Rajasegarar, and M. Palaniswami, “Streaming analysis in wireless sensor networks,” Wireless Commun. Mobile Comput., vol. 14, no. 9, pp. 905–921, Jun. 2014.
[97] M. Moshtaghi, J. C. Bezdek, C. Leckie, S. Karunasekera, and M. Palaniswami, “Evolving fuzzy rules for anomaly detection in data streams,” IEEE Trans. Fuzzy Syst., vol. 23, no. 3, pp. 688–700, 2015.
[98] M. Salehi, C. A. Leckie, M. Moshtaghi, and T. Vaithianathan, “A relevance weighted ensemble model for anomaly detection in switching data streams,” in Proc. Pacific-Asia Conf. Knowl. Discovery Data Mining, 2014, pp. 461–473.
[99] M. Chenaghlou, M. Moshtaghi, C. Leckie, and M. Salehi, “An efficient method for anomaly detection in non-stationary data streams,” in Proc. IEEE Global Commun. Conf. (GLOBECOM), Dec. 2017, pp. 1–6.
[100] H. Rizk, S. Elgokhy, and A. Sarhan, “A hybrid outlier detection algorithm based on partitioning clustering and density measures,” in Proc. 10th Int. Conf. Comput. Eng. Syst. (ICCES), Dec. 2015, pp. 175–181.
[101] M. Chenaghlou, M. Moshtaghi, C. Leckie, and M. Salehi, “Online clustering for evolving data streams with online anomaly detection,” in Proc. Pacific-Asia Conf. Knowl. Discovery Data Mining. New York, NY, USA: Springer, 2018, pp. 508–521.
[102] Zimek, M. Gaudet, R. J. Campello, and J. Sander, “Subsampling for efficient and effective unsupervised outlier detection ensembles,” in Proc. 19th ACM SIGKDD Int. Conf. Knowl. Discovery Data Mining, Aug. 2013, pp. 428–436
[103] C. C. Aggarwal, “Outlier ensembles: Position paper,” SIGKDD Explor. Newslett., vol. 14, pp. 49–58, Apr. 2013.
[104] Zimek, R. J. Campello, and J. Sander, “Data perturbation for outlier detection ensembles,” in Proc. 26th Int. Conf. Sci. Stat. Database Manage., Jul. 2014, pp. 1–13. doi: 10.1145/2618243.2618257
[105] G. O. Campos, A. Zimek, and W. Meira, Jr., “An unsupervised boosting strategy for outlier detection ensembles,” in Proc. 22nd Pacific-Asia Conf. Adv. Knowl. Discovery Data Mining (PAKDD), 2018, pp. 564–576
[106] M. Shukla, Y. P. Kosta, and P. Chauhan, “Analysis and evaluation of outlier detection algorithms in data streams,” in Proc. IEEE Int. Conf. Comput., Commun. Control (IC4), Sep. 2015, pp. 1–8.
[107] L. Tran, L. Fan, and C. Shahabi, “Distance-based outlier detection in data streams,” in Proc. VLDB Endowment (PVLDB), vol. 9, no. 12, pp. 1089–1100, Aug. 2016.
[108] H. P. Kriegel, P. Kréger, E. Schubert, and A. Zimek, “Interpreting and unifying outlier scores,” in Proc. SDM, Apr. 2011, pp. 13–24.
[109] E. Schubert, R. Wojdanowski, A. Zimek, and H. P. Kriegel, “On evaluation of outlier rankings and outlier scores,” in Proc. SDM, Apr. 2012, pp. 1047–1058.
[110] H. V. Nguyen, H. H. Ang, and V. Gopal Krishnan, “Mining outliers with ensemble of heterogeneous detectors on random subspaces,” in Database Systems for Advanced Applications, Berlin, Germany: Springer, 2010, pp. 368–383.
[111] C. C. Aggarwal, “Outlier ensembles,” ACM SIGKDD Explor. Newslett., vol. 14, no. 2, pp. 49–80, 2017, pp. 237–253.
Biography

Ankita Karale received the B.E. and M.E. degree in Computer Engineering. She has more than 7 years of experience in teaching and research. She is Ph.D Scholar in Computer Engineering in Technical University Of Sofia, Bulgaria, Europe.
Her Current research focuses on Data Mining, Artificial Intelligence and Swarm Intelligence.
Journal of Mobile Multimedia, Vol. 16_3, 351–388.
doi: 10.13052/jmm1550-4646.1635
© 2020 River Publishers