Analytical Framework to Understand Electric Vehicle Adoption by Leveraging Sentiment Analysis
Madhu Bala Myneni1,*, Haritha Akkineni2, Cherukuri Kiran Mai1 and Sisira Boppana3
1Computer Science and Engineering, VNR Vignana Jyothi Institute of Engineering and Technology, Hyderabad, Telangana, India
2Department of Information Technology, PVP Siddhartha Institute of Technology, Andhra Pradesh, India
3North Carolina State University, USA
baladandamudi@gmail.com; aharithapvpsit@gmail.com; ckiranmai@vnrvjiet.in; sisiboppana@gmail.com
*Corresponding Author
Received 17 August 2024; Accepted 10 November 2024
Abstract
Electric vehicles (EVs) are gaining eminence as a sustainable alternative to conventional vehicles. Even though EV’s are more expensive than conventional vehicles, people are excited about this green initiative. Hence, understanding public sentiment towards them becomes crucial for industry stakeholders and policymakers. This paper proposes a Twitter-based analytical framework to develop the application of sentiment analysis to understand public perceptions and concerns toward EVs. The opinions are tagged with three categories: constructive(positive), adverse(negative), and unbiased(neutral) from the overall public perception of electric mobility. It has been implemented in two phased manner as descriptive and predictive analytics on Twitter data. The study provides insights into the public’s support, concerns, and potential barriers to EV adoption. A sentiment model was evaluated with various machine-learning algorithms. The results ascertained that the SVM is performing well among all other models with 89% accuracy. Findings highlight critical factors influencing perception and offer recommendations for addressing public concerns to encourage broader acceptance of electric vehicles.
Keywords: Natural language processing, social media, logistic regression, K-nearest neighbour, and support vector machine.
1 Introduction
Social media is a rich source for collecting people’s perceptions on various burning issues. In the traditional approach, the analysis of data is concerned with census data, statistics on recorded data, and surveys are effective for lasting development trends. However, these approaches are unable to capture the pulse of the people for generating real-time snapshots. The world is buzzing about electric vehicles. It is truly the electric age, and most conversations are happening on Twitter. People are drawn to electric vehicle (EV) technology for three reasons: reduced reliance on fossil fuels, zero carbon emissions, and long-term development. According to e-AMRIT (Accelerated e-Mobility Revolution for India’s Transportation) portal 7 lakhs+ EVs vehicle registrations are recorded, and 1800 public EV charging stations are installed [21]. Researching public opinion on electric vehicles can leverage data from Twitter conversations and mainstream media articles. Twitter, a widely popular platform, enables users to share concise messages due to the limitation of the maximum size as 128 characters, making it valuable for social network analysis. Sentiment analysis helps interpret emotions expressed in these posts, providing insights into public expectations, beliefs, and concerns. Social media’s growth allows companies to monitor opinions on products or services across platforms like Twitter, Facebook, and YouTube. Analysing public sentiment on electric vehicles is essential for understanding people’s perspectives about green initiative. Hence, social media is considered as a dynamic source of content to learn about people’s voices instead of traditional surveys.
Study on various sentiment frameworks proposed by the researchers with different features and algorithms are summarized. Sentiment analysis on electric vehicles was carried out using a few existing classification models as references and discovered that social media stands as a prominent contributor in the rise of stocks in the electric vehicle market [1]. Social media has a profound effect on people’s thinking and behaviour, leading to market changes, and will continue to have an impact on our lives for the foreseeable future. The adoption and usage of electrical vehicles was investigated [2]. Their data targeted the sentiments of rural US population towards EV’s. Considering the reputation of geographic locations and spatial variations, the research aims to highlights the influencing parameters on sentiment in these areas. To help them out in their investigations on the relationship between sentiment and various factors, such as, the age, tweet topics and sex, the number of charging stations, and EV-related accidents near the tweet’s geographical origin using Hierarchical Linear Models, Generalized Linear Models and Geographically Weighted Regression. Some parameters that expressed positive sentiment are the EV cost benefits and more charging stations in the county. The parameters that showed negative sentiment were tweets on EV accidents were high in number. This research concluded in finding out public pulse from various geographies on Sustainable transportation practices. A new evaluation framework was developed for sentiment analysis of EV based on the stochastic multi-criteria acceptability analysis (SMAA) method with interval type-2 fuzzy sets (IT2FSs) from consumer reviews [3]. It focused on overcoming the limitations of existing weight determination methods and accuracy of sentiment classification. This approach assists the decision makers to use of central weight vectors to identify the strengths and weaknesses of EVs and the competitor analysis of through dominance relationships. Sentiment on electric vehicles is more positive, as electric vehicles are a popular technology that has received a positive reaction from the general population from YouTube data [4]. There are a lot of videos on electric vehicles, and people post their thoughts through comments. Feature selection models like information gain, relief, and chi-squared are used with support vector machines and logistic algorithms to provide greater accuracy in predicting social media sentiment analysis. The results were examined by cross-fold validation and found greater accuracy compared to when no feature selection was implemented on the data. A prediction system on Yelp’s rating database reviews applying variant ML algorithms like SVM, the perceptron, and Naive Bayes was developed [5]. The effectiveness of different algorithms is assessed based on metrics like precision and recall. In their setting of sentiment analysis, they conclude that binarized Naive Bayes paired with feature selection with deleted stop words and stemming is the best. With all these references, this article primarily focuses on people’s opinions on the topic of electric vehicles, and the data was extracted from the Twitter API. The raw data is unorganized and contains many retweets; to create a better machine learning model, the data should be cleaned of retweets and words that don’t provide any meaning. The accuracy scores are compared to find which model provides the best results.
The authors in [6] aimed to examine influencing factors regarding consumers’ views to buy EVs, with a specific focus on user attitudes and perceptions through online survey in South Korea. Regression tree analysis and Logistic regression was used to understand complex interaction between variables and predict factors affecting purchase intentions.
The authors in [7] analysed scientific contributions on EV research over a period of 12 years. The text mining approaches used for evaluating and optimising policies relevant to China’s new energy vehicle industry [8]. The analysis of Chinese consumer’s behaviour to find out the factors affecting their preferences was developed by adopting big data and text mining technologies [9]. Comparing with the previous research online comment mining is a different task, which includes emotion analysis including the extraction and interpretation of emotions expressed in texts [10]. Further focused on analysis of user experience topics connected to EVs using topic modelling and classification model in specific to electric charging stations [11]. A word2vec and CNN classifier are used to classify sentiment [12], on user reviews of charging station experiences which noted positive and negative sentiment in the user reviews was 50:50. Topic models and voltage-aware dictionaries were utilized to analyse top tweets on electric vehicles [13]. Text mining approach and web crawler was used to explore public sentiments toward New Electric Vehicles from the largest open social media platform in China, Sina Weibo. Public’s sentiment orientations towards NEVs are gathered using NLPIR-Parser platform [14]. Statistical Analysis and LDA topic modelling were used. The findings indicate that a significant portion of NEV (New Energy Vehicle) followers are associated with media and broadcasting sectors, which could result in amplified advertising of NEV performance. Additionally, public interest in NEVs is higher in regions focused on environmental pollution and in developed economic areas compared to other regions. Furthers works are inclined toward developing a more comprehensive picture on perception of public regarding EV’s from distinct mechanisms of various OSNs like Reddit and Twitter [15]. Posts were analysed from different perspectives using computational social science methods like topic modelling, more specifically LDA was utilized to understand huge collection of documents. The results indicate a potential disagreement between politicians and the general public, politicians seem to be increasingly optimistic about EVs while the public may may hold a more differing view.
The identification of most impacting factors helps to reveal the consumers attitude towards EV adoption [16]. There was limited existing study on people’s disinterest on EV adoption from pro-environmental behaviour perspective. So authors in this work focused on developing a model consisting of Norm Activation Model and the Theory of Planned Behaviour to find the influencing factors on consumers intentions. The analysis was conducted on consumers from Malaysia based on the questioner using a structural equation model. The study indicates that consumers’ purchase intentions for (EVs) are significantly and positively influenced by factors such as perceived value, subjective norms, attitudes, personal norms, perceived effectiveness, and awareness of environmental consequences. These insights help to better understand consumer behaviour toward EV adoption and provide guidance for further promoting EV development.
Over the study of related works, it is observed that an end-to-end framework is essential for addressing the problems linked with social media texts. Hence, this work focuses on an analytical framework having the pipeline to address the various functional components included in the process like: data collection from Twitter based on hashtag related to EV’s, sentiment analysis for labelling their opinions, and a classification model for further analysis.
The article has been organized into further sections, as Section 2 discusses the proposed analytical framework pipeline design and step-by-step process included in data preprocessing, feature extraction, and sentiment score generation, and Section 3 addresses the sentiment model evaluation using various machine learning algorithms. Section 4 provides the results achieved through experimentation.
2 Methodology
The people’s opinions shared on Twitter are analysed using sentiment analysis and classification algorithms with effective visualizations. The framework consists of two approaches: Descriptive analytics (DA) for the statistical approach of users’ data and predictive analytics (PA) to perform content analysis on people’s opinions. Descriptive analysis is a composition of summarizing and presenting information about the features, patterns, and nature of Twitter datasets. It is concerned with the number of tweets, retweets, unique users, hashtags, and the classification of tweets into different types as the most active or visible users. Predictive analytics gives an in-depth analysis of people’s opinions on multiple themes about EV vehicles. Content analysis of Twitter data involves analyzing the content of the tweets to understand the themes, topics, and sentiments expressed by users in the form of polarities, etc. Figure 1 shows an analytical framework using a leveraged sentiment model for the assessment of people’s perceptions of electric vehicles.
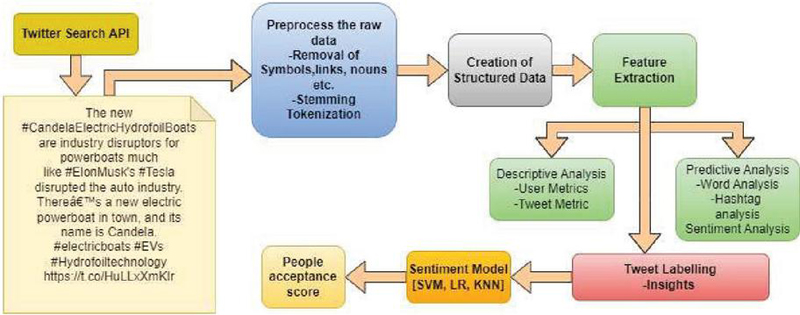
Figure 1 Analytical framework using a leveraged sentiment model for assessment of people’s perceptions about electric vehicles.
The people’s opinions shared on Twitter are analysed using sentiment analysis and classification algorithms with effective visualizations. The detailed Twitter-based analytical framework is shown in Figure 1.
The framework is composed of two approaches: Descriptive analytics (DA) [18] for the statistical approach of users’ data and predictive analytics (PA) [17] to perform content analysis on people’s opinions. Descriptive analysis is a composition of summarizing and presenting information about the features, patterns, and nature of Twitter datasets. It is concerned with the number of tweets, retweets, unique users, hashtags, and the classification of tweets into different types as the most active or visible users. Predictive analytics gives an in-depth analysis of people’s opinions on multiple themes about EV vehicles. Content analysis of Twitter data involves analysing the content of the tweets to understand the themes, topics, and sentiments expressed by users in the form of polarities, etc. Figure 1 shows a leveraged sentiment model for the assessment of people’s perceptions of electric vehicles.
2.1 Acquisition of Public Perception
Public perceptions on EV are collected through Twitter API using various prominent hashtags considered as #electriccar, #electricvehicles, #electricscooter, #electricvehicle, #EVs, and #geoelectric. The sample dataset consists of 27,481 tweets, organized in the columns id, name, tweets, likes, and time. Table 1 provides sample tweets of the collected data. The gathered data is unstructured and contains a lot of diversified topics, special symbols, URLs, hashtags, etc., and many retweets. To create a perfect machine learning model, the data should be well-cleaned and free of retweets.
| Twitter posts |
| #electric #Powertrain #market is projected to be valued at USD 191.4 billion by 2027, growing at a CAGR of 14.9%. |
| https://t.co/WSUEBS9sBP |
| #automotiveindustry #automotive #ElectricVehicles #ElectricVehicle #EVs #ElectricCar #electrichybrid #vehicles #Automobile #technology |
| “REE Unveils Leopard, a Fully Autonomous Concept Vehicle Based on REE’s Modular #EV Platform” |
| #ElectricVehicles #ElectricVehicle #REE |
| https://t.co/0yDX8vBcri’s-Modular-EV-Platform |
2.2 Preprocessing of Twitter Data
Preprocessing is one of the crucial steps in model construction. The process of cleaning unwanted data includes the removal and transformation of raw data. If the machine learning model is developed without preprocessing the data, it leads to bad patterns and results in low accuracy. The different stages of preprocessing include removal, stemming, and lemmatization. Unwanted content identification and removal concentrate on retweets, usernames, special characters, URLs, stop words, and nouns. which are not prominent in finding sentiment included in the tweet data. All the phases involved in preprocessing are given in Figure 2. Which filters out the processed tweets with people’s opinions.
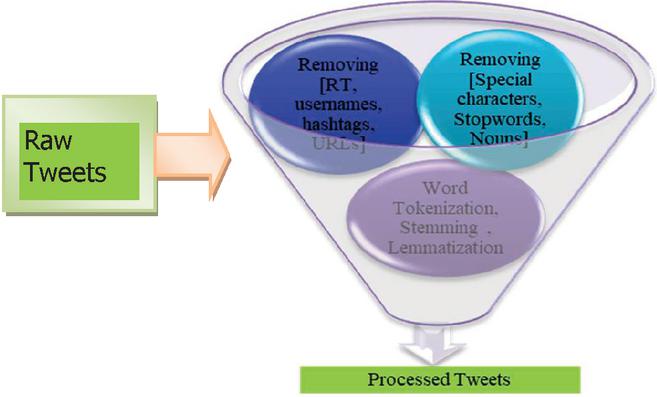
Figure 2 Structure for preprocessing.
2.2.1 Removing RT (Retweets)/User Names/Hashtags/URLs/ Special Characters/Stop Words/Nouns
The collected raw data contains multiple retweets (RT), which leads to redundancy of data, so cleaning of RT is necessary to make our data clean. Retweets can be identified if the tweet starts with the word “RT.” The gathered data is unstructured and contains many retweets. To create a perfect machine learning model, the data should be well-cleaned without retweets, and the words in the data contain no meaning, which does not help train the machine learning model. Usernames are the Twitter ids of the persons who tweet, usernames don’t provide any usefulness in analysis. Words start with the symbol ‘@’ thus they are easily identified and removed. Some of the hashtags don’t contain any useful meaning. Hashtags are starts with ‘#’ thus they are easily identified and removed. URLs such as https://ev.t.1044.ty/, and http://dt.h1.4.evs.blrg/ do not provide any meaning to the text, so removing any links in the data does not have any meaning. Any special characters like “%, $, &, =, *,+, ” will decrease the quality of the data and don’t provide any useful meaning. Stop words has very little meaning or no meaning at all in sentiment analysis these stop words do not have any significant effect or very little effect on the accuracy of the model. Names such as Elon musk, and Tesla are frequently repeated in the tweets and they are not so useful in training the model. This can be done by tagging parts of the speech in the tweet.
The raw words in the sentences are extracted after removing the noise from the dataset. These words contain the exact sense or emotion or sentiment voiced by the user’s tweets. Tokenization is the process of breaking down sentences into words and punctuation marks [2]. It refers to producing a list of words by separating the string [20]. In this experimentation, the Tweet Tokenizer module is used to tokenize the words available in “Natural Language Toolkit” (NLTK) package. It is used to determine the characteristics of the data and language. The steps to tweet tokenization are provided in Algorithm 1.
2.2.3 Stemming & lemmatization
Stemming is the progression of creating the morphological variants of a word. For instance, growing can be stemmed as “grow” or “try” can be stemmed as “tri.” After stemming, the words can lose their meaning [19]. Lemmatization is the process of converting those words into meaningful words. Algorithm 2 is for stemming and lemmatizing data.
Initially, the cleaned raw data needs to be explored and kept in a structure before model construction. Hence, observing the number of words in the tweets shows how the data is organised and helps in finding the best machine-learning algorithm. According to the extracted sample data, the minimum number of words in tweets is 2 and the maximum number of words is 134. Figures 3 and 4 illustrate the sample tweets having a maximum and a minimum number of words after preprocessing.
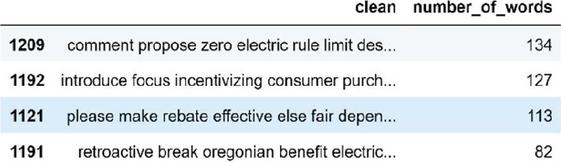
Figure 3 Sample Tweets contain the maximum number of words.
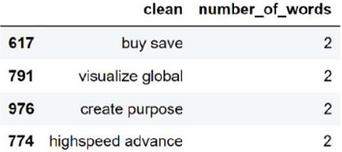
Figure 4 Sample Tweets contain a minimum number of words.
The processed data visualization helps to understand how the data was organised in the data set and what frequent words are present in the data. “Data labelling” is the process of figuring out whether a tweet is good, bad, or neutral. This can be done by counting how many words in the tweets are positive or negative. If a tweet contains more positive words, it is assumed that the sentiment is positive; if the tweet contains more negative words, the sentiment is assumed to be negative. The sentiment score is calculated by subtracting the number of negative words from the number of positive words. It is presumed that if the sentiment score is more than one, the tweet is positive; otherwise, it is negative. The visualisation of positive and negative words by using a word cloud is a way of making a graphic presentation of the words that are contained in the data, which helps to understand the distribution of the words in the data set. The larger font in the plot indicates that the word was used more frequently in the majority of the tweets.
The sentiment model was created using classifiers such as k-nearest neighbours’ logistic regression and support vector machines.
3 Classifiers Used in Sentiment Models
The sentiment model will determine how accurately the opinions are labelled and analysed. The mathematical model and its implementation with appropriate design parameters are crucial parameters to define the accuracy of the model. The classifier used for capturing people’s opinions as in Figure 5.
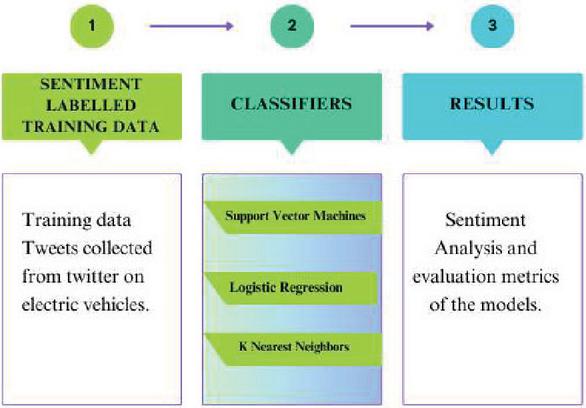
Figure 5 Classifiers overview.
3.1 Support Vector Machine (SVM)
Support vector machines (SVMs) are supervised learning algorithms best suited for classification tasks that require grouping. SVMs use various kernel functions, most commonly linear, polynomial, and radial, to transform data and find optimal decision boundaries for classification. The linear kernel function can be represented in Equation (1).
| (1) |
3.2 Logistic Regression
Logistic regression are used for classification problems and is built on probability theory. The log p(x) is a linear function of x and that it is restricted to a range of (0, 1) hence considered a sigmoid function is depicted in Equation (2).
| (2) |
3.3 K-Nearest Neighbour (KNN)
KNN classifier is a machine learning approach based on “lazy learner algorithm”. which does not learn from the training set; it stores the data and performs the action at the time of classification. In KNN classification, the input x is assigned to the class with the highest probability of being correct. Equation (3) depicts the finding nearest neighbour.
| (3) |
4 Results and Discussions
The implementation of the proposed analytical framework is demonstrated on the Twitter data extracted based on hashtags. The prominent hashtags are found in Twitter conversations related to electric vehicles. It is performed in a phased approach having descriptive analytics with the statistical metrics on users’ data and predictive analytics to perform content analysis on people’s opinions. Figure 6 illustrates the bar graph of frequent hashtags used by people on Twitter. In the collected data unique words are identified in the #electricvehicles hashtag tweets, hence it is appropriate to consider these opinions on the new arrival of electric vehicles.

Figure 6 The most frequent hashtags used on Twitter for referring to electric vehicles.
4.1 Descriptive Analytics
The descriptive analytics includes user statistics and in-depth tweet characteristics. The collected data insights are analyzed in terms of characters and words. It is observed that in all tweets, the number of minimum words is 2 and the maximum is 134. The number of minimum and the maximum characters are observed as 6 and 853. The sample tweets having minimum and maximum tweets are illustrated in Figures 7 and 8.
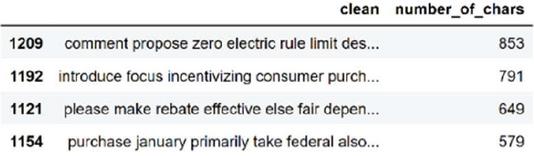
Figure 7 Sample tweets contain a minimum number of characters.
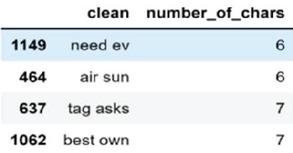
Figure 8 Sample tweets contain the maximum number of characters.
The content of the tweets is analyzed on preprocessed text. Visualization of sentiment on people’s opinions. The sentiment of people’s opinions is illustrated in Figure 9.
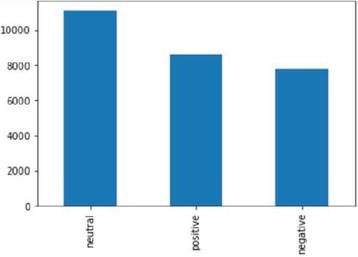
Figure 9 Visualization of the distribution of various sentiment types presented in Twitter data.
In the collected data, the sentiment scores are found to be 44.6% neutral, 39.4% positive, and 16% negative. Further, neutral tweets are not considered to train the model. The creation of the model includes the data labelled positive or negative.
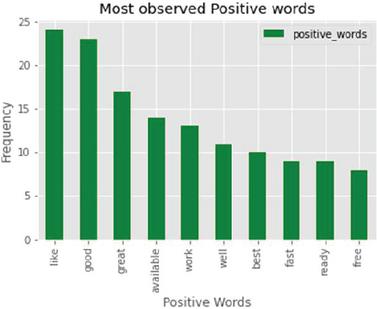
Figure 10 Most observed positive words.

Figure 11 Word cloud for positive words.
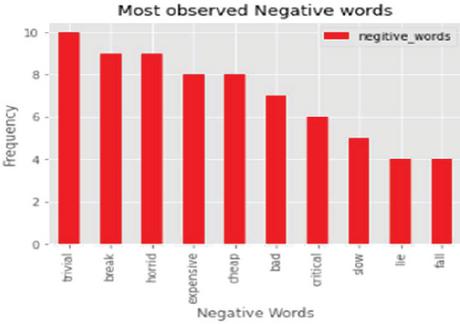
Figure 12 Most observed negative words.
Figures 10 and 11 illustrate the positive words found on Twitter and their visualization in the word cloud. The word cloud you shared here showcases positive sentiment words commonly associated with electric vehicles (EVs). Words like “good,” “great,” “support,” “right,” “well,” “encourage,” “clean,” and “efficient” reflect public perceptions of EVs as beneficial, eco-friendly, and forward-thinking alternatives to traditional vehicles. This indicates positive support and acceptance for EVs, likely due to their environmental benefits, cost-effectiveness over time, and alignment with sustainable practices.
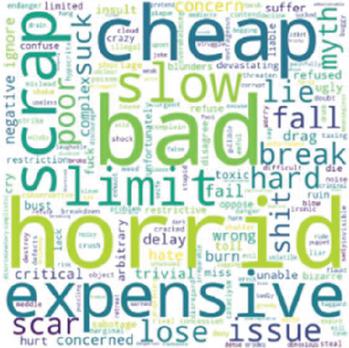
Figure 13 Word cloud for negative words.
Negative words found in tweets and Word clouds of positive words are given in Figures 12 and 13. Prominent words include cheap, bad, horrid, slow, expensive, and issue, among others. It is narrated from a word cloud of negative words as common myths about EVs along with clarifications to dispel them:
1. EVs are too expensive Myth: EVs are significantly more expensive than conventional cars. Reality: While EVs may have a higher upfront cost, they often save money over time due to lower fuel, maintenance, and repair costs. Additionally, incentives and tax credits can further reduce the initial price.
2. EV batteries don’t last long Myth: EV batteries wear out quickly and need frequent replacements. Reality: Modern EV batteries are designed to last a long time, often upwards of 10 years or over 100,000 miles, with warranties to back them up. Battery technology continues to improve, extending lifespan even further.
3. There aren’t enough charging stations Myth: Charging stations are scarce, making EVs inconvenient for long trips. Reality: The charging infrastructure is rapidly expanding, with many new stations being built across highways and urban areas. Apps and maps help drivers easily locate nearby charging points.
4. EVs are just as bad for the environment Myth: The electricity used to charge EVs is generated from fossil fuels, making them no greener than gasoline cars. Reality: While electricity sources vary by region, EVs still have a lower overall environmental impact than gas vehicles. Renewable energy sources continue to grow, making EVs even greener over time.
5. EVs are slow and have poor performance Myth: Electric cars don’t have the power or speed of gas-powered vehicles. Reality: Many EVs have excellent acceleration and smooth handling. Electric motors provide instant torque, giving some EVs faster acceleration than traditional vehicles.
6. Charging takes too long Myth: Charging an EV takes forever, making it impractical for daily use. Reality: With advancements in fast-charging technology, many EVs can now charge to 80% in 30 minutes or less at fast-charging stations. Home chargers are ideal for overnight charging.
7. EVs aren’t safe Myth: Electric vehicles are more dangerous in accidents. Reality: EVs undergo rigorous safety testing and often receive high safety ratings. Many models include advanced safety features, and the lower center of gravity due to the battery placement makes them less likely to roll over.
8. EVs don’t work in cold climates Myth: Cold weather makes EVs unreliable. Reality: While EV range can be affected by extreme temperatures, most modern EVs are designed to handle cold climates. Pre-conditioning features can warm up the car and battery before driving, and some batteries have built-in temperature management systems.
4.2 Predictive Analytics
The sentiment model is built by using variant algorithms like k-nearest neighbour, logistic regression, and support vector machine algorithms. The response of the models under the test data set, the SVM shows 89% of tweets are classified correctly. Table 2 shows the comparison of different models. The proposed model, with Support Vector Machine (SVM) achieving 89% accuracy, demonstrates a distinct advantage over existing studies and proposed model with test data in positive scenario was also analysed. Offering high performance with a simpler architecture. This efficiency, along with a strong balance in recall and precision, makes the proposed model a practical, scalable solution for sentiment analysis.
Table 2 Sentiment model performance among variant models
| Methodology/ | F1 Score/ | ||||
| Study | Data Source | Model | Accuracy | Recall | Precision |
| Bhatnagar & Choubey (2021) | LSTM, CNN | 86% | 0.85 | 0.84 | |
| Suresha & Tiwari (2021) | LDA, VADER | 78% | 0.81 | 0.79 | |
| Ruan & Lv (2023) | Reddit and Twitter | Cross-Platform Analysis | 88% | 0.87 | 0.85 |
| Saranya & Usha (2023) | Intelligent WordNet Lemmatizer | 87% | 0.86 | 0.85 | |
| Proposed Framework with test data of positive scenario | K-Nearest Neighbours | 74% | 0.84 | 0.73 | |
| Logistic Regression | 74% | 0.83 | 0.78 | ||
| Support Vector Machine | 78% | 0.86 | 0.76 | ||
| Proposed Framework with overall performance | K-Nearest Neighbours | 80% | 0.79 | 0.80 | |
| Logistic Regression | 79% | 0.78 | 0.79 | ||
| Support Vector Machine | 89% | 0.86 | 0.88 |
5 Conclusions
The proposed analytical model was demonstrated by exploring people’s opinions on electric vehicle initiatives and reveals the process of creating a sentiment model. The descriptive analytics was performed on Twitter data collected in real-time. The preprocessed data was analysed to identify user perspectives and statistics of both positive and negative used words. The sentiment model has been trained based on sentiment score-based labels and sentiment tags. The sentiment model was evaluated using support vector machines, logistic regression, and k-nearest neighbours. The experimental results are evidence that the SVM model shows the highest accuracy among all other models with 89%. Posts on social media about electric vehicles have revealed a growing sense of optimism and self-assurance, which is consistent with the notion that electric vehicles will soon be accepted by a larger population.
This can be extended with larger data sets in order to obtain superior results and gain superior insights regarding electric vehicles. It has the potential to raise their level of productivity by locating and mitigating the issues brought on by electric vehicles.
References
[1] Cho, S. (2021). Scientific data analysis: Employing sentimental analysis to prove correlation between social media and electric vehicles in modern society. International Journal of Data Science and Analysis, 7(3), 76–81. https://doi.org/10.11648/j.ijdsa.20210703.14.
[2] Wang, M., Zhao, L., and Cochran, A. L. (2024). Sentiments of rural U.S. communities on electric vehicles and infrastructure: Insights from Twitter data. Sustainability, 16(11), 4871. https://doi.org/10.3390/su16114871.
[3] Gong, B., Liu, R., Zhang, X., Chang, C. T., and Liu, Z. (2023). Sentiment analysis of online reviews for electric vehicles using the SMAA-2 method and interval type-2 fuzzy sets. Applied Soft Computing, 147, 110745. https://doi.org/10.1016/j.asoc.2023.110745.
[4] Costello, F., and Lee, K. (2020). Exploring the sentiment analysis of electric vehicles social media data by using feature selection methods. Journal of Digital Convergence, 18(2), 249–259. https://doi.org/10.14400/JDC.2020.18.2.249.
[5] Tiwari, K. K., and Suresha, H. (2021). Topic modeling and sentiment analysis of electric vehicles of Twitter data. Asian Journal of Research in Computer Science, 12(2), 13–29. https://doi.org/10.9734/ajrcos/2021/v12i230278.
[6] Lashari, Z. A., Ko, J., and Jang, J. (2021). Consumers’ intention to purchase electric vehicles: Influences of user attitude and perception. Sustainability, 13, 6778. https://doi.org/10.3390/su13126778.
[7] Gupta, A., and Kumar, H. (2022). Multi-dimensional perspectives on electric vehicles design: A mind map approach. Cleaner Engineering and Technology, 8, 100483. https://doi.org/10.1016/j.clet.2022.100483.
[8] Yang, T., Xing, C., and Li, X. (2021). Evaluation and analysis of new-energy vehicle industry policies in the context of technical innovation in China. Journal of Cleaner Production, 281, 125126. https://doi.org/10.1016/j.jclepro.2020.125126.
[9] Ma, S. C., Fan, Y., Guo, J. F., Xu, J. H., and Zhu, J. (2019). Analysing online behaviour to determine Chinese consumers’ preferences for electric vehicles. Journal of Cleaner Production, 229, 244–255. https://doi.org/10.1016/j.jclepro.2019.04.374.
[10] Karyukin, V., Mutanov, G., and Mamykova, Z. (2022). On the development of an information system for monitoring user opinion and its role for the public. Journal of Big Data, 9, 110. https://doi.org/10.1186/s40537-022-00660-w.
[11] Ha, S., Marchetto, D. J., Dharur, S., and Asensio, O. I. (2021). Topic classification of electric vehicle consumer experiences with transformer-based deep learning. Patterns, 2(2), 100195. https://doi.org/10.1016/j.patter.2020.100195.
[12] Bhatnagar, S., and Choubey, N. (2021). Making sense of tweets using sentiment analysis on closely related topics. Social Network Analysis and Mining, 11(44). https://doi.org/10.1007/s13278-021-00752-0.
[13] Suresha, H. P., and Kumar Tiwari, K. (2021). Topic modeling and sentiment analysis of electric vehicles of Twitter data. Asian Journal of Research in Computer Science, 12(2), 13–29. https://doi.org/10.9734/ajrcos/2021/v12i230278.
[14] Wu, Z., He, Q., Li, J., Bi, G., and Antwi-Afari, M. F. (2023). Public attitudes and sentiments towards new energy vehicles in China: A text mining approach. Renewable and Sustainable Energy Reviews, 178, 113242. https://doi.org/10.1016/j.rser.2023.113242.
[15] Ruan, T., and Lv, Q. (2023). Public perception of electric vehicles on Reddit and Twitter: A cross-platform analysis. Transportation Research Interdisciplinary Perspectives, 21, 100872. https://doi.org/10.1016/j.trip.2023.100872.
[16] Asadi, S., Nilashi, M., Samad, S., Abdullah, R., Mahmoud, M., and Alkinani, M. H. (2021). Factors impacting consumers’ intention toward adoption of electric vehicles in Malaysia. Journal of Cleaner Production, 282, 124474. https://doi.org/10.1016/j.jclepro.2020.124474.
[17] Khusanboev, I., Yodgorov, I., and Karimov, B. (2024). Advancing electric vehicle adoption: Insights from predictive analytics and market trends in sustainable transportation. In Proceedings of the 7th International Conference on Future Networks and Distributed Systems (pp. 314–320). Association for Computing Machinery. https://doi.org/10.1145/3644713.3644754.
[18] Trinko, D., Porter, E., Dunckley, J., Bradley, T., and Coburn, T. (2021). Combining ad hoc text mining and descriptive analytics to investigate public EV charging prices in the United States. Energies, 14(17), 5240. https://doi.org/10.3390/en14175240.
[19] Saranya, S., and Usha, G. (2023). A machine learning-based technique with IntelligentWordNet lemmatize for Twitter sentiment analysis. Intelligent Automation & Soft Computing, 36(1).
[20] Patel, R., and Passi, K. (2020). Sentiment analysis on Twitter data of World Cup soccer tournament using machine learning. IoT, 1(2), 218–239. https://doi.org/10.3390/iot1020014.
[21] NITI Aayog. (n.d.). e-AMRIT (Accelerated e-Mobility Revolution for India’s Transportation) portal. Retrieved November 1, 2024, from https://www.e-amrit.niti.gov.in.
Biographies

Madhu Bala Myneni is working as a professor of computer science and engineering at VNR Vignana Jyothi Institute of Engineering and Technology (VNRVJIET), Hyderabad. She received her Ph.D. in Computer Science and Engineering from JNTUH. She has Twenty-one years of academic and research experience. Her research interests are Data Science frameworks, Image Mining, Text mining, Machine learning, Artificial Intelligence, Deep Learning, and Data Analytics. She has published 57 articles in reputed Journals indexed in SCOPUS, SCI, etc. She has published 2 patents. She received a research grant of 50 Lakhs from DST and AICTE. She is the Principal Investigator of a DST-funded sustainable smart city development project. And has received various grants from AICTE for organizing Short Term Training Programs; Infrastructure Development; and Faculty Development Programs. And selected a part of AICTE national mission programs such as Student Learning Outcomes Assessment (SLA); and Technical Book Writing (TBW). She is a reviewer for Elsevier, Springer, and more indexed journals. She acted as session chair, organizing member, and advisory member for various International Conferences. She delivered various invited talks on Data Modelling, Data Science, and Analytics. She is a Life member of professional bodies like CSI, ISTE, IEEE, WIE & International Association IAENG, ICST, and SDIWC.

Haritha Akkineni is an Associate Professor in Information Technology at PVP Siddhartha Institute of Technology, Vijayawada. She earned her Ph.D. in Computer Science and Engineering and has sixteen years of experience in academia and research. Her research interests include Data Science, Opinion Mining, Image Mining, Artificial Intelligence, Data Analytics, Deep Learning, and Machine Learning. She has published approximately 48 papers in reputed journals, including those indexed in SCI, SCOPUS, and UGC. She has authored a book on Opinion Mining and has published three patents, with one of them granted. She has received grants from AICTE to organize Short-Term Training Programs and serves as a reviewer for SCOPUS-indexed journals. Additionally, she has chaired workshops and tutorials at various international conferences and delivered several invited talks.

Cherukuri Kiran Mai, working as Professor in the Department of Computer Science, VNR VJ IET. She has 28 years of teaching, 7 years industry and 10 years of Research experience. She published 46 papers in various reputed National and International journals. She was awarded as “Best teacher in Computer Science” in the year 2010, by the professional body, International Society for Technology in Education (ISTE). She was on the Editorial Board of two Springer series – Learning and Analytics in Intelligent Systems, Machine Learning Technologies and applications during the year 2021 and 2022. The Proceedings of International Conference on Advances in Computer Engineering and Communication Systems, published by Atlantis Press – Springer Nature, Dr. C Kiran Mai was the Chief Editor during the year 2023. She conducted International Conference on Advances in Computer Engineering and Communication Systems (ICACECS) for three consecutive years. Her areas of Interests are communications, Data engineering and Block Chain Technologies.

Sisira Boppana is currently pursuing her Bachelor of Science at NC State University, USA. Her areas of interest are Artificial Intelligence, Pack Robotics and Ariel Robotics.
Journal of Mobile Multimedia, Vol. 20_5, 1067–1088.
doi: 10.13052/jmm1550-4646.2054
© 2024 River Publishers