Crowdsourced Camera Data Fusion for Urban Traffic Estimation and Monitoring
Quang Tran Minh1, 2,*, Do Thanh Thai1, 2, Bui Tien Duc1, 2, 3, Le Thi Bao Thu1, 2, Trong Nhan Phan1, 2 and Phat Nguyen Huu4
1Faculty of Computer Science and Engineering, Ho Chi Minh City University of Technology (HCMUT), 268 Ly Thuong Kiet, District 10, Ho Chi Minh City, Vietnam
2Vietnam National University Ho Chi Minh City (VNU-HCM), Linh Trung Ward, Thu Duc District, Ho Chi Minh City, Vietnam
3Faculty of Information Technology, Nguyen Tat Thanh University (NTTU), Ho Chi Minh City, Vietnam
4Hanoi University of Science and Technology, Hanoi, Vietnam
E-mail: quangtran@hcmut.edu.vn; dtthai.sdh242@hcmut.edu.vn; ducbt@ntt.edu.vn; thule@hcmut.edu.vn; nhanpt@hcmut.edu.vn; phat.nguyenhuu@hust.edu.vn
*Corresponding Author
Received 26 November 2024; Accepted 21 March 2025
Abstract
Data quality is paramount in crowd-sourced traffic information systems where expanding data fusion methods, ensuring accuracy and reliability are essential. Conventional traffic information systems collect data through multiple methods such as web-based forms, speech data, and GPS sensors on mobile devices. This paper enhances these methods by introducing new approaches to traffic data fusion from cameras that leverage existing city surveillance infrastructures to provide a continuous stream of real-time traffic data. We also devise a novel approach for background scheduling to update traffic status predicted from camera-based data applying AI models. These novelties are introduced to combat the current ITS systems’ struggle to maintain continuous flows of user-reported crowd-sourced data. Then we design necessary components to implement background data fetching scheme to insert traffic camera data into a traffic information platform to evaluate the proposed approaches in real-world scenarios. The results revealed the effectiveness and efficiency of the proposed mechanisms showing that they are ready to be applied in real-world applications.
Keywords: Urban traffic estimation, traffic condition, crowd-sourcing, camera data fusion, ITS.
1 Introduction
Data quality is paramount in crowd-sourced traffic information systems [1]. Modern traffic information systems such as UTraffic [2] collect data through application forms, speech data, and GPS sensors on mobile devices. Although, these approaches aim at enhancing the coverage of the ITS systems by leveraging mobile user contributions, there still difficulties need to be resolved to reach a suitable incentive model in recruiting mobile users contribution. Therefore, a mobile crowd-sourcing intelligent transportation system (ITS) such as UTraffic is struggled to maintain a continuous flow of user-generated data. For example, with a limited number of about 350 registered users as of April 2024, the effectiveness of mobile crowd-sourced data remains hindered. The system often has to resort to the base (background) data instead, which is created based on statistical traffic data [3]. This work grouped the base velocity of street segments according to time slots, and a traffic status query will refer to the closest slot to the query time. This data was populated using TomTom [4], and the authoring group managed to make it available to all street segments in Ho Chi Minh City. Obviously, in this approach the real-time traffic information is missed and since the base traffic status was established in 2020, it is greatly prone to being outdated. Meanwhile, updating this background traffic data required a well-design and huge amount of resources which cannot be conducted frequently. On the other hand, there still are various existing crowd-sourced systems such as surveillance cameras where traffic data can be extracted in real-time.
This paper aims at improving the efficiency and feasibility of the aforementioned methods in real-world applications by introducing new approaches to image-based traffic data collection that leverage existing city camera surveillance infrastructures and mobile user contribution. In addition, design and integrating TrafficView function into UTraffic to show and provide real-time traffic conditions from surveillance cameras is a practical requirement. The integration is particularly exciting since it marks a novel approach to UTraffic’s data collection scheme. Unlike traditional methods that rely solely on user input, TrafficView opens the pathway to a constant stream of objective traffic data derived from real-time image analysis utilizing AI techniques. This eliminates the potential of user bias or inconsistency often present in crowd-sourced data. Additionally, TrafficView’s ability to analyze traffic across the entire city, not just user-reported locations, offers a more comprehensive and geographically diverse picture of traffic flow. Moreover, having an on-demand system to analyze images enables us to use user-submitted images as an alternative crowd-sourced data stream.
The camera data can become an extra source of information which UTraffic can deliver to the end users. Moreover, a novel approach for background scheduling to update traffic status predicted from camera-based data applying AI models is devised. This information is not only accurate but is also reliable. By having the means to access and analyze it, the proposed approaches integrated in UTraffic are ready to adapt and extend seamlessly to real-world applications, regardless of how many cameras are installed. The main contributions of this paper can be summarized as follows:
(i) Proposes a novel approach to collect and fuse traffic data from surveillance camera systems which can be extended for collecting traffic data from mobile users’ cameras.
(ii) Devises a background scheduling to update traffic status predicted from camera-based data applying AI techniques.
(iii) Integrate the proposed approaches into a real-world system, namely UTraffic, applied in Ho Chi Minh city, Vietnam. The evaluation results from this system confirm the effectiveness and the efficiency of the proposed mechanisms.
The rest of the paper comes up with a literature review on related work on Section 2. The proposed approaches are presented in details in Section 3. Section 4 describes the implementation and evaluation while Section 5 concludes the paper and draws out future work directions.
2 Related Work
Urban traffic monitoring and forecasting are important issues in the intelligent transportation systems (ITS) field that attract academic and industrial research in the recent years [5]. In order to provide accurate traffic information and appropriate traffic forecasting, traffic related data must be collected accurately and in-time. Conventional approaches rely on road-side fixed sensor systems such as radio frequency identification (RFID) and camera systems to extract traffic data. However, these systems are limited in terms of coverage, deployment and maintenance cost, especially in developing countries where traffic infrastructures have not been developed well to catch up the development requirement.
The advancements of mobile and IoT technologies allow us to utilize crowd-sourcing approaches to traffic data collection from various sources such probe vehicles, mobile users, radio channels, and existing fixed-side systems [6–10]. Delegated mobile applications equipped with GPS module deployed on probe vehicles or carried by mobile users can help for collecting traffic related data such as locations, traffic flow’s velocity, density, estimated travel time, etc. [3]. Studies in CityDrive [11] and GreenDrive [12] introduced mechanisms to collect vehicles’ movements via GPS, then estimate volumes and velocities of traffic flows at particular intersections. These studies reveal the feasibility of providing real-time traffic information and smart driving services using crowd-sourced data. However, there are many issues related to GPS errors and the user willingness in utilizing these systems have not yet been thoroughly analyzed. In addition, these approaches focus on ITS services at small areas, while our work aims at estimating and forecasting traffic conditions in a large urban network, which is much more challenging.
Beside GPS based approaches, mobile users can report traffic condition via application forms or speech reports on mobile apps [3, 13, 14]. Numerous studies have focused on collecting, analyzing, and evaluating traffic status from various sources including mobile applications as well as the surveillance camera systems such as VTIS (Vietnam Traffic Information System) [15] and UTraffic (Urban Traffic Estimation System) [2]. These web-based systems, including a mobile app for Android to collect traffic data from traffic channels like the VOV (The Voice Of Vietnam) on FM91 MHz [15] and the VOH (The Voice of Ho Chi Minh City) on FM95.6 MHz [16]. Mobile users and commuters can report traffic condition they observe by putting the data into the mobile app’s form and send to the server or call to the radio station. In order to enhance the voice traffic data processing, the study in [17] proposes solution to extract traffic data utilizing ASR (Automatic Speech Recognition) mechanisms. The advantage of these approaches is their coverage as mobile users and commuters are available everywhere and face traffic condition in real-time. However, the inherent difficulties in incentive models to encourage users’ willingness in sharing their data and the validity of crowd-source data still remain.
As a solution to the aforementioned difficulties, both the mobile crowd and fixed sensors systems should be utilized for traffic data collection. One of the reliable of traffic data source is the traffic surveillance camera system which is originally deployed for manually monitoring traffic condition. The work in [18] proposed a lightweight method to examine JPEG images from common cameras, where the intensity of change in JPEG image blocks and the block lengths are utilized to estimate vehicle edges and vehicle count which are used to estimate if a road segment is congested or vacant. This approach is computationally efficient. However, it is sensitive to false alarms such as erroneous interpretations of traffic congestions in cases of splashed waters or hails. This limitation can be resolved efficiently by AI methods that learn sophisticated traffic related features from images to identify traffic conditions. In addition, in the AI approaches, more details on traffic conditions such as the level of service (LOS) of a road segment can be identified revealing main differences from our current work compared to the existing ones.
With the development of artificial intelligence, neural network models are widely used in traffic analysis from surveillance video for vehicle detection such as Region-based Convolution Neural Networks (R-CNN) model [19], or the single shot based approaches such as SSD (Single Shot MultiBox Detector) [20], or YOLO (You Only Look Once) [21]. From then, traffic density can be estimated. However, these approaches have not thoroughly analyzed the difficulties and appropriate solutions for collecting traffic data from a large number of cameras to make the solution available in real-world applications. In this current work, we present and analyze techniques to collect camera data, extract traffic data, and then visualize them in the map of large urban traffic network. The proposed approaches are also implemented in mobile and web-based systems for experiments towards real-world applications.
3 Proposed Method
3.1 Designs for a Background Schedule to Update Traffic Status from City Surveillance Cameras
Firstly, this work’s core is extracting traffic data from city’s surveillance cameras whose uptime is excellent, and that the information they portray is highly reliable. In order to reach this objective, we need to determine main components and functionalities that should be integrated into the UTraffic. According to our real-field observation and analysis, when inspecting a road segment, users want to obtain two key pieces of information, which are its traffic flow’s velocity and the source of the report since UTraffic fuses data from various crowd-sources which may reveal the argues on the source reliabilities, as depicted in Figure 1.
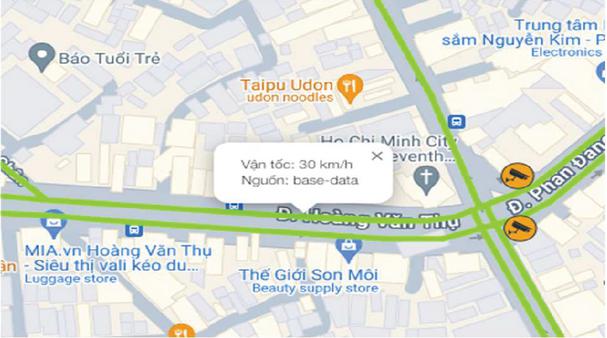
Figure 1 While inspecting a traffic status, the traffic flow’s velocity and the source of the data are shown via a popup, e.g., velocity of 30 km/h and the source of “base-data”.
Obviously, from the camera data we can devise AI-based models for predicting traffic related information such as traffic flow velocity, density, and overall condition based on the level of service (LOS) [22]. The prediction model is briefly illustrated in Figure 2. Images of traffic are extracted from surveillance cameras which are sent to the server where AI/ML models are implemented to predict traffic condition. The resulted traffic information is sent to commuters for their daily activities such as routing for their travel and to the traffic management for policy and decision making. In addition, to train the AI/ML models, we need to prepare training dataset by having volunteers label the images and store them in a database system.
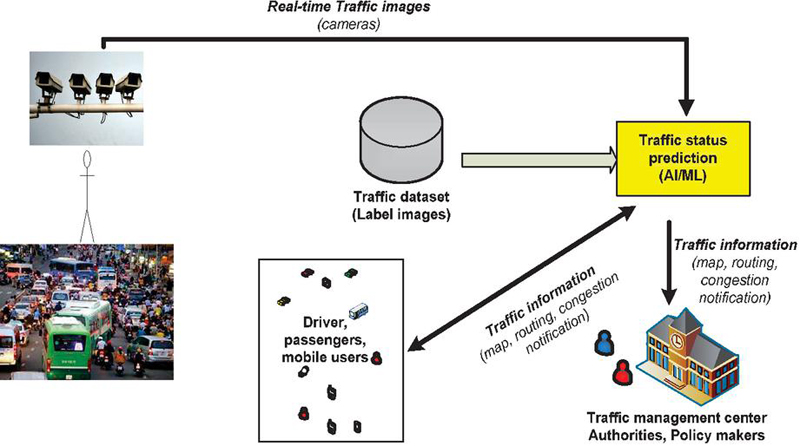
Figure 2 Traffic data collection from cameras and traffic prediction utilizing AI/ML.
This work aims at predicting traffic condition using three indicators: the LOS, density, and traffic flow velocity. Therefore, each image will be labelled according to these classes where LOS is labelled in A, B, C,…, F ranging from the best to the worst traffic condition; Density is labelled in 0, 1, 2, 3, 4 from the best to the worst traffic condition, based on density; and traffic flow velocity is labelled in a real number representing the speed (e.g., 20 km/h) of a traffic flow. Here, the traffic flow velocity is estimated based on the experience of user. For example when the street is free the speed can be 40, 50 or 60 km/h, and the speed at a heavy road could be 15–20 km/h. Then the LOS is labelled based on traffic flow velocity in an urban traffic network as depicted in Figure 3. LOS F, E, D, C, B, A is mapped based on a velocity of less than () 7, 13, 20, 30, 35, 45 km/h and colored from dark red (LoS F) to light green (LOS = A), respectively. It should be noted that we assume that the speed limitation in the urban is 45 km/h which is practical and helps to present LOS A conveniently in a graph as in Figure 3 (actually, LOS A is hold when velocity = 35 km/h without upper bound). Figure 4 illustrates the relationship between the density and the number of normalized motorbikes in an observation area of 1-lane 10 meter. In this work different vehicles are normalized to number of motorbikes as 1 bus = 1 truck = 4 cars = 16 motorbikes. The density Free flow (0), Reasonable free (1), Stable (2), Heavy (3), Congested (4) is defined based on the number of normalized motorbikes on the observation area, which is less than () 4, 9, 14, 20, 30 and colored from light green (Free flow (0)) to dark red (Congested (4)), respectively. It should be noted that the Congested flow is defined when the number of normalized motorbikes is =20. For readability in a graph as shown in Figure 4, we present a virtual upper bound of 30 motorbikes.
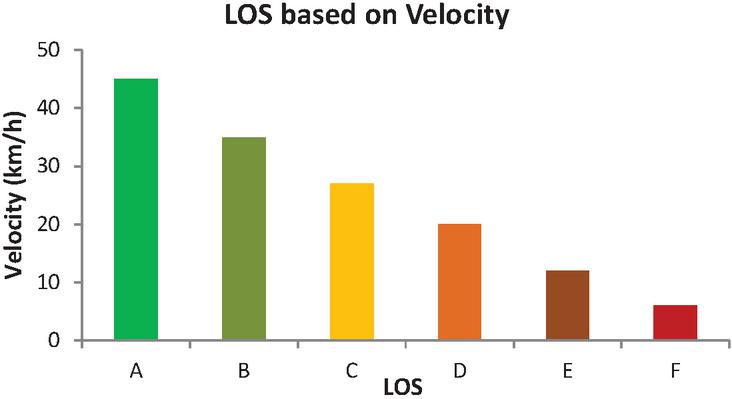
Figure 3 Mapping between urban traffic flow velocity and LOS (Level of Service).
As for the traffic prediction, we have applied various deep learning approaches dedicated to image processing and evaluate their effectiveness to find out the most appropriate one for real-world application. In this work, we have selected 4 modern models for study which are EfficientNet, VGG16, GoogleNet/Inception_v1, and Resnet. The experiment results of these methods are shown in the evaluation section.
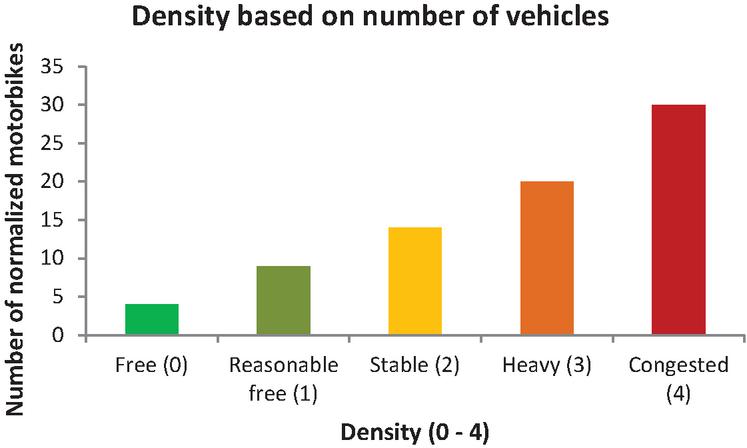
Figure 4 Density based on the number of vehicles (normalized motorbikes).
To integrate this functionality seamlessly into UTraffic while maintaining a lightweight background fetch mechanism, we propose utilizing only the velocity model. This choice aligns with the data visualization approach adopted by UTraffic’s web client, which primarily focuses on displaying real-time traffic flow velocities. With the TrafficView’s velocity model, we can efficiently extract real-time traffic flow data from city traffic cameras. This data can then be mapped to UTraffic’s established conversion logic to generate the necessary density and condition information, streamlining the overall data processing pipeline [3]. This logic maps velocity values to corresponding Levels of Service (LOS), a metric commonly used for characterizing traffic flow quality.
3.2 Inserting Traffic Camera Data Into the Existing System
A critical aspect of this work involves seamlessly integrating traffic camera data into the existing UTraffic system which analyzes traffic from multiple data sources. It is worth noted that hovering over a traffic status polyline the current traffic flow velocity along with its data source provides more information and reliabilities to users. Therefore, we propose incorporating traffic camera data as an additional data source whose level is the same as the original mobile crowd-sourced data. This approach aligns with the established logic of the UTraffic application, eliminating the need to develop entirely new data processing pathways. We ensure compatibility and a smooth integration process by using the existing functionality for displaying velocity data with source attribution.
UTraffic system handles traffic status reports by querying the database system every five minutes to update the main traffic status calculated from traffic reports. If there are new reports for traffic status on a particular road segment, the system creates a new segment status object along with traffic flow velocity and source with an active time of 30 minutes. It then updates the cache with the new traffic status. When a client retrieves traffic status, the system will consult the cache to return appropriate information. If there is no such data, UTraffic will resort to the base (background) data instead. To add the traffic camera status to this flow, we apply AI mechanism to predict traffic flow velocity as depicted in Figure 2, and then reuse the reporting functionality intended for crowd-sourced data, which is already implemented in UTraffic.
After we have categorized the background camera data source, the next step is to decide how this data affects the street segments. The original form-based method receives starting and ending pairs of coordinates so as to determine the correct way of the segment to be updated. Due to most streets being in two ways, this is a necessary approach. However, such directional data is not naturally extractable from a camera image due to following reasons:
• The camera has no knowledge of how the lanes it observes are divided. For example, Figure 5 shows the view at an intersection where the main traffic flow is in two lanes, while a third one is waiting near the right corner, presumably for a red light. The model simply counts the vehicles within the view and generates a prediction for the velocity accordingly.
• The camera only covers a limited field of view depending on the individual camera. Moreover, an angle value exists for some cameras as we inspect the data, but largely vacant otherwise.
This angle could be the value formed by the meridian, going through the center of the camera with the line beginning from its center of view. This value is valuable in pinpointing the segments whose status will be updated by the camera’s prediction outputs. We attempt to visualize this concept as Figure 6 portrays. However, the number of cameras missing this field is accounting for 33% (177 cameras) of the total 537 cameras in the system. Manually labelling this field is an option, but given the time limit, we decided to go against it.
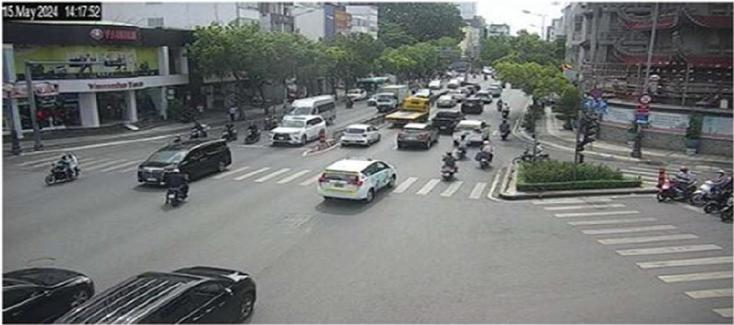
Figure 5 A camera enables the view to an entire street and has no knowledge of the radius it covers or the lanes in view.
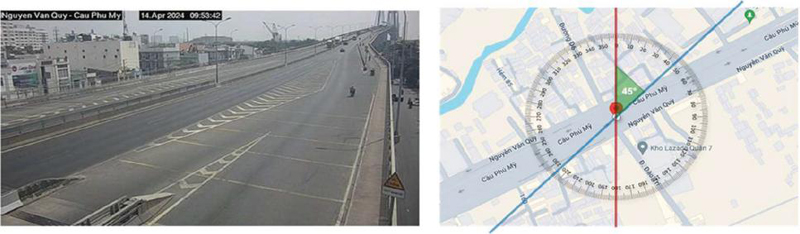
Figure 6 A camera view with an angle value of 45.
To make the integration possible, we decide to accept the cameras’ location themselves as the sole coordinates for the report instead. This also allows us to utilize an existing functionality of the system, which is finding nearby segments of a given pair of coordinates. Building upon the average segment length of 100 meters established in [3], we employ a radius-based approach for segment mapping. For each traffic camera, we consider a 50-meter radius (which is a circle with a 100-meter diameter) around its location. Within this radius, the system identifies the closest 100 street segments. The velocity data extracted from the camera image using the AI model presented in Figure 2 is then used to update the traffic status for each of the identified segments. This approach ensures that the real-time traffic flow information captured by the camera is effectively reflected in UTraffic. The reason for us to accept a maximum of 100 segments is because there are many street segment levels that we need to account for. Having a lower number can accidentally leave out a set of street segments of different levels which can affect the status when viewing the map on different zoom levels.
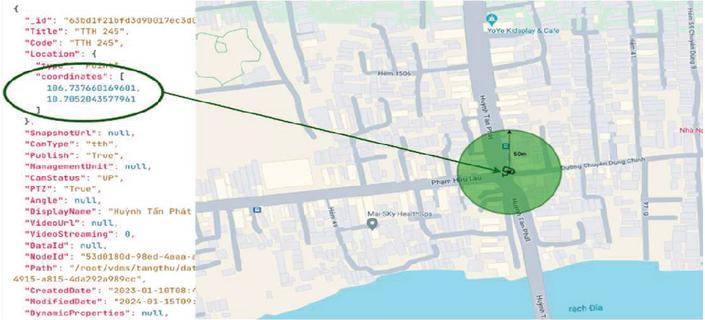
Figure 7 With the camera’s location field, we can determine the segments within a 50-meter radius circle whose center is the camera.
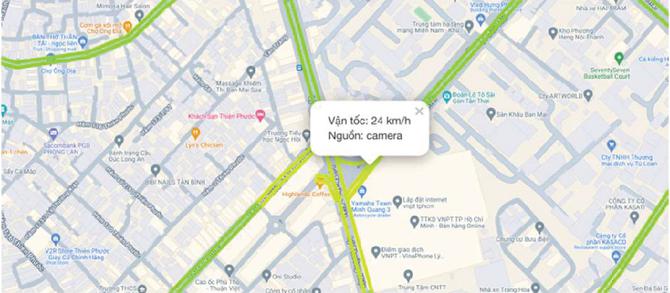
Figure 8 The segments near the district 10 campus of the Ho Chi Minh City University of Technology are updated to have a velocity of 24 km/h and the source of “camera”.
Figure 7 clarifies the method. To test this idea, we sampled four cameras near the district 10 campus of the Ho Chi Minh City University of Technology. For every 5 minutes, a cron job will take the IDs of the cameras, feed them to the prediction model, obtain the result, and submit that to the system as traffic status reports with the source being “camera”. Figure 8 indicates that the segment near one of the sampled cameras have been updated with a data source of the traffic camera instead of the base data.
3.3 Continuous Camera Traffic Data Update in the Entirety of Ho Chi Minh City
After sampling the four cameras around the school campus, it is now our goal to expand the status mapping in a large scale, aiming at applying to the whole Ho Chi Minh City area by fetching data from 403 active cameras. To extend the operation to all the cameras in the city, we perform a query to the camera collection in the database. Those that are active result in an array of cameras. Then, their IDs are extracted, and we process them linearly to make calls to the computing server responsible for predicting the traffic flow velocities. We generate a traffic status report as soon as a velocity value is available, and then we move on to the next. A try-catch block is placed on this to prevent cases where the operation might fail, or if there is no segment to update. Therefore, between two consecutive cameras, the operation for the previous one is guaranteed to terminate before the latter, avoiding cases where a failed update could invalidate all the pending cameras. This also alleviates memory pressure, because the data is written as soon as it is generated without being stored in memory.
Our initial approach to fetching traffic camera data relied on a 5-minute cron job where the backend application calls the update function and performs the mapping. However, considering the extensive camera network in Ho Chi Minh City, this approach presented scalability limitations.
(a) Challenges of fixed-interval fetching With iterative camera processing, assuming a 1-second processing time per camera, fetching data for all cameras would require approximately 403 seconds (403 cameras x 1 second/camera). This exceeds the 5-minute cron job window, resulting in an incomplete data update cycle.
While updates are written as generated, the loop terminates at the 5-minute mark, creating a “dead zone” for unprocessed cameras at the end of the queue, as shown in Figure 9. Restarting the loop before those cameras are visited perpetuates this issue. Extending the cron job interval to 10 minutes would not solve the problem either. Assuming a 2-second processing time per camera, the total processing time would become 806 seconds, again exceeding the update window.
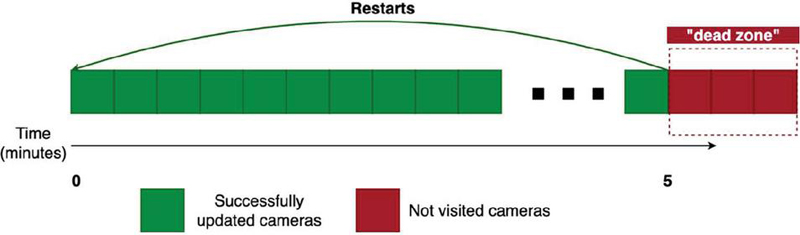
Figure 9 The iterative update of traffic status based on camera and a strict time window reveals a “dead zone” when the loop resets before the cameras in this zone can be visited for traffic data extraction.
(b) A self-calling function for improve efficiency To address these limitations, we re-investigated UTraffic’s reporting logic and found that each segment status report has a 30-minute validity period [3]. When a client requests traffic status via API, the system checks for the validity of traffic status reports that are present for the segments included in the response. If these reports are expired, the system retrieves data from the base source instead. While the system updates its cache every 5 minutes, this action does not invalidate the report yet as it only scans whether new reports are submitted to UTraffic. We do not need to worry that the traffic camera data reports will expire after this 5-minute window, since their validity is not determined by it. As a result, camera data can persist for up to 30 minutes like any other report submitted by mobile users. This characteristic allows us to adopt a new strategy in which the background update function will call itself once it finishes as depicted in Figure 10. This is akin to recursion [23], where a function is applied within its own definition.
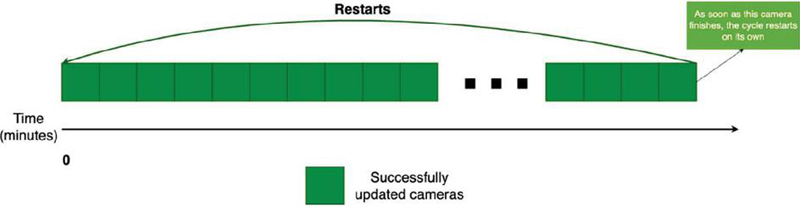
Figure 10 As soon as the last camera finishes with getting its velocity mapped to a traffic status report, the cycle restarts ensuring that all cameras are visited.
The benefits of this self-restarting approach are as follows:
• Complete data fetch: By allowing the fetch loop to finish execution, we eliminate the “dead zone” problem and ensure all camera data is mapped to the traffic status. The timeline introduced when this situation was still present becomes arbitrary.
• Simplicity: The function’s self-restarting nature simplifies implementation, eliminating the need for complex control mechanisms for function calls within the system. This also benefits future development efforts by consolidating logic into a single control flow.
• Reduced hardware load: UTraffic’s hardware limitations necessitate a resource-efficient approach. A fixed-window cron job would require, for example, concurrent requests to the image source server and the TrafficView server to fit all updates within the window. A self-restarting function alleviates this pressure, allowing us to further limit the rate of external server calls by UTraffic. This enhances system reliability and uptime by preventing crashes due to computational overload. Fixed windows introduce unnecessary pressure to complete operations within UTraffic’s hardware constraints.
Moreover, the recursive fashion of the function allows for more fine-grained control over its execution. By programmatically restarting the function within itself, we have the flexibility to schedule data acquisition based on specific timeframes. For instance, during rush hour periods, the data fetch process can be intensified to capture the more rapid changes in traffic flow. Conversely, the function can be programmed to halt data acquisition entirely during night time hours when traffic volumes naturally decline.
(c) Implementing schedules for traffic camera data background fetching The Ho Chi Minh City rush hours set the basis for our schedule. Rush hours for road traffic are from 6:00 to 8:00 in the morning and from 16:00 to 19:00 in the evening, daily [1]. Therefore, we set up the background fetch function to run as follows:
• Rush hours (6:00 – 8:00 and 16:00 – 19:00): The function restarts immediately after a round trip, with no delay between consecutive cameras. Consecutive cameras refer to the consecutive data objects returned by the query which we described earlier.
• Night (23:00 – 6:00): The function is disabled.
• Other times: The function restarts immediately adding a delay of 5000 ms between consecutive cameras.
It should be noted that the delay between consecutive cameras helps to reduce computational cost. During these times, traffic statuses in the traffic network do not change drastically (stable traffic) we do not need to update traffic status frequently. This delay can be identified based on the traffic network size (e.g., the number of cameras, cover areas,…) and traffic characteristics. In this work, this delay is set to 5000 ms (5 s) as it yields about 30 minutes (5 s/camera 403 cameras) to revisit a particular camera which is acceptable as a traffic status report/prediction is valid during 30 minute as discussed above [3].
The schedule is controlled by the function itself with the help of a new cron job. At 6:00 daily, the cron job will start its execution. Then, after the function has completed a round trip, it checks whether the current time is still between the rush hour blocks. If yes, then the function restarts itself or does so with the introduction of the middle delay otherwise. If the time is between the nighttime block, the fetch will skip the recall part completely, and stops its execution. When it gets to 6:00 again the next day, the whole process restarts similarly. The algorithm can be described with the flowchart in Figure 11.
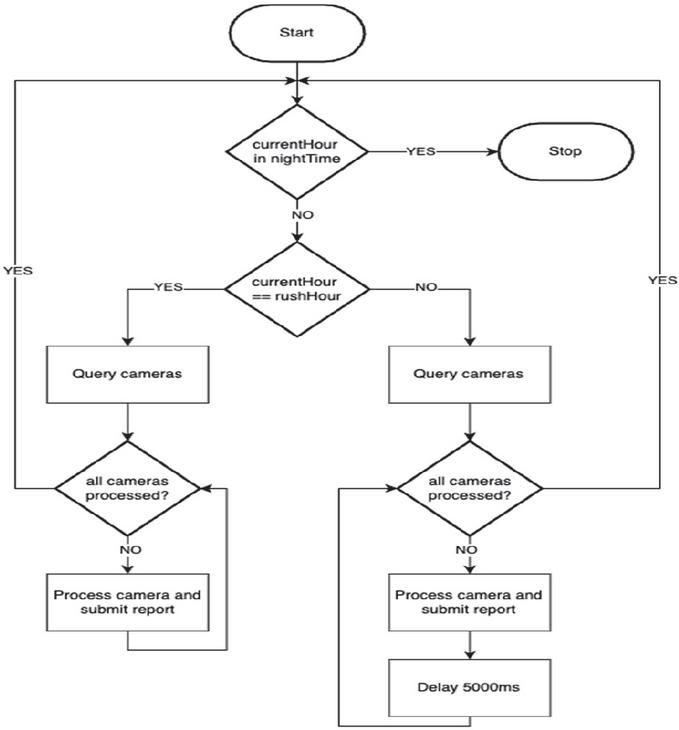
Figure 11 The update schedule starts when the cron job activates it at 6:00 daily, and modify its fetching interval based on different timeframe.
To this point, the automated data acquisition method is complete. Next, we move on to how the study on cameras power user-submitted images as a new source of community data.
3.4 User-submitted Images as Crowd-source Data
TrafficView introduces exciting possibilities for enhancing UTraffic’s data collection through user-submitted images. This functionality allows users to capture real-time traffic conditions directly from their phones and upload them to the system, complementing existing traffic report methods via forms, speech recognition, and GPS sensors. We need to assess the current method for gather crowd-sourced data and then compare that with user-submitted images. Traditionally, reports for traffic are done with a form submission, as seen in Figure 12 with the following fields:
• Starting and ending coordinates: The form accepts two pairs of coordinates in order to determine the correct segment as well as the way traffic is meant to be reported. Since the average segment length is 100 meters [3], the maximum distance allowed between two coordinates is also 100 meters.
• Velocity: The average velocity that the user identifies for the reported location [3].
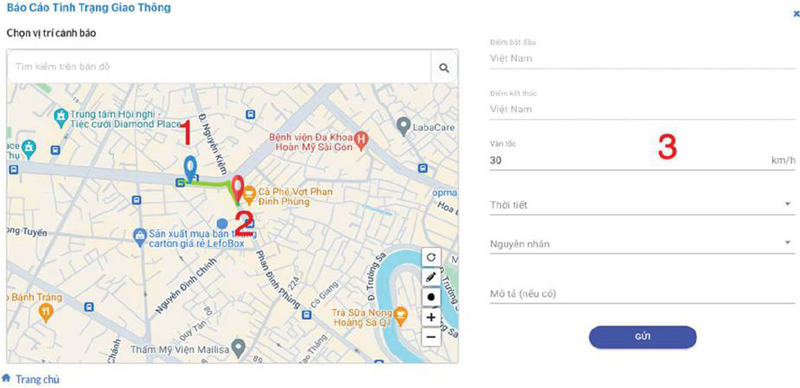
Figure 12 A traffic status report form where mobile user must specify a starting location (1), an ending location (2), and the velocity (3).
Such a form is simple, user intuitive and effective in gathering data. On top of the velocity, they can report about extra details which include the cause of the traffic congestion, the weather condition, and other description if they wish to. However, a form requires manual input and may not be convenient for users to interact with while they are on the move, potentially disrupting traffic themselves.
To make it easier for crowd-sourced data to be gathered, a background fetch using GPS sensors was developed for Android devices [3].
With user-submitted images, we would like to not only introduce a novel method of crowd-sourced data but also resolve the shortcomings of the existing methods as follows:
• Streamlined contribution: Users simply submit a photo taken directly within the application, minimizing steps compared to manual form filling.
• Reduced user ambiguity: The existing methods require the user to specify the velocity values themselves, whose drawback is that the same traffic flow can be identified differently between two separate users. This leads to discrepancies between the actual situation and the report, and consequently loses the submission’s quality.
• Simplified processing: Taking a photo and submitting in requires less processing compared to the audio counterpart [24, 25]. In a traffic congestion environment, for example, the background noise can interfere with the report and require more processing effort to identify correct words. On the other hand, an image is free from such a noise, and the current system can process imagery data right away.
Nonetheless, image submission depends largely on external factors, such as the angle of the situation, lighting conditions, and field-of-view. To solve this issue, the image processing model should be a prime target of improvement in later UTraffic’s development effort. In addition, there exists a small chance of users submitting irrelevant photos. Such an extreme circumstance, while not likely, should not be ignored. In the scope of this work, we do not handle deliberately misleading images, but the following measures are employed to limit such act:
• Not sharing the image publicly: An ideal scenario has the application’s map displaying all the submissions for everyone to view. We do not share this image to prevent unwanted graphics from potentially spreading. Instead, we abstract the submission to a simple marker that tells where the report took place and what velocity was recorded. We do not share the details of the user that shared the image either, providing anonymity. While this could hinder the community’s effort in rating the report, it helps protect the privacy of users, which is now one of the strict requirements for mobile phone applications.
• Limiting the sharable images to the camera: We disable the photo library to ensure that all images taken from the in-app camera, which is the most recent and truly reflect the current traffic state of the reported location.
While the current system discourages irrelevant submissions by disabling camera roll access, further filtering mechanisms are still required to address potential misuse. User-submitted traffic reports via images have a temporary visibility window of 15 minutes. After this period, the status of affected segments reverts to the data obtained from primary sources.
Similar to city traffic cameras, user-submitted images are processed to determine the location and nearby traffic segments. To ensure accurate location data, access to location services is required. This step was done in the on-boarding phase where the app asked the user for certain permissions. Then, users simply capture a photo, which is encoded in Base64 format and sent to the server for analysis. A user may submit an image that is too distant from a segment, for instance. In normal circumstances, this result in a rejected report, but for camera images, we allow the markers representing every report to be visible on the map anyway. The rationale behind this decision is that the base data for segments and traffic status are potentially outdated. Even if a user submits a report on-the-fly, it may not map to any segment that are currently stored in UTraffic’s database. This approach also works for byroads that are too small for the system to account for, or for newly built roads. Overall, user-submitted images, along with the automated schedule, have given UTraffic a lot more flexibility in its effort to gather data to the system.
4 Implementation and Evaluation
4.1 Implementation
We have implemented and integrated the proposed approaches to camera-based traffic extraction and TrafficView functions into the existing UTraffic [2] by deploying a new computing server, named TrafficView. The models are powered by PyTorch, a machine learning library used for computer vision [26] and utilizes Python code, while the API server runs on JavaScript code and is powered by ExpressJS. Since it is not preferable to call Python code directly from JavaScript, we wrap the PyTorch models within a Flask which is a Python web framework that allows developers to build lightweight web applications conveniently. The Flask application is deployed on the same virtual private server (VPS) that is currently used for the API application. As a result, the Flask application is an intermediary that accepts HTTP requests from the API server as a local server within the same VPS environment. The API server then becomes a client itself. The whole process is illustrated in Figure 13.
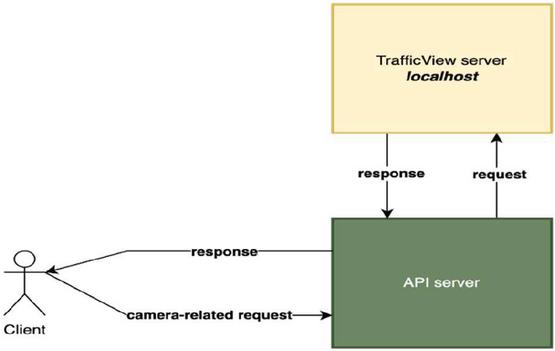
Figure 13 The communication between the servers and the client when it comes to camera-related requests.
This approach is beneficial for the following reasons:
• Reduced costs: by utilizing the existing hardware, we avoid the need of having to rent or set up a new VPS, which is a difficult task on its own.
• Ease of development and maintenance: Both the ExpressJS API application and the TrafficView application is managed by pm2, a daemon process manager capable of quickly starting, stopping, and restarting the applications.
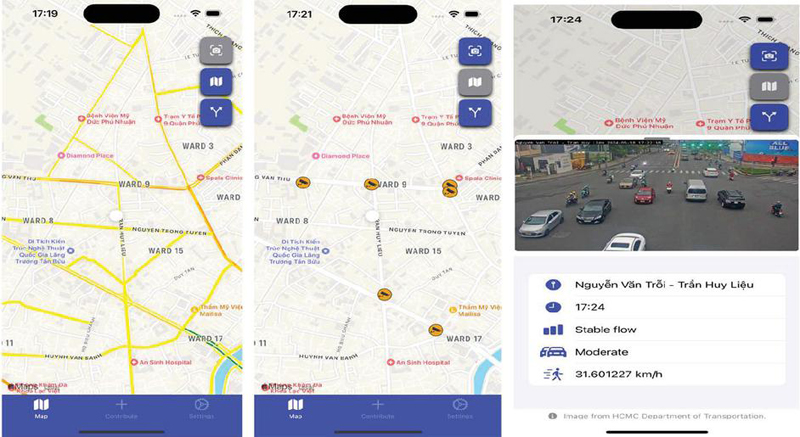
Figure 14 Traffic status view (left), and camera locations (center), and inspecting a camera with moving image and prediction values (right).
On the other hand, the hardware resource, which is quite limited, is now shared between two running processes. We have created a schedule for background traffic fetch to remedy this drawback to an extent, however, future upgrade is necessary. The system would then be scaled vertically by adding more resources.
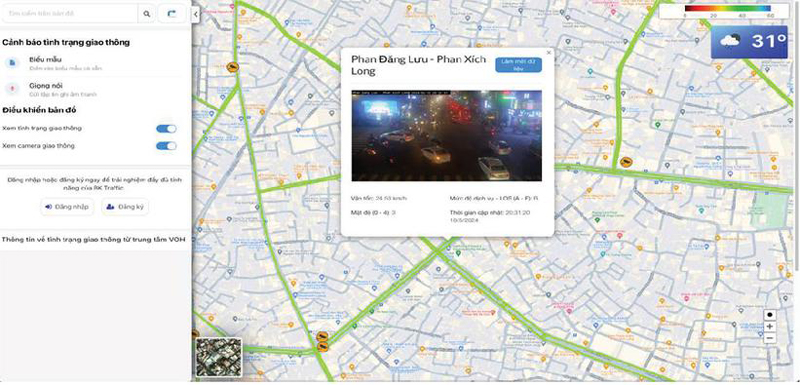
Figure 15 The camera view on the UTraffic web client.
As for the client applications, we have implemented several features supporting mobile users and commuters. Figures 14 shows traffic status view (left) and camera location (center) features, respectively. Traffic statuses are displayed using appropriate colors corresponding to the LOS or velocity predicted from different sources, specifically from surveillance cameras. Tapping on an existing camera marker triggers a modal bottom sheet, which is a draggle user interface component showing the scene of the traffic and the predicted traffic flow velocity as shown in Figure 14 (right). In addition, we developed the UTraffic web client alongside the mobile application to enhance the user accessibility and experiences as shown in Figure 15.
4.2 Evaluation
Firstly, we evaluate the 4 deep learning (DL) models selected in Section 3, namely the EfficientNet, VGG16, GoogleNet/Inception_v1, and the Resnet18 to study the potential of applying the available pre-training DL models into real-world applications and find the most suitable one in our proposed ITS approaches. As focusing on estimating traffic condition based on LOS, we have prepared 3230 figures about traffic conditions labelled as LOS A, B, C, D, E, F and used for tuning (re-train) and testing (in a portion of 80:20) the aforementioned models.
For the tuning approach, we keep the architectures of the selected pre-trained models unchanged and fine-tune all layers (the backbone and the classifier) of the models. The hyperparameter optimization is described as follows:
• Optimizer: SGD
• Batch size: 32
• Learning rate (lr): initial 0.01, degrading by scheduler (StepLR) where lr reduces after 8 epochs with a changing rate of gamma 0.1.
• Momentum: 0.9
• Weight decay (L2 regularization): 0.003
• Loss function: CrossEntropyLoss
• Epochs:30
It should be noted that the original dataset used in the pretrained models is IMAGENET1K_V1 which consists of 1.28 million images for training, 50 thousand images for testing and 100 thousand ones for evaluation. These images contain 1000 classes/objects. As discussed, we used 3230 images about traffic conditions classified in 6 LOS classes (A, B, C, D, E, F) to tune the models and modify the classifier (the fully connected layer of the network) of each model. For example the classifier for the EfficientNet is as follows.
model.classifier = nn.Sequential(nn.Dropout(0.2, True), nn.Linear(1280, number_class)
Here, the classifier consists of 6 nodes (equal to the number of LOS classes) and the previous hidden layer consists of 1280 nodes (see the last line).
In order to avoid potential overfitting, we applied a random drop out of 20% (0.2 in the 2nd line) nodes in the hidden layer. These tunings were conducted in a GPU device with the following configuration.
• GPU RTX3060
• CUDA Cores: 3584
• Tensor Cores: 112 (3rd generation)
• RT Cores: 28 (2nd generation)
• Base Clock: 1320 MHz, and Boost Clock: 1777 MHz
The efficiencies and computation time of the selected models are presented in Table 1.
Table 1 Efficiency and computation time of selected AI models for LOS classification from traffic images
| Model | Accuracy | Precision | Recall | Training Time (s) |
| EfficientNet B0 | 0.69 | 0.68 | 0.68 | 926 |
| VGG16 | 0.7 | 0.69 | 0.7 | 1609 |
| GoogleNet/Inception_v1 | 0.67 | 0.66 | 0.67 | 912 |
| Resnet18 | 0.71 | 0.71 | 0.71 | 872 |
The table shows that among the 4 models, Restnet18 is prominent in terms of efficiencies (accuracy, precision, recall) and the computation time (which is the lowest which is 872s to train the model). Based on this result, we suppose that Resnet18 is suitable for real-world applications. Its efficiencies can be improved when re-trained with richer datasets for traffic condition.
Secondly, we evaluated the efficiency of the proposed approaches in terms of response time of main functions, required memory (RAM), system’s fault tolerance with large numbers of concurrent requests under limited cloud resources, and energy consumption using the prototyping integrated into UTraffic. The device used in these evaluations is an iPhone 11 Pro with the following related specification: iOS 16.4; RAM: 4GB LPDDR4; System chip: Apple A13 Bionic APL1W85 (7 nm); Processor: Hexa-core, 2650 MHz, Lightning and Thunder, 64-bit; GPU: Apple-designed 4 core.
Firstly, we measured the execution time of main UTraffic iOS features in Table 2. The table reveals that most of the main functionalities responses in less than a half of second, while the longest delay time is for drawing camera image with predictions in modal bottom sheet which takes 684 ms which is short enough.
Table 2 Execution time measurements for UTraffic iOS
| Event | Execution time (ms) |
| App launch | 440.54 |
| Map view’s first appearance | 291.57 |
| Drawing traffic status for 200 segments | 328 |
| Drawing traffic status for 500 segments | 417 |
| Routing with a 2km distance (from 2 to 4 intersections) | 287 |
| Routing with a 4km distance (from 3 to 6 intersections) | 379 |
| Drawing 10 cameras markers on the map | 132 |
| Drawing camera image with predictions in modal bottom sheet | 684 |
Table 3 Peak RAM usage recorded for various UTraffic iOS tasks
| Event/Task | Memory Usage (MB) |
| Device idle | 133.24 |
| Drawing traffic status for 200 segments | 145.77 |
| Drawing traffic status for 500 segments | 168.06 |
| Routing with a 2km distance (2 to 4 intersections) | 162.65 |
| Routing with a 4km distance (3 to 6 intersections) | 171.78 |
| Drawing 10 cameras markers on the map | 158.50 |
| Drawing 30 cameras markers on the map | 221.65 |
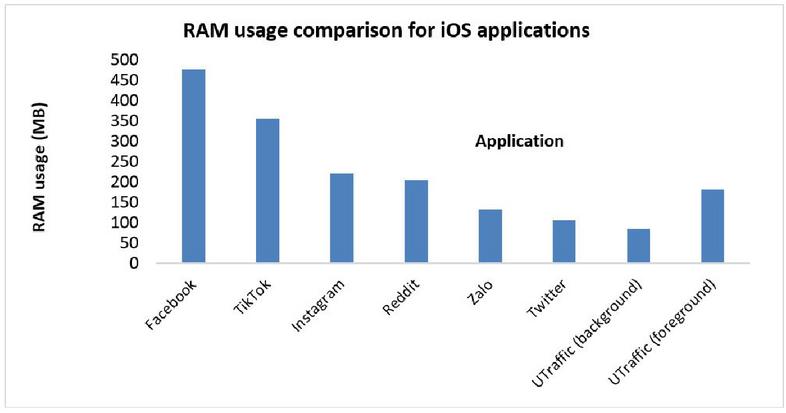
Figure 16 The UTraffic’s background and foreground RAM consumption compared to other mobile applications on iOS.
In addition to response times, the memory (RAM) usage of the mobile application to confirm its runtime efficiency was evaluated as shown Table 3. Here, the most RAM consumption is to draw 30 camera makers on the traffic map which is 221.65 MB, while the application averages at 181.7225 MB under continuous execution. In addition, RAM consumed by UTraffic is less than the average value from off-the-shelf mobile apps as it consumes 85 MB and 182 MB in the background and the active modes, which are much smaller than RAM consumed (on average 250 MB) by off-the-shelf mobile apps as detailed in Figure 16.
Energy consumption – one of the most important indicator for sustainable computing – of Utraffic mobile app was also evaluated. This indicator does not only show how the application drains the battery (a limited resource) but also the heat of the device while operating. We consulted the device’s battery usage levels to compare it with other running applications. In this evaluation, Utraffic has worked on active mode for 45 minutes and 22 minutes in background mode taking 1 hour and 7 minutes in total, but the system was not able to account any battery percentage that UTraffic consumes on the iOS device in a 24-hour cycle. Meanwhile, other applications such as App Store, Messenger accounted 1% and 2% battery usage, respectively. It means that UTraffic is efficient in term of battery usage compared to off-the-shelf mobile applications. The system fault tolerance was also evaluated under a large number of concurrent requests to the server using MonkeyRuner [27]. The results revealed that the proposed mobile app (UTraffic) passed 50,000 concurrent requests satisfying our design purpose. The experimental results from the real-world deployed system presented above have strongly confirmed the feasibility, effectiveness and the efficiency of the proposed approaches, which are ready for practical applications.
5 Conclusion
This paper proposed a novel approach to urban traffic data collection where surveillance cameras are utilized as an important source for traffic information. Various approaches have been devised to fuse camera data efficiently and apply AI mechanisms to predict traffic flow velocity. A prototype of the proposed approaches has been implemented in mobile and web-based systems. The experimental results strongly confirmed the efficiency of the proposed approaches.
However there are still essential limitations that need to be thoroughly investigated to improve the performance of the proposed approaches. Among them, image dataset should be improved to enrich the fine-tuning capability and improve the models’ efficiencies even they are applied in chaos and dynamic traffic environments such as traffic detection in the night time, in different weather conditions (such as with rains, fogs,…) and so on. In addition, multimodal AI approaches applied to camera, voice and other data formats such as those from social networks should be investigated to enhance the capability of the proposed approaches in resolving the ITS’s real-world challenges. Thorough evaluations in larger scale should be conducted to validate the scalability of the proposed approaches.
In the future, we will conduct further research on encouraging mobile users to contribute real traffic data to complement with the camera data for traffic analysis. In addition, designing voice traffic data reports and traffic speech notification are potential research directions. Furthermore, we also focus on machine learning methods for traffic forecast and optimization such as routing, personalized traffic information searching, and smart parking.
Acknowledgement
This research is funded by Vietnam National University Ho Chi Minh City (VNU-HCM) under grand number DS2024-20-01.
References
[1] M. T Ha, P. N. Hoang-Nam, N. X. Long, T. M. Quang, “Mining Urban Traffic Condition From Crowd-Sourced Data,” SN COMPUT. SCI. vol 1 (225), 2020, (16 pages).
[2] UTraffic - urban traffic information system “https://bktraffic.com/utraffic/”, accessed Feb. 2025.
[3] T. M. Quang, N. H. Phat, T. Tsuchiya, “Mobile Crowd-sourced Data Fusion and Urban Traffic Estimation,” Journal of Mobile Multimedia, vol. 18(4), 2022, pp. 1035–1062.
[4] TomTom, “Introduction TrafficAPI TomTom Developer Portal,” https://developer.tomtom.com/traffic-api/documentation/product-information/introduction, accessed Feb. 2025.
[5] A. Essien, I. Petrounias, P. Sampaio and S. Sampaio, “Improving Urban Traffic Speed Prediction Using Data Source Fusion and Deep Learning,” IEEE International Conference on Big Data and Smart Computing (BigComp), 2019, Kyoto, Japan, pp. 1–8.
[6] R. Sciberras and F. Inguanez, “Road traffic flow estimation via public IP cameras,” IEEE 8th International Conference on Consumer Electronics, 2018, Berlin, Germany, pp. 1–5.
[7] J. Steenbruggen, M.T. Borzacchiello, P. Nijkamp, H. Scholten, “Mobile phone data from GSM networks for traffic parameter and urban spatial pattern assessment: A review of applications and opportunities,” Geojournal, vol. 78, pp. 1–21, 2013.
[8] University of Maryland Transportation Studies Center, “Final evaluation report for the CAPITAL-ITS operational test and demonstration program”, University of Maryland, US, 1997.
[9] H. Bar-Gera, “Evaluation of a cellular phone-based system for measurements of traffic speeds and travel times: A case study from Israel,” Transportation Research Part C: Emerging Technologies, vol. 15(6), 2017, pp. 380–391.
[10] Mobile Millennium, UC Berkeley, “http://traffic.berkeley.edu/project,” accessed Feb. 2025.
[11] Y. Zhao, Y. Zhang, T. Yu, T. Liu, X. Wang, X. Tian, and X. Liu, “City-drive: A map-generating and speed-optimizing driving system,” INFOCOM, Toronto, Canada, 2014, pp. 1986–1994.
[12] Y. Zhao, S. Li, S. Hu, L. Su, S. Yao, H. Shao, H. Wang, and T. Ab-delzaher, “Greendrive: A smartphone-based intelligent speed adaptation system with real-time trafiic signal prediction,” ACM/IEEE 8th International Conference on Cyber-Physical Systems, Pittsburgh, PA, USA, 2017, pp. 229–238.
[13] T.M. Quang, D.P. Tan, H.N.L. Hoang, M.N. Nhat, “Effective traffic routing for urban transportation capacity and safety enhancement,” IATSS Research, vol. 46(4), 2022, pp. 574–585.
[14] Q. T. Minh and P. N. Huu, “Crowd Sourced Data Organization and Analytics for Urban Traffic Estimation,” IEEE International Conference on Data Analytics for Business and Industry (ICDABI), Bahrain, 2021, pp. 90–94.
[15] VTIS Homepage, https://vtis.vn/, accessed Feb. 2025.
[16] The Voice of Ho Chi Minh City (VoH), “Urban traffic channel FM 95.6 MHz,” http://voh.com.vn, accessed Feb. 2025.
[17] N. T. Ty, Q. T. Minh, “Research and Develop Solutions to Traffic Data Collection Based on Voice Techniques”, Intelligence of Things: Technologies and Applications, Lecture Notes on Data Engineering and Communications Technologies, vol. 187. Springer, Cham, 2023, pp. 70–80.
[18] Y. Wiseman, “Real-time monitoring of traffic congestions,” IEEE International Conference on Electro Information Technology (EIT), Lincoln, NE, USA, 2017, pp. 501–505.
[19] Arinaldi, A., Pradana, J. A., Gurusinga, A. A.: “Detection and classification of vehicles for traffic video analytics,” Procedia Computer Science, vol. 144, 2018, pp. 259–268.
[20] Liu, W., Anguelov, D., Erhan, D., Szegedy, C., Reed, S., Fu, C.-Y., Berg, A. C.: “SSD: Single Shot MultiBox Detector,” Springer International Publishing, 2016, pp. 21–37.
[21] Redmon, J., Divvala, S., Girshick, R., Farhadi, A.: “You only look once: Unified, real-time object detection,”. IEEE Conference on Computer Vision and Pattern Recognition (CVPR), Las Vegas, NV, USA 2016, pp. 779–788.
[22] H. M. Tan, H. N. P. Nguyen, N. H. Phat, T.M. Quang, “Traffic Condition Estimation Based on Historical Data Analysis,” the 8th International conference on communications and electronics, Phu Quoc, Vietnam, 2021, pp. 256–261.
[23] R. L. Causey, “Logic, sets, and recursion,” Sudbury, Massachusetts: Jones and Bartlett Publishers, 2006.
[24] UTraffic – Voice data contribution, “https://bktraffic.com/home/collect-data”, accessed Feb. 2025.
[25] Dolby, “Introduction to Media APIs,” https://docs.dolby.io/media-apis/docs/introduction-to-media-processing, accessed Feb. 2025.
[26] Pytorch, https://pytorch.org/, accessed Feb. 2025.
[27] MonkeyRunner, https://developer.android.com/studio/test/monkeyrunner, accessed Feb. 2025.
Biographies

Quang Tran Minh is an associate professor at Faculty of Computer Science and Engineering, Hochiminh City University of Technology, Vietnam and a visiting researcher at Shibaura Institute of Technology, Tokyo, Japan. He has been a researcher at Network Design Department, KDDI Research Inc., Japan (2014–2015) and a researcher at Principles of Informatics Research Division, National Institute of Informatics (NII), Japan (2012–2014). His research interests include mobile and ubiquitous computing, IoT, network design and traffic analysis, disaster recovery systems, data mining, and ITS systems. Prof. Quang received his Ph.D. in Functional Control Systems from Shibaura Institute of Technology. He is a member of IEEE, ACM.

Do Thanh Thai is currently pursuing a Ph.D. degree at the Faculty of Computer Science and Engineering, Ho Chi Minh City University of Technology (HCMUT). His research interests encompass Intelligent Transport Systems (ITS), resource management based on deep reinforcement learning, Transportation Big Data Management, and IoT.

Bui Tien Duc is a lecturer and researcher in the Faculty of Information Technology at Nguyen Tat Thanh University (NTTU), Ho Chi Minh City, Vietnam. His research interests include mobile and edge computing, IoT, network architecture, urban traffic data analysis, image and video processing, data mining, and intelligent transportation systems (ITS). Mr. Duc earned his Master’s degree in Engineering in 2018 from the Ho Chi Minh City University of Technology (HCMUT), located at 268 Ly Thuong Kiet, District 10, Ho Chi Minh City, Vietnam.

Le Thi Bao Thu received her M.S. degree in computer science from the Ho Chi Minh City University of Technology, in 2013. She is currently a lecturer at the Faculty of Computer Science and Engineering, Ho Chi Minh City University of Technology. Her research interest is on data science, including big data, information systems, security and privacy. She currently mainly focuses on artificial intelligence (AI) security and privacy.
Trong Nhan Phan is a lecturer at Faculty of Computer Science and Engineering, Ho Chi Minh City University of Technology, Vietnam. His research interests include distributed systems, management information systems, location-based services, security and privacy, and data analytics. He received his Ph.D. in Computer Science from Johannes Kepler University Linz.

Phat Nguyen Huu received his B.E. (2003), M.S. (2005) degrees in Electronics and Telecommunications at Hanoi University of Science and Technology (HUST), Vietnam, and Ph.D. degree (2012) in Computer Science at Shibaura Institute of Technology, Japan. Currently, he is a lecturer at the School of Electronics and Telecommunications, HUST Vietnam. His research interests include digital image and video processing, wireless networks, ad hoc and sensor network, and intelligent traffic system (ITS) and internet of things (IoT). He received the best conference paper award in SoftCOM (2011), best student grant award in APNOMS (2011), hisayoshi yanai honorary award by Shibaura Institute of Technology, Japan in 2012.
Journal of Mobile Multimedia, Vol. 21_1, 149–178.
doi: 10.13052/jmm1550-4646.2116
© 2025 River Publishers