Comparison of Network Performance Metrics for Dependable IoT Systems
Rishabh Deo Pandey, Anvita Nandan and Itu Snigdh*
Department of Computer Science and Engineering, Birla Institute of Technology, Mesra, India
E-mail: phdcs10056.19@bitmesra.ac.in; phdcs10066.17@bitmesra.ac.in; itusnigdh@bitmesra.ac.in
*Corresponding Author
Received 29 December 2024; Accepted 03 July 2026
Abstract
With the emergence of IoT, many aspects of our daily life are being transformed. Billions of smart devices are being connected globally to perform efficient decision making for individuals. This increases their requirement to qualify as dependable systems. Thus, the performance of such systems becomes crucial and inherently depends upon the proper functioning of its components and the underlying network. Conventionally network performance has been measured by measuring factors like packet loss, packet delivery ratio, throughput and delay, but these metrics have not provided a satisfactory measure of system dependability. In this contribution, we present analytical formulations that are used to analyze the behavior of the IoT networks, under different types of payloads, such as video, voice and text traffic. We also examine network resilience as an example of FTP (File transfer protocol) and CoAP (Constrained Application Protocol). These measures are systematically correlated with the quality characteristics that have been defined in ISO/IEC 25010, thus providing a cohesive framework of assessing the performance as well as the dependability of an IoT network. The approach suggested gives a greater understanding of those factors that influence the network connectivity and the overall robustness of the system in the case of IoT application.
Keywords: Internet of Things (IoT), functional correctness, availability, responsiveness, reliability, resilience.
1 Introduction
IoT brings together different physical objects, analytics and user interface together with the help of the Internet. To evaluate the performance of an IoT-based system, various characteristics are needed to be taken into consideration for predicting its quality. These characteristics depends upon various parameters such as properties of SUT (System under test), types of protocols used and amount of time to service a request. Using software metrics, we come across numerous measurement techniques to evaluate the dependability performance of a software product. Dependability in software is characterized by specific attributes like availability, safety, security, reliability and resilience [1]. Being a non-functional requirement, dependability for a software focus on the predictability of performance and output besides user satisfaction. Contrarily, in case of hardware systems, it is concerned with successful operations under events of internal and external failure. At times, it is related to the degree of tolerance of a system against inconsistencies. As a study of dependable systems, system failure has been mentioned as a major issue in affecting the system performance [2–4]. In terms of resilience, it is the inability to cope up with any malfunctioning that has occurred in a system. It degrades the quality of performance thereby leading to low-level performance of any system [5, 6]. An IoT system comprises of both the software logic and hardware devices in addition to an underlying network that carries the required decision-making, solely on the basis of collected data. Also, it is constrained by a variety of application protocols, network protocols, and device capabilities with respect to storage and computation. Therefore, a need arises to compute dependability of such systems that intertwine logic, device and network as a whole. It can be ascertained that IoT systems vary from conventional software systems based on:
• Involvement of hardware along with software.
• Large degree of heterogeneity in the technology, devices and protocols used.
• High amount of interoperability among the devices.
Though individual quality metrics such as reliability and availability have been studied in IoT applications [7], there is no consolidated metric to efficiently predict its dependability and quality. We were able to assemble the parameters used for performance analysis and we established that most of the analyzed parameters are either purely network based or application based. For example, studies on distributed systems like cloud, Fog and IoT upholds that systems should remain dependable under attacks, faults and dynamic workloads. However, it is observed that though many literary works focus on fault tolerance or resilience mechanism, they lack a consolidated mapping of techniques, metrics and open challenges spanning infrastructure, platform and application layers [8]. Though literature also mentions the ISO-9126 model [9, 10] with characteristics that map the network performance to the application, its actual implementation and analysis in context of IoT applications needs to be addressed. Acknowledging that software code is usually simple in logic for most IoT applications, with basic decision-making and related actuation, we focus on the network related metrics that impact the software performance as a whole. We propose to correlate the conventional network metrics with IoT applications’ functional correctness (FC), responsiveness, reliability and resilience. We ascertain that software logic has an inherent dependence on the success of IoT application. Thus, the mere observation on network performance in terms of delay and throughput is not sufficient for analysis.
Under the pretext of simplicity of IoT software and the availability of varied protocols, we compute FC, availability, responsiveness, reliability and resilience as a metric to evaluate the underlying enabling network for IoT applications. Ideally, ISO/IEC software quality models (ISO/IEC 250101) include reliability, security maintainability usability and performance-efficiency. Dependability theory typically includes attributes like reliability, availability, safety, maintainability and integrity. The objective is to map considered metrics like FC, availability, reliability, responsiveness and resilience to functional efficiency and fault tolerance as per ISO/IEC 25010 mapping.
Typically, FC has been used as a metric for software systems that relate the input and output behavior of the system. Another terminology that is frequently used is functional appropriateness that ensures whether the intended system meets its purpose, user expectations and needs. It is specifically suited in our case as it ensures correctness even after something goes wrong. Instead of binary correctness, acceptable correctness is proposed and systems may degrade but still remain functionally valid. For example, a video stream drops resolution but still conveys usable information.
The other two metrics that become important in this context are availability and responsiveness of the application that is being analyzed. We also estimate reliability and resilience as important parameters in our case study. System dependability models can be translated into resilience as a form of FC over time. In non-ideal environments such as IoT networks, FC is based on resilience. It means that a network disturbance (packet loss, delay, node failure) does not compromise the FC of the system forever but activates adaptive mechanisms which restore the system’s correct operation. Resilience is an extension of FC, where the system continues to function correctly, adapts to faults, or quickly recovers from faults and dynamic environments.
The protocols that our study considers for analysis are HTTP and CoAP (Constrained Application Protocol), usually adopted for communication by web-based applications. Monitoring applications typically use the same type of applications for analysis of IoT systems. Protocols like MQTT and AMQP are popular IoT protocols, but they feature a publish–subscribe pattern, with broker-based message delivery, adding some other architectural requirements like queueing, buffering and routing by topics. This study, however, aims to assess network-level dependability in the presence of controlled client–server interactions. To allow a fair assessment of the behavior of the protocol without the interference of intermediary-based messaging systems, CoAP is compared to FTP (File transfer protocol)/HTTP for the sake of consistency in the mode of communication. Each traffic type is a different QoS (Quality of Service) requirement, and allows the system behavior to be evaluated under different load types. FTP and CoAP protocols are chosen as representatives of two contrasting communication paradigms (reliable bulk transfer and lightweight constrained communication) to make it possible to perform resilience analysis for various behaviors of the protocols.
In the context of large-scale IoT deployments like Smart City and Industrial IoT (IIoT) there are scalability problems because of the large number of devices, diverse traffic and dynamic network conditions. Lightweight protocols like CoAP increase scalability by minimizing communication overheads but might be less reliable in certain conditions. The findings show that traditional QoS metrics are not enough to describe the behavior of the system when it is scaled up. Rather, the attributes that are important for systems to be dependable become significant: systems outputs do not change meaning, and they do not lose information in the event of a network disruption. This demonstrates the importance of resilience-aware protocol design to ensure dependable operation under real world IoT environment.
2 Literature Review
Relevant literature mentions protocols IEEE 802.15.4 (Zigbee Alliance) and Bluetooth LE (low energy), mainly used by sensors to gather audio data in IoT scenarios. Likewise, FTP suits best when we deal with big data in an IoT environment. A major advantage of FTP is speed, efficiency and security (where login is required). Also, CoAP is an application-level protocol designed by IETF (Internet engineering task force) for web-based applications. It is quite similar to HTTP but is comparatively light weight which makes it ideal for IoT applications. It is well established that CoAP works effectively in an IoT environment with applications running on constrained devices and low bandwidth networks and is therefore considered for our analysis.
Despite significant advances in IoT communication protocols, network optimization techniques, and QoS evaluation methods, assessing the overall dependability of IoT networks remains a challenging research problem. Existing studies predominantly focus on communication efficiency and service quality, whereas comparatively less attention has been devoted to comprehensive dependability evaluation.
Literatures also present ideas for evaluating the performance of IoT applications on the basis of four quality parameters: QoD (Quality of Data), QoI (Quality of Information), QoE (Quality of Experience) and QoC (Quality of Cost) [1]. Simulation tools OMNet++, INET and FloRa framework have been used to study an IoT-based air quality monitoring system. Studies have also been performed for different environments like rural, suburban and urban. Evaluation of performance of CoAP, Observe and CoCoA in [11] has been performed using two different scenarios: single hop GPRS emulated link and multi-hop 60 node IEEE 802.15.4 testbed. Reference [12] highlights congestion control mechanism in case of unreliable transmission in CoAP. It is clearly observed that CoCoA performed better than CoAP which is not effective under congestion and experienced packet loss. Similarly, literatures mention use of Constant Bitrate (CBR) [13] employed in most networks. According to References [14, 15], two test applications have been implemented where latencies induced by different communication protocols were measured with message encodings as well as graphics rendering performance. They also compared the performance of different Web platform implementations. Likewise, a probabilistic resilience approach was defined for handling system failure issues in designing an IoT system [16, 17]. Studies on performance of IoT [18] propose both qualitative as well as quantitative metrics for comparing the middleware solutions [19, 20]. For predicting wireless link quality in an IoT network, machine learning classifier tools like Logistic Regression, Linear Support Vector Machine, Support Vector Machine and Random Forest have also been used [21]. To assess WBAN (Wireless Body Area Networks) and suggest improvement in the performance of such type of networks [22], metrics such as power, accuracy, reliability and scalability have been evaluated for determining the QoS of the system. Performance metric is also computed for CIoT (Cognitive Internet of Things) which mapped IoT with high intelligence [23]. Further, a model for transmission in case of WPSN (Wireless Paging Sensor Networks) based on LoRaWAN (Long Range WAN) has been used to evaluate the quality of transmissions [24]. An efficient way of planning an IoT network have also been discussed with the help of ILP (Integer Linear Program) that involves selecting numbers of gateways along with their locations and their respected transceivers [25], to obtain a low-cost network that justifies QoS in any network. Similar studies are performed by considering different traffic scenarios and different network topologies. Two different metrics namely RSSI (Received Signal Strength Indicator) and ToF (Time of Flight) is used to evaluate the performance with respect to the distance between transmitter and receiver [26].
Most of the works in the literature are devoted to the study of only single aspects like throughput, delay, PDR (Packet Delivery Ratio), RSSI, SDR, energy usage, QoS and QoE. The first type of study focuses on protocol efficiency, and the second type of study on link quality prediction and network optimization using machine learning techniques. Likewise, the concepts of resilience, reliability and fault tolerance are studied in particular application scenarios but without creating a link between their respective concepts and dependability of the network as a whole. Therefore, there is still no single framework that relates traditional network performance metrics to more abstract dependability properties, like FC, availability, responsiveness, reliability and resilience. This gap inspires the current research that seeks a full dependability-oriented assessment framework of IoT networks in different traffic types and communication protocols. Table 1 shows current research done in evaluating the IoT network.
Table 1 Related literature on evaluating IoT networks
| Existing Study Category | Representative Reference | Key Focus |
| Protocol Evaluation | [11, 12, 14, 15] | Performance evaluation of CoAP, observe, CoCoA; latency analysis of communication protocols; protocol efficiency under different traffic conditions |
| QoS/QoE/QoD/QoI Studies | [1, 24] | Evaluation of QoD, QoI, QoE, QoC, SDR, delay, power consumption |
| Machine Learning-Based Prediction | [21–23] | Link quality prediction using RSSI and PDR; WBAN performance enhancement using ML; cognitive IoT performance assessment |
| Resilience and Reliability Studies | [16, 17] | Probabilistic resilience approaches and fault handling in IoT systems |
| Middleware Performance Evaluation | [18–20] | Comparative analysis of IoT middleware platforms using qualitative and quantitative metrics |
| Network Planning and Deployment Optimization | [25, 26] | Gateway placement, transceiver allocation, installation cost reduction, sensor placement optimization |
| Communication Technologies for IoT | IEEE 802.15.4 (Zigbee Alliance), Bluetooth LE, FTP, CoAP | Communication protocols and technologies used in IoT deployments |
3 Metrics Used
3.1 Functional Correctness
In our case, correctness is a metric that applies to the packet delivery mechanism of a network. When related to IoT application, FC [27] becomes imperative of the satisfactory delivery of packets, the acceptability of the data carried by the packets, and then the correctness of the software code. Moreover, this too has to be achieved within the given time constraints of most IoT applications. Pertaining to these facts, we define FC for determining the reliability of a system with respect to the failure rate occurring in that system. Mathematically it is expressed as:
| (1) |
where
= total packets transfer operations occurring in a given time period,
= total no of packet transfer operations that failed during a given time period.
As failure rate is the most important factor for determining FC, and relates differently to different levels of the network protocol stack, we try to obtain FC at different levels, i.e., physical, network and transport. Failure can be evaluated based on various metrics generated by the Netsim simulator for UDP, IP and Zigbee protocols at the respective layers. Failure is expressed at different layers in terms of number of packets errored, discarded and retransmitted at the receiver side. Thus, FC at different levels has been mathematically expressed as:
• At Physical Layer:
| (2) |
• At Transport Layer:
| FC (UDP metric) | (3) | |
| FC (TCP metric) | (6) |
• At Network Layer:
| (7) |
3.2 Availability Metrics
Data availability is the confirmation that data is provided to the user when needed [27]. Consider the case where different sensors are communicating with each other in an IoT environment. Availability can be computed based on number of packets generated and number of packets that collide due to network congestion. To estimate the number of collisions forcing retransmission, we collect the related packet delivery information from a packet trace data sheet using a cisco packet tracer. Mathematically it is expressed as:
| (8) |
3.3 Responsiveness Metrics
Responsiveness refers to the extent to which any system reacts to a particular request during a given time [28]. In case of an IoT network, responsiveness can be obtained from the RTT (Round Trip Time) of any packet. RTT is the time (duration in milliseconds) it takes for a network request to go from source to destination and back. The value of RTT for any request is obtained through the simulation and is used to calculate responsiveness which is expressed as:
| (9) |
where
= round trip time for packet,
= maximum round trip time among all packets.
3.4 Application-Level Metrics
To analyze the performance of any IoT-based system on the application level, we generally use four different parameters as follows:
• Throughput: Rate of successful message delivery over a channel.
• Energy: Amount of energy consumed.
• Delay: Amount of time a bit takes to travel from one endpoint to another endpoint in a communicating network.
• PDR: Ratio of total number of packets received to total number of packets generated in a network.
3.5 Reliability
By the term reliability, we refer to the ability of any system or product to perform its required functionality over a given time period without failing [29]. When we deal with conventional software products, reliability is the probability that the given software product would fulfil its job for a given number of test cases, under ideal scenarios with no occurrence of hardware or software fault variations. To determine reliability, MTBF (Mean Time Between Failure) is used and is defined as the average time between the failures occurring in a system. Mathematically, Reliability and MTBF are calculated by:
| (10) | ||
| (11) |
where
3.6 Resilience
Resilience can be defined as the capability to regain its original or modified functionality after the occurrence of any failure or fault in a system [30]. It serves as an important criterion for designing of an IoT-based system.
4 Methodology
The objective of this study is to evaluate IoT network dependability by integrating traditional QoS metrics with dependability attributes such as FC, reliability, availability, responsiveness and resilience under varying traffic types and protocol conditions. To analyze the performance of an IoT-based system, a model was implemented via NetSim version 11.0.21 as shown in Figure 1. Details are given in Table 2. The model comprises of a hypothetical outlay of four sensors randomly deployed in an area of 500*250 (grid length 500 m and sensor grid length 250 m). Using basic IoT architecture, these four nodes are connected through Zigbee (IEEE 802.15.4) via a gateway to a wireless server with the help of a router and an access point. The nodes are static, and we assume an application between source (sensor id ‘1’) and wireless node (id ‘8’) as the destination for our simulation. The scenario also considers standard environmental conditions of path loss and fading. The path followed by the packet generated by the sensor node follows four connections out of which two are wired and two are wireless. An ad hoc connection exists between the sensor node and gateway (IEEE 802.15.4), while the 6LowPAN gateway, router and access points are connected using wired connections. We illustrate it as such, to imply that the observations of the performance of network parameter are strictly for the wireless connections of two different networks: Wi-Fi (between access point and wireless node 8) and Zigbee (between sensors and gateway).
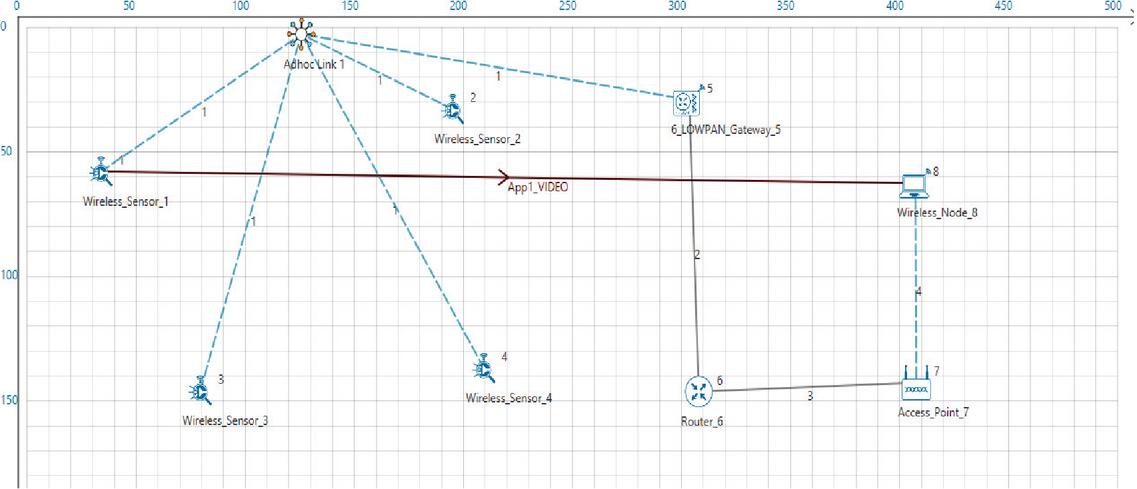
Figure 1 Node and device connections of the considered scenario.
Table 2 Simulation parameters
| Parameter | Value and Variation |
| Node placement | Random, Deterministic, Uniform |
| Initial energy | 6480 nJ |
| Routing protocol | RPL, AODV |
| Transport layer protocols | TCP, UDP |
| Application layer protocol | CoAP, FTP, Voice, Video |
| Networks | Wi-Fi, 6LowPan, Zigbee, Wired |
5 Results
5.1 Functional Correctness
It can be observed from Figure 2 that in case of Video, Voice and FTP applications the value of FC at the physical layer is high. Video and Voice applications are basically multimedia streaming over UDP because fast delivery of data is required. FTP, which operates over TCP, involves simple transfer of multiple files from client to server thereby leading to very less flaws in its functioning. CoAP running over UDP doesn’t include any flow control mechanism which leads to a reduction of data in performance. For the network layer, we obtain an insignificant number of discarded packets which leads to high FC for all applications. This is due to assumption of a noise-free environment where packets do not get corrupted during transmission. At the transport layer, however, FTP exhibits a low value as we observed a large segmentation of the packets and TCP instead of other protocols that used UDP.
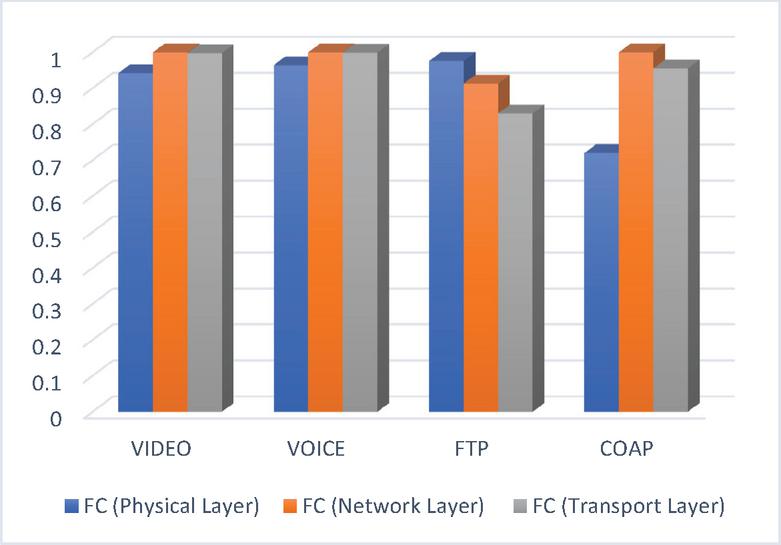
Figure 2 Functional correctness at different layers and protocols.
Table 3 Availability measures obtained for different IoT applications
| Applications | Availability | Responsiveness |
| Video | 0.980 | 57% |
| Voice | 0.877 | 25% |
| FTP | 0.998 | 5% |
| CoAP | 0.814 | 56% |
5.2 Availability
It can be observed in Table 3 that value of availability is least for CoAP. As discussed earlier that availability metric depends upon the number of collisions. Since CoAP works on request–response model, it totally depends upon the ACK message received for successful delivery of packet. There may be chance that for certain packets when CON message is sent by the client, server responds with an empty ACK message which means to resend this message. When the sender gets ready to response the previous request, it sends a CON message to client. Client responds it by sending ACK message to confirm it. Again, the request is retransmitted, and corresponding response will be obtained. This entire process leads to a high number of retransmissions of a packet. This leads to more chances of collision of packets thereby leading to decrease in the availability metric.
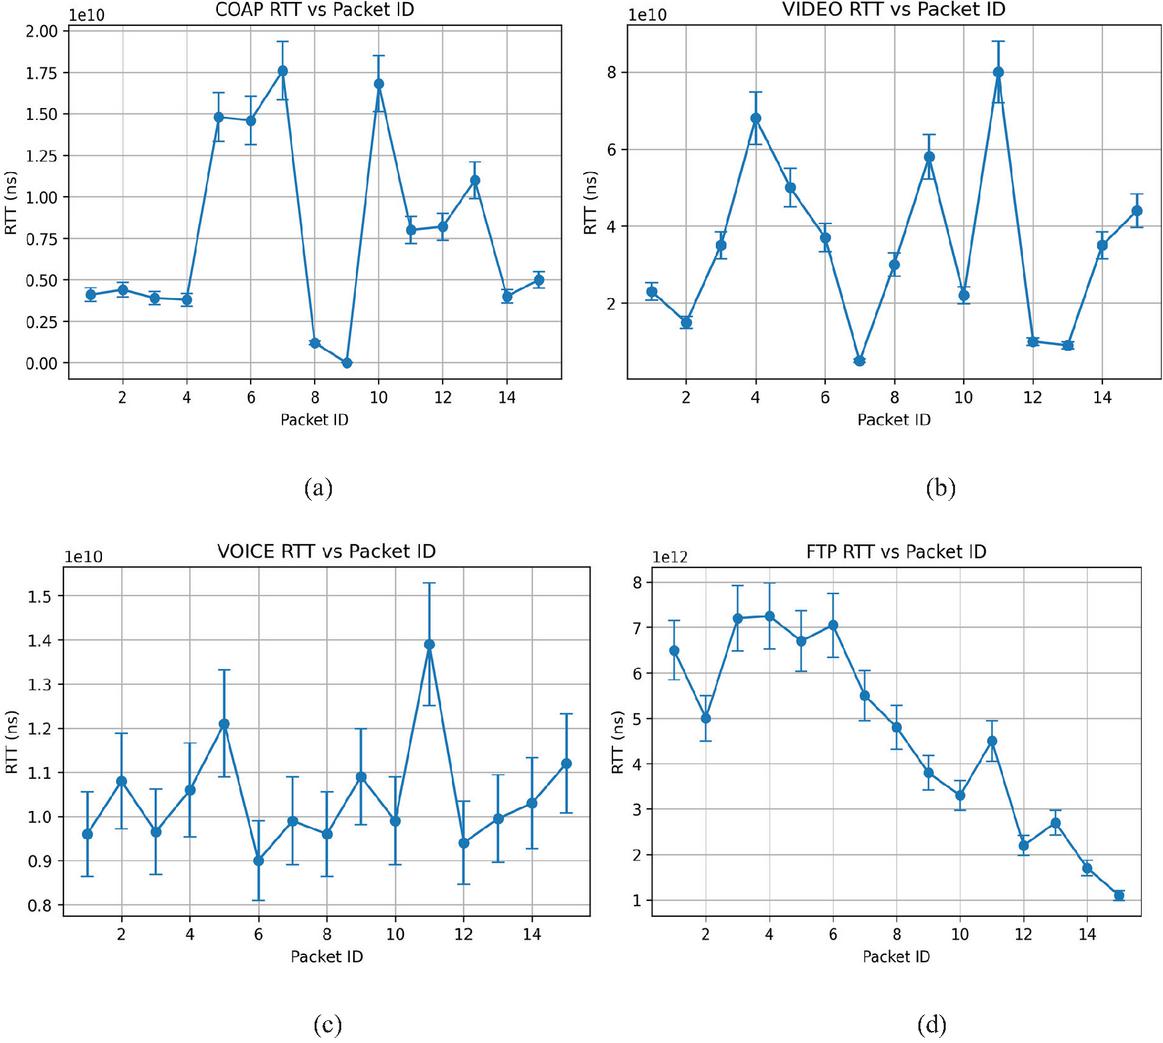
Figure 3 Round-trip time values for different applications (a) CoAP (b) Voice (c) Video (d) FTP.
5.3 Responsiveness
On conducting the simulation for a time interval of 100 ms, large number of packets get generated for Video, CoAP and Voice applications. For FTP, only 16 packets are generated in the given time interval. Therefore, we consider16 packets for observing the responsiveness metric for all the aforementioned applications as depicted in Figure 3.
Table 4 Responsiveness values obtained for different applications
| Application | Responsiveness |
| Video | 57% |
| Voice | 25% |
| FTP | 5% |
| CoAP | 56% |
Responsiveness obtained was least for FTP as shown in Table 4. Responsiveness depends upon the round-trip time taken by a packet. For same number of packets, it was observed that a large number of segments was present for each packet in FTP. This leads to more chances of collision of packets which further leads to unsuccessful transfer of packets. Collided packets need to be retransmitted. This leads to a rapid increase in RTT value for each packet and the least amount of responsiveness.
5.4 Application Metrics
Since CoAP operating over UDP doesn’t provide any flow control technique, it leads to less throughput in a wireless network. Table 5 shows that, due to the generation of a large number of segments for each packet in FTP, chances of collision increase thereby leading to large amount of delay for a packet to reach the destination. Thus, a very low value of PDR is obtained for FTP as compared to other applications. Table 5 represents the application-level metric performances of Video, Voice, CoAP and FTP.
Table 5 Application-level metrics
| Throughput | Energy | Delay | Packet | |
| Application | (in Mbps) | Consumed (in mJ) | (in Microseconds) | Delivery Ratio |
| Video | 0.050933 | 1794.4 | 29835.3 | 0.998 |
| Voice | 0.063946 | 1986.2 | 9066.6 | 0.999 |
| CoAP | 0.000055 | 1187.0 | 7327.9 | 0.934 |
| FTP | 0.005616 | 2490.5 | 14599773.6 | 0.0351 |
5.5 Reliability Metrics
In order to compute reliability and resilience metrics for studying the network performance of an IoT application, link throughput curves provided by the simulator was employed as shown in Figures 4(a)–4(d).
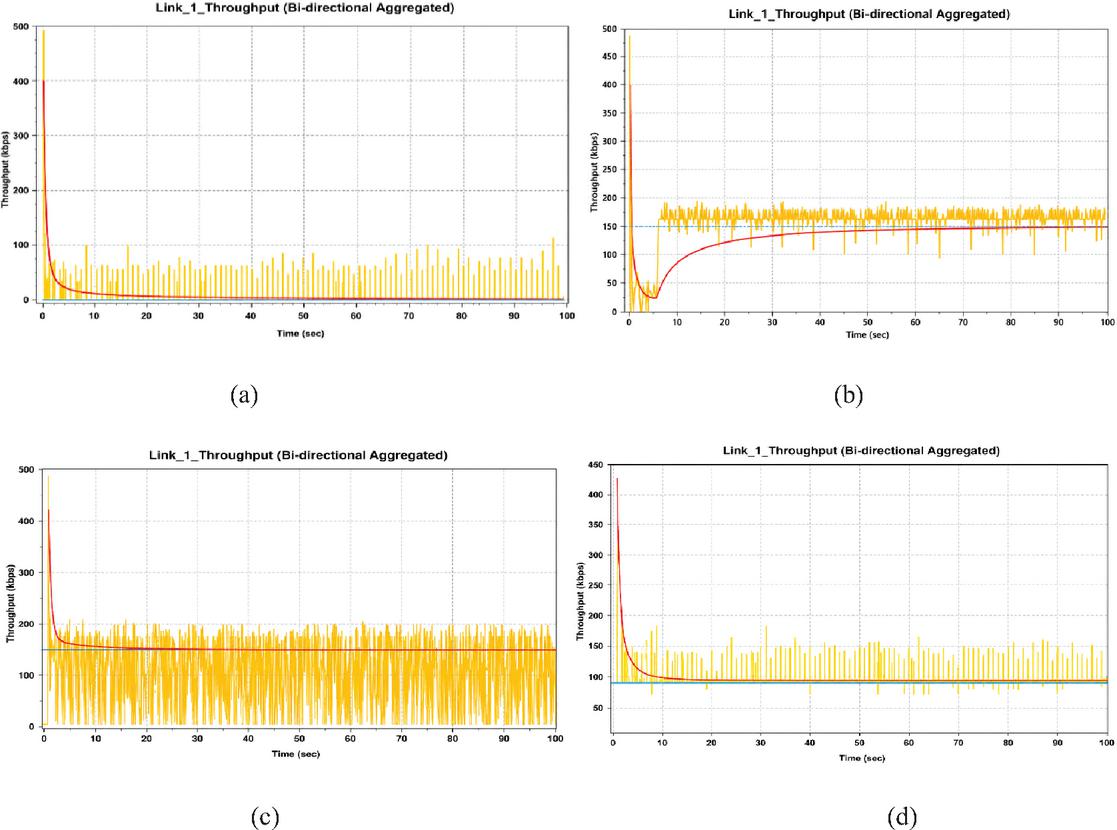
Figure 4 Link throughput graph (a) CoAP (b) FTP (c) Voice (d) video.
Table 6 Reliability metrics for Video, Voice and FTP
| Applications | n (No. of Failures) | T (Communication Time) | MTBF | Reliability |
| Video | 11 | 58 | 5.27 | |
| Voice | 23 | 90 | 3.91 | |
| FTP | 30 | 90 | 3.00 |
Link throughput curves for all four applications were generated for different scenarios. To determine reliability, we compute MTBF with the help of the moving average curve as depicted in Figure 4 (denoted by the red line). In case of Video, Voice and FTP applications the large number of packets are fragmented due to the size and need of streaming purpose. For Video application, we consider discrete time slices for our analysis. The total operating time was split into two categories, namely, network establishment time and time for communication. In our case, we assume negligible network establishment time. Therefore, further computations were carried on the basis of communication time only. The statistics generated after multiple simulation runs are given in Table 6. In case of CoAP application, we compute failure by calculating the average throughput for all the readings. On substituting the values in Equation (14), the readings obtained are mentioned in Table 7 pertaining specifically to CoAP.
| (14) |
Table 7 Reliability metrics for CoAP application
| throughput value for each instance | 6090 kbps |
| Communication time | 90 |
| Average throughput | 67.67 |
| Number of failures | 41 |
| Reliability obtained |
From Tables 6 and 7, we can observe that CoAP has the least reliability value as compared to other applications. For Video, Voice and FTP based applications we usually communicate by sending a large number of packets and they are sent at high frequency. Therefore, in these applications, reliability achieved is higher as a smaller number of failures was observed thereby leading to higher value of MTBF. The reliability obtained for discrete time slices considered from the link throughput graph is depicted in Figure 5.
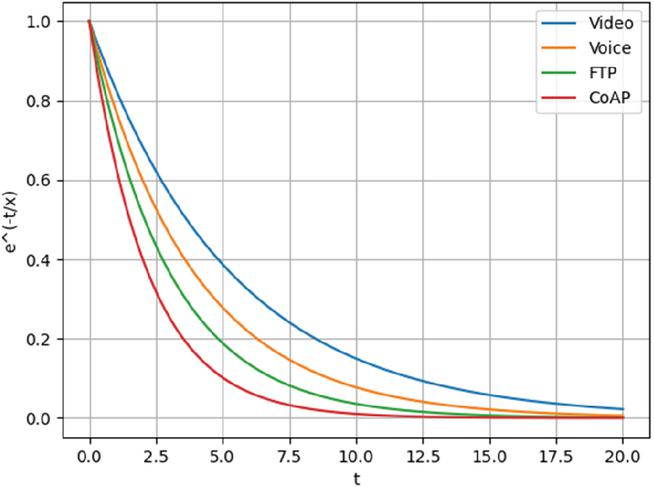
Figure 5 Network reliability obtained for different applications.
5.6 Resilience
Resilience was evaluated using the link throughput graph for the different applications that had been considered for the study. In order to obtain the performance curve from the link throughput graph, random time samples were considered. In order to calculate resilience, we use the system performance curve illustrated in Figure 6.
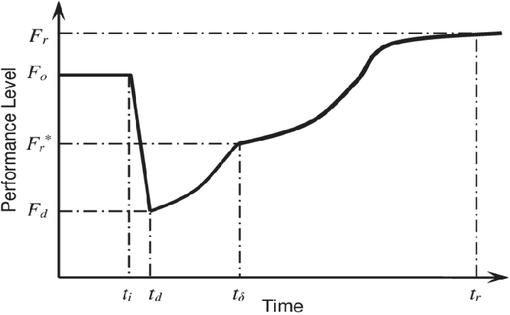
Figure 6 System performance curve (adapted from [32]).
Note: = original stable system performance level. = performance level just after the disruption. = performance level after initial post disruption equlibrium is attained. = performance level of the new stable state after recovery. = time before recovery phase starts. = time to finally recover from disruption.
According to Francis and Bekera [32], resilience can be calculated as:
| (15) |
where = Speed recovery factor obtained from recovery times to new equlibrium .
It can be observed that CoAP is the least resilient as compared to other applications. As mentioned in Table 8, there is a significant amount of difference in the values of and in case of CoAP thereby leading to a low resilience factor. While Table 8 presents the computed resilience metric of the network subject to different requirements of applications, Figures 4(a)–4(d) depict the diagrammatic outlay of the resilience curve obtained under the simulations conducted. These results together present the resilience curve time samples and evaluation which are presented in Table 8.
Table 8 Resilience metric for Video, Voice, CoAP and FTP applications
| CoAP | FTP | Video | Voice | |
| (Time Slice: | (Time Slice: | (Time Slice: | (Time Slice: | |
| 68–74 ms Interval) | 20–30 ms Interval) | 74–83 ms Interval) | 71–81 ms Interval) | |
| 90 | 190 | 185 | 150 | |
| 50 | 120 | 155 | 135 | |
| 100 | 210 | 190 | 155 | |
| 5 | 5 | 5 | 5 | |
| 3.08 | 3.49 | 4.30 | 4.65 |
6 Conclusion
Our article presents six different metrics to enable the estimation and study of network performance. These metrics could be adopted for evaluating dependability of the underlying network. Through our simulation results we depicted behavior of the network under four different applications: Video, Voice, FTP and CoAP. Evaluation of functional correctness (FC), availability, and throughput revealed that CoAP achieved the lowest performance among the protocols. Similarly, among the evaluated protocols, FTP showed the lowest responsiveness and PDR. The results from our analysis clearly depict that the performance of an application in terms of throughput, delay and PDR relate to the FC of the data delivery channel as well as the reliability and resilience of the network. We show that application characteristics and dependability are a reflection of how effectively the network manages to communicate data. This paper depicts an elaboration of how metrics could be applicable and measured using a simulation environment. This work will be extended by implementing the same scenario on a physical model (part of a future study).
References
[1] Amiri, Z., Heidari, A., Navimipour, N.J., and Unal, M., 2023. “Resilient and dependability management in distributed environments: A systematic and comprehensive literature review.” Cluster Computing 26(2):1565–1600.
[2] Verma, N., et al., 2012. “Enabling system-level platform resilience through embedded data-driven inference capabilities in electronic devices.” 2012 IEEE International Conference on Acoustics, Speech and Signal Processing (ICASSP).
[3] Abdallah, R.A., and Shanbhag, N.R., 2013. “Error-resilient systems via statistical signal processing.” SiPS 2013 Proceedings.
[4] Sterbenz, J.P.G., et al., 2010. Resilience and survivability in communication networks: Strategies, principles, and survey of disciplines.” Computer Networks 54(8):1245–1265.
[5] Rohrer, J.P., et al., 2014. “Path diversification for future internet end-to-end resilience and survivability.” Telecommunication Systems 56(1): 49–67.
[6] Lei, J.-J., and Kwon, G.-I., 2010. “Reliable data transmission based on erasure-resilient code in wireless sensor networks.” KSII Transactions on Internet and Information Systems (TIIS) 4(1):62–77.
[7] Pandey, R.D., and Snigdh, I. 2022. Validity as a measure of data quality in Internet of Things systems. Wireless Personal Communications 126(1):933–948.
[8] Amiri, Z., et al., 2023. “Resilient and dependability management in distributed environments: A systematic and comprehensive literature review,” Cluster Computing 26:1565–1600. DOI:10.1007/s10586-022-03738-5.
[9] Moridi, M.A., et al., 2018. “Performance analysis of ZigBee network topologies for underground space monitoring and communication systems.” Tunnelling and Underground Space Technology 71: 201–209.
[10] Leem, L., et al., 2010. “ERSA: Error resilient system architecture for probabilistic applications.” 2010 Design, Automation & Test in Europe Conference & Exhibition.
[11] Betzler, A., et al., 2015. “CoCoA+: An advanced congestion control mechanism for CoAP.” Ad Hoc Networks 33:126–139.
[12] Bormann, C., Castellani, A.P., and Shelby, Z., 2012. “CoAP: An application protocol for billions of tiny internet nodes.” IEEE Internet Computing 16(2):62–67.
[13] Kershaw, S., and Hughes-Jones, R., 2010. “A study of constant bit-rate data transfer over TCP/IP.” Future Generation Computer Systems 26(1):128–134.
[14] Udoh, I.S., and Kotonya, G., 2018. “Developing IoT applications: challenges and frameworks.” IET Cyber-Physical Systems: Theory & Applications 3(2):65–72.
[15] Babovic, Z.B., Protic, J., and Milutinovic, V., 2016. “Web performance evaluation for internet of things applications.” IEEE Access 4:6974–6992.
[16] Shirazi, F., Diaz, C., and Wright, J., 2015. “Towards measuring resilience in anonymous communication networks.” Proceedings of the 14th ACM Workshop on Privacy in the Electronic Society.
[17] Wang, Y., 2016. “System resilience quantification for probabilistic design of Internet-of-Things architecture.” International Design Engineering Technical Conferences and Computers and Information in Engineering Conference.
[18] da Cruz, M.A.A., et al., 2018. “Performance evaluation of IoT middleware.” Journal of Network and Computer Applications 109:53–65.
[19] Vandikas, K., and Tsiatsis, V., 2014. “Performance evaluation of an IoT platform.” 2014 Eighth International Conference on Next Generation.
[20] Dang, T.-B., et al., 2017. “Performance evaluation of an IoT platform.” Proceedings of the Korea Information Processing Society Conference.
[21] Sindjoung, M.L.F., and Minet, P., 2019. “Wireless link quality prediction in IoT networks.” 2019 8th International Conference on Performance Evaluation and Modeling in Wired and Wireless Networks (PEMWN).
[22] Demir, S.M., Al-Turjman, F., and Muhtarolu, A., 2018. “Energy scavenging methods for WBAN applications: A review.” IEEE Sensors Journal 18(16):6477–6488.
[23] Ding, G., et al., 2018. “An amateur drone surveillance system based on the cognitive Internet of Things.” IEEE Communications Magazine 56(1):29–35.
[24] Yang, G., and Liang, H., 2018. “A smart wireless paging sensor network for elderly care application using LoRaWAN.” IEEE Sensors Journal 18(22):9441–9448.
[25] Gravalos, I., et al., 2018. “Efficient network planning for internet of things with QoS constraints.” IEEE Internet of Things Journal 5(5):3823–3836.
[26] Grimaldi, S., et al., 2020. “Onboard Spectral Analysis for Low-Complexity IoT Devices.” IEEE Access 8:43027–43045.
[27] Abdel-Khalek, R., Parikh, R., DeOrio, A., and Bertacco, V., 2011. “Functional correctness for CMP interconnects.” 2011 IEEE 29th International Conference on Computer Design (ICCD) pp. 352–359.
[28] Girão-Silva, R., Martins, L., Gomes, T., Alashaikh, A., and Tipper, D., 2019. Improving network availability – a design perspective. Third International Congress on Information and Communication Technology: ICICT 2018, London (pp. 799–815). Springer Singapore.
[29] Jaffe, J., and Moss, F., 1982. A responsive distributed routing algorithm for computer networks. IEEE Transactions on Communications 30(7):1758–1762.
[30] Xing, L., 2020. Reliability in Internet of Things: Current status and future perspectives. IEEE Internet of Things Journal 7(8):6704–6721.
[31] Berger, C., Eichhammer, P., Reiser, H.P., Domaschka, J., Hauck, F.J., and Habiger, G., 2021. A survey on resilience in the IoT: Taxonomy, classification, and discussion of resilience mechanisms. ACM Computing Surveys (CSUR) 54(7):1–39.
[32] Francis, R., and Bekera, B., 2014. “A metric and frameworks for resilience analysis of engineered and infrastructure systems.” Reliability Engineering & System Safety 121:90-103.
Biographies

Rishabh Deo Pandey is currently working as an Assistant Professor in the Centre for Artificial Intelligence at Madhav Institute of Technology and Science (MITS) Gwalior, India. He completed his Ph.D. under the supervision of Itu Snigdh from Department of Computer Science & Engineering, Birla Institute of Technology, Mesra, Ranchi, in the field of IoT. He received his M.Tech degree in Computer Science & Engineering from BIT Mesra in 2019 and B.Tech. degree in Computer Science & Engineering from Shaheed Bhagat Singh State Technical Campus, Ferozepur, Punjab, in 2016. His areas of interest include probabilistic modelling in AI, IoT, and software metrics.

Anvita Nandan is currently working as an Assistant Professor in Department of Computer Science & Engineering, Birla Institute of Technology, Patna Campus, India. She completed her Ph.D. under the supervision of Itu Snigdh from Department of Computer Science & Engineering, Birla Institute of Technology, Mesra, Ranchi, in the field of Wireless Sensor Networks. She received her M.Tech. degree in Computer Science & Engineering from BIT Mesra in 2015 and B.Tech. degree in Computer Science & Engineering from Rajasthan Technical University, Kota, in 2011. Her areas of interest include WSN and Artificial Intelligence.

Itu Snigdh is currently working as an Associate Professor in the Department of CSE, BIT Mesra, India, and received her Ph.D. in the area of Wireless Sensor Networks in 2016. She has her master’s degree in Software Engineering from B.I.T. Mesra. She received her bachelor’s degree in Electrical Engineering from B.I.T. Sindri in 2000. She has been with the department of CSE for 24 years and specializes in Database Management System, Internet of Things, Artificial Intelligence, and Cloud Computing. Her research interests lie in the field of cyber physical systems and sensor networks. She has authored and coauthored several journal articles, book chapters, and conference papers in this domain. She is also associated with projects on Explainable AI and worked on EMI-EMC compliance of wearable IoT devices.
Journal of Mobile Multimedia, Vol. 22_4, 453–474
doi: 10.13052/jmm1550-4646.2242
© 2026 River Publishers