Efficient Multispectral Image Communication Using Compressed Sensing
Arti Kumari* and Sanjeet Kumar
Department of Electronics and Communication Engineering, Birla Institute of Technology, Mesra, Ranchi, Jharkhand, India
E-mail: phdec10004.20@bitmesra.ac.in; sanjeet@bitmesra.ac.in
*Corresponding Author
Received 17 January 2025; Accepted 03 May 2026
Abstract
This paper explores a joint method for efficient compression as well as the reliable transmission of images. In image transmission, low dormancy and very fast data transmission are the main requirements of modern wireless communications systems. Efficient and reliable image transmission through wireless networks need to handle several challenges like adverse wireless channel conditions, the need for high power consumption, managing high computational complexity, and low error resilience capability of image compression schemes. This paper deals with the compressed sensing approach in combination with orthogonal frequency division multiplexing (OFDM) to take care of the above challenges. There are three important steps in compressive sensing: sparse signal representation, measurement collection, and sparse recovery. In this process, a measurement matrix is utilized to sample those elements which are significant for accurately depicting the signal in the measurement step. So, the design of precise measurement matrices is crucial for compressive sensing. This paper proposes a Lanczos measurement matrix which significantly improves the quality of the reconstructed image with minimum data. At the same time, the use of OFDM handles multipath fading channels for reliable transmission of the image data. The simulation results also compare the performance of several measurement matrices in terms of image quality through peak signal-to-noise ratio (PSNR) value, the structural similarity index, and the Bit Error Rate (BER) for transmission performance after passing through Additive White Gaussian Noise (AWGN) as well as multipath channels.
Keywords: Compressed sensing, image communication, multispectral images, peak signal to noise ratio.
1 Introduction
The transmission of high-dimensional data, such as multispectral images, continues to be a challenging endeavor. The constraints imposed by limited bandwidth and the unreliable nature of wireless channels necessitate innovative approaches to ensure efficient and reliable transmission. Compressed Sensing (CS) has emerged as a transformative paradigm that holds promise for overcoming these challenges by enabling the reconstruction of sparse signals from significantly fewer measurements than traditional methods. Multispectral imaging, with its ability to capture and process information across various wavelengths, finds applications in diverse fields, including remote sensing, healthcare, and environmental monitoring. However, the sheer volume of data generated by multispectral sensors demands careful consideration of bandwidth utilization and robust transmission strategies. CS, with its ability to exploit the inherent sparsity of many natural signals, offers an intriguing solution to address these issues. At the core of the CS framework lies the design and selection of measurement matrices, pivotal components that influence the efficacy of signal reconstruction. The choice of measurement matrices plays a crucial role in determining the accuracy of reconstructed images of the recovery process. Therefore, understanding the performance characteristics of different measurement matrices is paramount for optimizing the efficiency and reliability of multispectral image transmission through wireless channels. This paper delves into the realm of performance evaluation of measurement matrices in the context of CS for multispectral image transmission. By systematically assessing various types of measurement matrices under diverse wireless channel conditions, we aim to provide insights into their impact on reconstruction accuracy. The outcomes of this evaluation are expected to contribute valuable guidelines for designing efficient and reliable wireless communication systems tailored to the unique requirements of multispectral imaging applications. Through this research, we endeavor to advance the state-of-the-art in wireless transmission of multispectral images, fostering progress in fields where high-dimensional data transfer is pivotal for informed decision-making and analysis. This manuscript presents an innovative method that focuses on achieving efficient and reliable compression and reconstruction for multispectral images through the application of CS principles. In the realm of imaging technologies, Multispectral Imagery (MSI) plays a crucial role in capturing information across various wavelengths. The conventional methods of compression and reconstruction for MSI often encounter challenges related to data fidelity and efficiency. This paper introduces a novel approach that harnesses the power of CS to address these challenges. MSI exhibits sparsity in an approximate dictionary domain, a novel CS technique has gained widespread use for MSI compression reconstruction [1, 4, 10, 11]. While Multispectral Imagery-Compressive Sensing(MSI-CS) methods offer significant relief to computational workloads in imaging, storage, and transmission, accurately reconstructing the original MSI from a few compressed measurements remains challenging due to the inherently ill-posed nature of MSI-CS reconstruction. To address this, regularization methods are commonly employed [2, 3, 5, 6]. These approaches incorporate an observation model and regularization technique within a variational framework, utilizing prior knowledge extracted from the original MSI [1, 4]. An efficient approach entails encoding the sparsity prior of MSI using a provided dictionary (either analytical or learned), [7, 8, 9, 10] thereby transforming MSI-CS reconstruction into an optimization challenge with a sparsity constraint[12, 14, 15, 18, 19]. Several methods have been suggested, including Li et al.’s examination of the sparsity of the abundance matrix [13] and Lu et al.’s utilization of a reweighted Laplace before exploring structural sparsity. Additionally, Low-rank matrix approximation techniques have been widely employed for MSI-CS reconstruction to investigate inherent spectral correlations [16, 17], Golbabaee and Vandergheynst[22] presented a method that employs low-rank and joint-sparse modeling for this objective. However, Transforming the 3-D multispectral image cube into a matrix with these methods may potentially compromise spatial-spectral information, resulting in suboptimal reconstruction, particularly at low compression rates [19]. To preserve the original structure of the multi-spectral image, tensor decomposition methods consider a multi-spectral image as a three-order tensor, offering effective solutions for MSI-CS reconstruction [20, 12, 21, 22]. Based on several literatures, we still feel that by integrating CS into the compression and reconstruction processes for MSI, we can aim to significantly enhance efficiency without compromising the reliability of the reconstructed data. This innovation holds promise for diverse applications, ranging from remote sensing to medical imaging, where the need for accurate and efficient multispectral image processing is paramount.
The contributions of this article are outlined as follows.
• We propose an MSI-CS framework for highly reliable and efficient compression and reconstruction for multispectral images.
• To construct an optimal measurement matrix based on the Lanczos algorithm for improving the performance of the CS method.
• Comprehensive experimental results are conducted to showcase the superiority of the proposed Lanczos algorithm over numerous state-of-the-art MSI-CS reconstruction methods, exhibiting advantages in both objective metrics and visual quality assessments.
• An orthogonal frequency division multiplexing (OFDM) based CS model has been proposed for the reliable communication of compressed images through a multipath wireless channel.
The rest of this article is structured as follows. Section 2 presents the background analysis of multispectral images, compressed sensing, and related communication systems. Section 3 describes the proposed measurement matrix based on the Lanczos method. Section 4 presents the proposed transmission model for multispectral images. Section 5 discusses the results and discussion, and Section 6 concludes the manuscript.
2 Background Analysis
2.1 Multispectral Image
A multispectral image is a type of image that captures information at multiple spectral bands across the electromagnetic spectrum. Each spectral band represents a specific range of wavelengths. The information captured in different bands can be combined to provide insights into various properties of the imaged scene, such as vegetation health, land use, or geological features.
A multispectral image can be represented mathematically as a set of functions, where each function corresponds to a specific spectral band. The general form of a multispectral image can be expressed as ), where I is the intensity or pixel value at spatial coordinates and represents the wavelength or spectral band [23, 24, 25, 26].
For example, a three-band multispectral image with the red, green, and blue bands represented by , and respectively. The combination of these bands can be expressed as:
| (1) |
The specific mathematical expressions for , and would depend on the characteristics you want in the multispectral image. These expressions can involve various mathematical functions, such as trigonometric functions, exponentials, or other transformations, depending on the desired patterns or features to be highlighted in each spectral band. However, employing these sparse-based mosaic samples enables the reconstruction of a full-color image through interpolation or demosaicing processes [33]. Conversely, raw Bayer color filter mosaic images can be digitally derived from any multispectral images by utilizing downsampling operations [34].
2.2 MSI-Compressive Sensing
According to the theory of CS , Images may often be represented sparsely in certain transform domains, enabling precise reconstruction with fewer measurements than prescribed by the Nyquist sampling theorem [27, 28, 29, 30]. In MSI-Compressed Sensing, considering an MSI I with two spatial dimensions (where each band’s size is ) and one spectral dimension (with a total of ), a set of linear measurements can be obtained via the following random linear projection:
| (2) |
where is a measurement matrix. This manuscript used the Lanczos measurement matrix to measure the signal [10, 12].
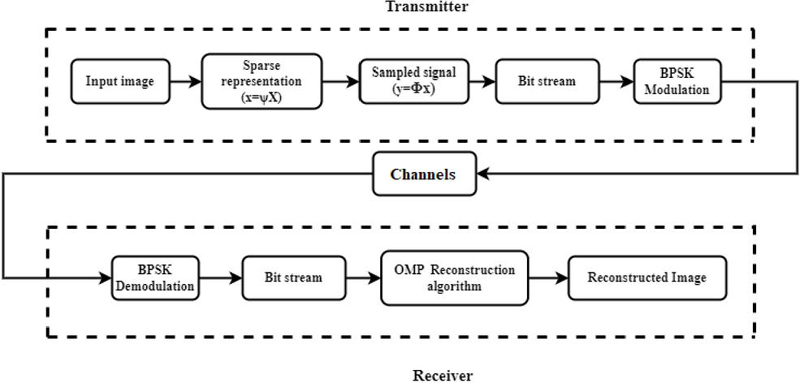
Figure 1 Block diagram of compressed image communication based on compressed sensing over wireless channels.
2.3 MSI-Compressive Sensing Image Communication
In this subsection, we describe the Proposed Communication Model based on CS over wireless channels is shown in Figure 1, and the comparison performance of different channels discussed in the result and discussion section. A block diagram for the proposed model based on OFDM transmitter and receiver has been shown in Figure 2. This innovative design smoothly fits into an entire communication setup. Currently, five different types of input images of size and also satellite images have been taken to evaluate the communication performance. First of all, these images are processed using a CS scheme and then it is communicated over the wireless channels. The quality of reconstructed images is evaluated using four distinct image quality assessment measures: peak signal-to-noise ratio (PSNR) and Structural Similarity Index (SSIM). PSNR compares the luminance values of corresponding pixel coefficients in the original and reconstructed images, measuring the disparity as an indicator of image quality. However, PSNR does not align perfectly with human visual perception [12]. Hence, alongside PSNR, another commonly employed metric, SSIM, is utilized. SSIM examines the structural vector components of the image, offering a more human-centric evaluation of visual quality. By considering both PSNR and SSIM, the assessment aims to provide a more comprehensive understanding of image transmission quality.
| Algorithm 1 Proposed lanczos measurements matrix. |
| Input: Signal dimension N Number of measurements M Random starting vector Output: Measurement matrix Step 1: Generate Hermitian matrix A Generate a Hermitian matrix A of size . Normalize A so that its largest eigenvalue is 1. Step 2: Initialization Initialize the random vector Step 3: Lanczos Iterations Initialize an empty list w to store the Lanczos vectors. Initialize = 0. for i = 1:M = A = = - = = end Step 4: Construct Measurement Matrix Initialize an empty matrix . for i = 1:M Get the ith eigenvector from V. Append as a row to . Step 5: Normalize the Measurement Matrix for i = 1 : M Normalize the ith row of Phi to have a unit norm. Return: Measurement matrix Phi |
3 Proposed Measurement Matrix Based on Lanczos Method
The Lanczos method is an iterative numerical method used for solving eigenvalue problems, particularly for large symmetric matrices. It’s named after Cornelius Lanczos, who developed the method in the 1950s. The method is primarily used to find a few eigenvalues and corresponding eigenvectors of a symmetric matrix [31, 32, 33, 34]. The Lanczos method is especially well-suited for large sparse matrices, which are common in many scientific and engineering applications. It’s an efficient way to approximate a few eigenvalues without explicitly calculating all of them, which can be computationally expensive for large matrices. It is used in the context of solving linear systems of equations and optimization problems. We generate a measurement matrix based on the Lanczos algorithm which is shown in Algorithm 1 and the Hermination matrix which creates a matrix that is used in CS applications. In CS, one aims to recover a sparse or compressible signal from a small number of measurements. The measurement matrix plays a crucial role in this process. The Lanczos algorithm is used to iteratively diagonalize a Hermitian matrix. The initial vector for the algorithm is selected uniformly at random from the set , where N is the size of the matrix. This means that each component of the initial vector is independently sampled from a uniform distribution.
we generate a Herniation matrix A of size NN. A Hermitian matrix, also known as a self-adjoint matrix, is a square matrix that is equal to its conjugate transpose. Mathematically, a Hermitian matrix A of size N×N satisfies the property: A where denotes the conjugate transpose (also known as the adjoint) of matrix A. In simpler terms, for a Hermitian matrix: N is the number of iterations.
a. Compute the first Lanczos iteration:
-
b. Continue the Lanczos iterations: For
;
Then construct the measurement matrix using the N eigenvectors:
At the final step, we Normalize each row of the measurement matrix to have unit norm:
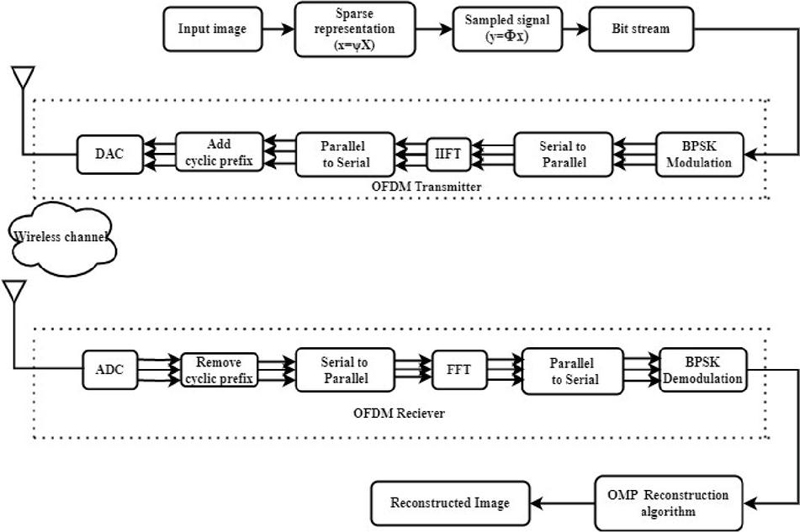
Figure 2 Flow chart of the proposed method.
Table 1 Simulation system parameters
| Sl. No. | Simulation Parameters | Values |
| 1 | Delay Taps | 2 |
| 2 | n Taps | 2 |
| 3 | Modulation | BPSK |
| 4 | Ncp | 2 |
| 5 | Channel | Rayleigh fading |
4 Proposed Transmission Model For Multispectral Image
The combination of CS and the transmission system using a wireless channel is depicted in Figure 2, and Table 1 shows the simulation system parameters. The compressed data are first encoded into a binary bit stream on the transmitter side. This bit stream is modulated using Binary Phase Shift Keying (BPSK) modulation with dimension N and is denoted by the signal vector . The resulting data are then sent to the Inverse Fast Fourier Transform (IFFT) section. The IFFT converts the frequency-domain signal into a time-domain signal, which is suitable for transmission through the wireless communication channel. This process follows in the Equation (3).
| (3) |
where G is a discrete Fourier transform (DFT) matrix, and it has (m, n) element which is introduced by the Equation (4).
| (4) |
The obtained time domain OFDM signal is . After that, a cyclic prefix is introduced to avoid interference between symbols. After that, the signal goes via the power amplifier before being transmitted over the channel. When the acquired signal’s cyclic prefix is eliminated from the side of the receiver, the noisy signal can be represented as
| (5) |
where is the discrete impulse response of the wireless frequency selective channel, and represents the fading channel noise. In this investigation, the decoded Binary Phase Shift Keying (BPSK) symbol stream is converted into a bit stream and subjected to inverse quantization processing. BPSK is a digital modulation technique in which binary data are represented using two different phase states of the carrier signal. The resulting real-valued signal is then recovered using the Orthogonal Matching Pursuit (OMP) algorithm. OMP is a sparse signal reconstruction algorithm commonly used in CS to recover the original signal from compressed measurements. The recovered data are used as the image data, and finally, the images are reconstructed. The PSNR and Bit Error Rate (BER) performances are analyzed for the proposed CS-OFDM system.
5 Results and Discussion
In this section, we present the results of two proposed models for efficient and reliable image reconstruction under various channel conditions, particularly focusing on multispectral images. The objective is to demonstrate the effectiveness of the CS method for MSI-CS reconstruction, as well as the performance of the system under different wireless communication channels using OFDM. The performance of the model was evaluated using satellite images, such as the Lonar Lake image from India, captured on two different dates: 6th October 2020 and 30th July 2020. These images were chosen to test the model’s ability to handle satellite imagery tasks such as denoising, enhancement, and super-resolution. Additionally, standard images such as Lena, Cameraman, Barbara, Couple, and Man were used to assess the reconstruction performance, which is a common practice in image processing research. Reconstruction quality was measured using both objective and subjective metrics. The objective metrics include Peak Signal to Noise Ratio, Mean Squared Error, and Structural Similarity Index, which evaluate the similarity between the reconstructed and original images. For subjective quality, visual assessment of the reconstructed images was performed. The Lanczos measurement matrix was used for image sampling in the sparse domain, and the Orthogonal Matching Pursuit algorithm was applied for reconstruction. Figure 3(a) presents the PSNR and SSIM values for different compression ratios applied to multispectral satellite images. Satellite image 1 achieved a PSNR of 21.5818 dB and SSIM of 0.7611, while satellite image 2 showed a higher PSNR of 29.3260 dB and SSIM of 0.9167, indicating better reconstruction quality for image 2. Figure 3(b) visualizes the reconstruction quality of the blue band of satellite image 1, showing how compression affects the radiance layer reconstruction, with higher compression ratios leading to a decrease in PSNR. Table 2 summarizes the reconstruction quality of multispectral images at varying compression ratios. For Satellite Image-1, at CR 0.5, the PSNR is 21.1539 dB, while at CR 0.9, it increases to 26.3710 dB. Similarly, for Satellite Image 2, at CR 0.5, PSNR is 20.2032 dB, and at CR 0.9, it improves to 30.8547 dB. These results highlight the effectiveness of higher compression ratios in improving image quality, as reflected in the higher PSNR and SSIM values.
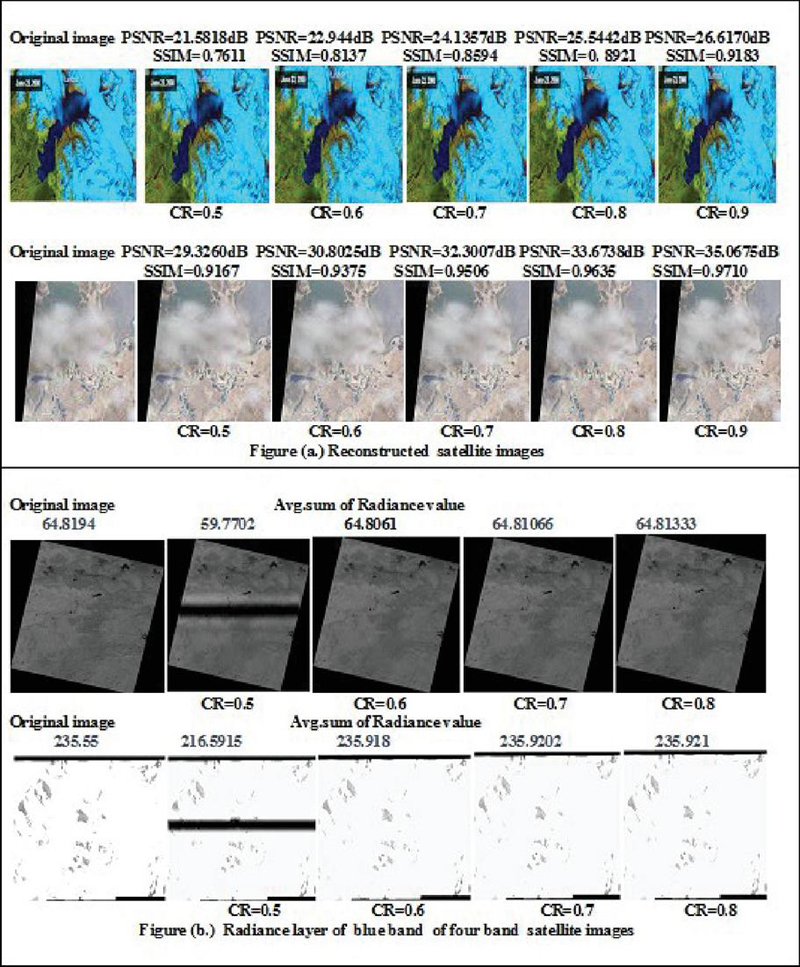
Figure 3 Visual comparison of the reconstruction quality of the Satellite images for different compression ratios. (a) Reconstruction quality of satellite image1 (IOW – Alaska Glacier Left Slider) and satellite image2(izb-low-052022-0-10.tif). (b) Presents the sum of Radiance value of the reconstructed four bands images based on blue band.
The reconstruction quality of different images, including the Lena image, is evaluated using the PSNR, a metric that quantifies image fidelity by comparing the reconstructed image to the original. Figures 4(a) and 4(b) highlight that the quality of the reconstructed Lena image improves as the compression ratio (CR) increases, which is typical for compression methods. Specifically, the Lanczos measurement matrix outperforms other matrices, yielding better image reconstruction at various compression levels. For example, with a compression ratio of 0.2, the reconstructed Lena image achieves a PSNR of 28.46 dB, while at a higher compression ratio of 0.9, the PSNR increases to 42.73 dB, indicating high image quality. Figure 5(a) displays the reconstructed Cameraman images using the DCT at various compression ratios. The results demonstrate that as the compression ratio increases, the reconstruction quality improves, showing better performance compared to the reference methods. This indicates that DCT efficiently preserves image quality even with higher compression. Further experiments with datasets like
Table 2 Comparison of PSNR (dB), SSIM, and radiance values for reconstructed images using the compressed sensing method under different compression ratios
| Four Bands Images | ||||||||
| CR | Satellite Image-I | Satellite Image-II | ||||||
| PSNR | SSIM | Radiance Value | Radiance Avg. | PSNR | SSIM | Radiance Value | Radiance Avg. | |
| 0.5 | 21.1539 | 0.8735 | 3917106 | 59.7702 | 20.2032 | 0.7955 | 14436934 | 216.59 |
| 0.6 | 23.0928 | 0.8945 | 4247432 | 64.8061 | 27.9958 | 0.8921 | 15460072 | 235.91 |
| 0.7 | 24.0407 | 0.9001 | 4247393 | 64.8061 | 29.1269 | 0.9131 | 15461172 | 235.92 |
| 0.8 | 24.2415 | 0.9039 | 4247607 | 64.81066 | 30.2878 | 0.9397 | 15464654 | 235.92 |
| 0.9 | 26.3710 | 0.9106 | 4247971 | 64.8133 | 30.8547 | 0.9492 | 15474705 | 235.921 |
| Note: Satellite Image-I: liss3 all bands.tif Satellite Image-II: 20040916_4300020002.tif |
||||||||
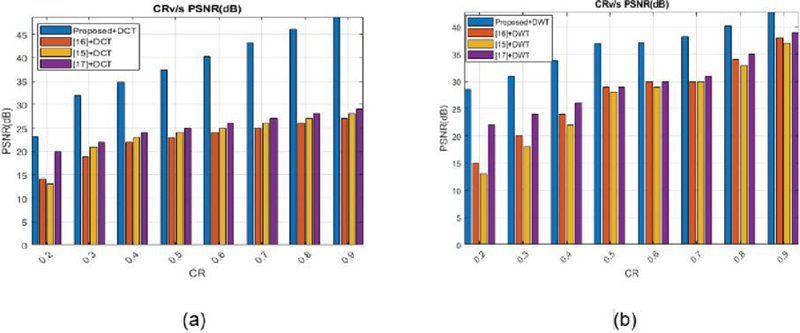
Figure 4 Comparison of reconstructed Lena image PSNR values using DCT and DWT with different compression ratios.
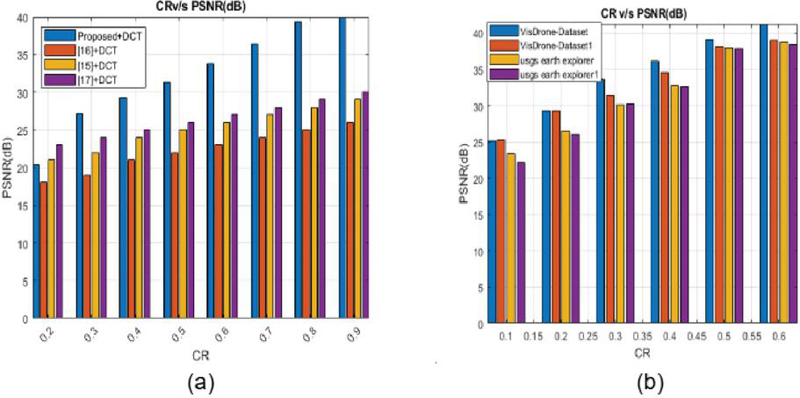
Figure 5 Reconstructed Cameraman images using DCT with different compression ratios and comparison of reconstructed image quality with different datasets using the compressed sensing method.
Vis-Drone and USGS Earth Explorer also confirm that the Lanczos measurement matrix provides better reconstruction quality under various compression conditions, with higher PSNR values at compression ratios around 0.5. These results suggest that the Lanczos matrix, possibly due to its interpolation properties, helps preserve image quality, even under high compression. In summary, the proposed algorithm with the Lanczos matrix excels in image reconstruction, providing high-quality results and outpacing other methods across different compression ratios shown in Figure 5(b). Table 3 presents a comparison of PSNR values
Table 3 Comparison of PSNR (dB) values for different reconstructed images using Lanczos measurement matrix and DCT basis
| Image | CR | [16] | [15] | [17] | [35] | Lanczos-based RMM (Proposed) |
| Lena | 0.4 | 19.4176 | 20.1462 | 22.4898 | 22.5110 | 29.3711 |
| 0.8 | 20.1923 | 21.2243 | 25.0215 | 26.5573 | 35.1650 | |
| Barbara | 0.4 | 16.0426 | 16.1422 | 19.9774 | 20.0030 | 26.6458 |
| 0.8 | 17.1624 | 18.1698 | 23.1501 | 24.6000 | 30.7826 | |
| Cameraman | 0.4 | 17.1456 | 18.4628 | 22.7816 | 22.5110 | 24.2169 |
| 0.8 | 19.0426 | 19.1292 | 24.6855 | 26.5154 | 28.3388 | |
| Couple | 0.4 | 16.1236 | 17.1628 | 21.5135 | 21.7409 | 26.7506 |
| 0.8 | 18.1443 | 20.1426 | 24.5379 | 26.0740 | 31.6585 | |
| Man | 0.4 | 16.1242 | 16.2892 | 20.7280 | 20.7660 | 25.3664 |
| 0.8 | 17.0123 | 17.1624 | 24.9015 | 25.8729 | 37.8502 |
for different reconstructed images using the Lanczos measurement matrix and the DCT basis. The results demonstrate that the proposed method outperforms other approaches, achieving higher PSNR values across a range of images. This indicates that the combination of the Lanczos measurement matrix and the DCT basis leads to superior reconstruction quality, with less distortion and improved image fidelity compared to alternative methods. Table 4 presents a comparison of PSNR values for different reconstructed images using the Lanczos measurement matrix and the DWT basis. The results show that the proposed method achieves better performance, with higher PSNR values across various images. This indicates that the Lanczos measurement matrix combined with the DWT basis provides superior reconstruction quality compared to other methods, leading to less distortion and better image fidelity. Table 5 compares the performance of the proposed Lanczos Measurement matrix with the other conventional measurement matrix based on different data sets. Table 5, we find better performance as compared to others based on different compression ratios.
Table 4 Comparison of PSNR (dB) values for different reconstructed images using Lanczos measurement matrix and DWT basis
| Image | CR | [16] | [15] | [17] | [35] | Lanczos-based RMM (Proposed) |
| Lena | 0.4 | 22.5234 | 24.7066 | 25.3790 | 25.6171 | 33.8337 |
| 0.8 | 33.6650 | 33.9236 | 35.9410 | 35.9445 | 40.1462 | |
| Barbara | 0.4 | 19.2453 | 17.9678 | 20.6453 | 21.2504 | 31.1438 |
| 0.8 | 29.4713 | 29.2874 | 31.2539 | 31.4085 | 36.2131 | |
| Cameraman | 0.4 | 22.4125 | 24.4852 | 22.8240 | 30.2987 | 29.2638 |
| 0.8 | 37.7135 | 37.5606 | 41.1727 | 41.4845 | 33.7142 | |
| Couple | 0.4 | 17.4948 | 20.6571 | 19.7847 | 24.9244 | 30.3159 |
| 0.8 | 34.2046 | 34.5163 | 36.5150 | 36.6071 | 36.0627 | |
| Man | 0.4 | 20.2903 | 20.4255 | 21.9864 | 22.0311 | 22.9194 |
| 0.8 | 29.7285 | 29.9522 | 31.2658 | 31.3418 | 32.6658 |
Table 5 Comparison of SSIM values for different reconstructed images using Lanczos measurement matrix and DWT basis
| Image | CR | [16] | [15] | [17] | [35] | Lanczos-based RMM (Proposed) |
| Lena | 0.4 | 0.3425 | 0.3950 | 0.4492 | 0.4536 | 0.9441 |
| 0.8 | 0.7201 | 0.7265 | 0.7843 | 0.7935 | 0.9840 | |
| Barbara | 0.4 | 0.4062 | 0.4078 | 0.4578 | 0.4605 | 0.9027 |
| 0.8 | 0.7593 | 0.7531 | 0.8057 | 0.8135 | 0.9638 | |
| Cameraman | 0.4 | 0.3373 | 0.3599 | 0.3971 | 0.4593 | 0.4072 |
| 0.8 | 0.6183 | 0.6126 | 0.7246 | 0.7309 | 0.6933 | |
| Couple | 0.4 | 0.3203 | 0.4176 | 0.4196 | 0.5040 | 0.8835 |
| 0.8 | 0.8179 | 0.8252 | 0.8733 | 0.8752 | 0.9607 | |
| Man | 0.4 | 0.3803 | 0.3918 | 0.4415 | 0.4367 | 0.8233 |
| 0.8 | 0.7588 | 0.7654 | 0.8049 | 0.8072 | 0.9613 |
Table 6 Comparison of SSIM values for different reconstructed images using Lanczos measurement matrix and DCT basis
| Image | CR | [16] | [15] | [17] | [35] | Lanczos-based RMM (Proposed) |
| Lena | 0.4 | 0.2458 | 0.2589 | 0.3193 | 0.3182 | 0.9319 |
| 0.8 | 0.3568 | 0.3246 | 0.4237 | 0.4735 | 0.9635 | |
| Barbara | 0.4 | 0.3487 | 0.3498 | 0.4055 | 0.4016 | 0.8544 |
| 0.8 | 0.4125 | 0.4512 | 0.5477 | 0.5955 | 0.9501 | |
| Cameraman | 0.4 | 0.2014 | 0.2145 | 0.2475 | 0.2488 | 0.8365 |
| 0.8 | 0.2478 | 0.2894 | 0.3104 | 0.3492 | 0.9165 | |
| Couple | 0.4 | 0.2651 | 0.2987 | 0.3300 | 0.3348 | 0.8815 |
| 0.8 | 0.2965 | 0.3651 | 0.4867 | 0.5481 | 0.9620 | |
| Man | 0.4 | 0.2458 | 0.2865 | 0.3794 | 0.3786 | 0.8507 |
| 0.8 | 0.3987 | 0.3954 | 0.5879 | 0.6249 | 0.9384 |
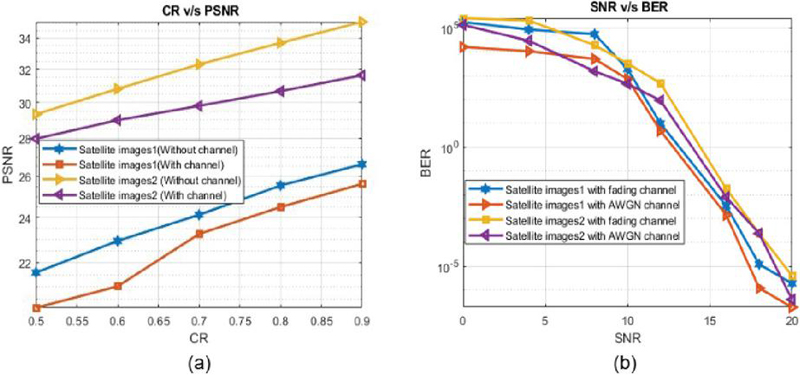
Figure 6 (a) PSNR performance comparison with channel and without channel. (b) BER performance comparison different channels.
Table 6 compares the SSIM values for different reconstructed images using the Lanczos measurement matrix and the DCT basis. The results indicate that the proposed approach with the Lanczos measurement matrix outperforms the given reference methods, demonstrating higher SSIM values and thus better preservation of structural similarity in the reconstructed images. This suggests superior reconstruction quality with the Lanczos matrix when compared to the reference techniques. Figure 6(a) illustrates the reconstructed image quality in terms of PSNR values across various compression ratios after signal transmission. It presents a comparison between reconstructed image performance with and without passing through the channel. The analysis suggests superior performance when the channel is not utilized. Figure 6(a) also presents the assessment of reconstructed image quality across wireless channels, considering different SNR values while maintaining a compression ratio of 0.9. The Figure 6(a) indicates that better performance, as indicated by higher PSNR values, is observed with the Additive White Gaussian Noise AWGN channel compared to other channels. This suggests that images transmitted over the AWGN channel experience less distortion and retain higher fidelity during reconstruction. Figure 6(b) show the BER performance comparison between AWGN and fading channels shows that fading channels typically exhibit higher BER due to signal degradation caused by multipath interference and varying channel conditions. In contrast, AWGN channels have a more consistent performance, with lower BER for the same signal power.
6 Conclusion
In this paper, we demonstrate the proposed Lanczos Measurements Matrix based compressed sensing which is highly effective in multispectral image transmission through wireless channels. We also present compelling evidence of the Lanczos Measurements Matrix’s effectiveness in signal compression as well as its reliable reconstruction. This approach consistently yields high-quality signal reconstructions. The PSNR values indicate superior performance, with a maximum PSNR of 42.7280 dB achieved at CR of 0.9. Also, we get 39.1823 dB at CR 0.9 with a satellite image of Lonar Lake. The Structural Similarity Index values further validate the quality of our reconstructions in the proposed model and preserving the structural similarity of the original signal. Also, we found better performance with high compression, that is we achieved a minimum average PSNR of 24.659 dB with a compression ratio is 0.1, indicating a relatively lower image quality. Conversely, we obtained a maximum average PSNR of 39.12 dB when using a CR of 0.5, implying significantly better image quality with the Vis Drone data set. The Lanczos Measurements Matrix exhibits versatility by performing well across various images (e.g., Lena, Man images, and satellite images of Lonar Lake). Comparative analysis with existing algorithms reveals that our proposed approach consistently outperforms in terms of significantly higher PSNR values. These results have promising implications for practical applications, such as image compression, data transmission, and signal processing, where efficient compression and high-quality reconstruction are essential. Our research demonstrates that the Lanczos Measurements Matrix is a valuable tool for signal compression and reconstruction. It efficiently reduces data size while maintaining high-quality reconstructions, making it a competitive choice in signal processing applications. These findings contribute significantly to the field’s understanding and offer practical solutions for real-time signal processing challenges.
References
[1] Y. Chen, T.-Z. Huang, W. He, N. Yokoya, and X.-L. Zhao, “Hyperspectral image compressive sensing reconstruction using subspace-based nonlocal tensor ring decomposition,” IEEE Trans. Image Process., vol. 29, pp. 6813–6828, 2020.
[2] J. Peng, Q. Xie, Q. Zhao, Y. Wang, L. Yee, and D. Meng, “Enhanced 3DTV regularization and its applications on HSI denoising and compressed sensing,” IEEE Trans. Image Process., vol. 29, pp. 7889–7903,2020.
[3] M. Wang, Q. Wang, J. Chanussot, and D. Hong, “0-1 hybrid total variation regularization and its applications on hyperspectral image mixed noise removal and compressed sensing,” IEEE Trans. Geosci. Remote Sens., vol. 59, no. 9, pp. 7695–7710, Sep. 2021.
[4] W. He et al., “Non-local meets global: An iterative paradigm for hyperspectral image restoration,” IEEE Trans. Pattern Anal. Mach. Intell., vol. 44, no. 4, pp. 2089–2107, Apr. 2022.
[5] E. J. Candes, J. Romberg, and T. Tao, “Robust uncertainty principles: Exact signal reconstruction from highly incomplete frequency information,” IEEE Trans. Inf. Theory, vol. 52, no. 2, pp. 489–509, Feb. 2006.
[6] F. Liu et al., “Nonconvex compressed sensing by nature-inspired optimization algorithms,” IEEE Trans. Cybern., vol. 45, no. 5, pp. 1042–1053, May 2015.
[7] Y. Zhou, S. Kwong, H. Guo, X. Zhang, and Q. Zhang, “A two-phase evolutionary approach for compressive sensing reconstruction,” IEEE Trans. Cybern., vol. 47, no. 9, pp. 2651–2663, Sep. 2017.
[8] H. Gan, Y. Gao, C. Liu, H. Chen, T. Zhang, and F. Liu, “AutoBCS: Block-based image compressive sensing with data-driven acquisition and noniterative reconstruction,” IEEE Trans Cybern. 2023 Apr;53(4):2558-2571. doi: 10.1109/TCYB.2021.3127657. Epub 2023 Mar 16. PMID: 34851846.
[9] Z. Zha, B. Wen, X. Yuan, S. Ravishankar, J. Zhou, and C. Zhu, “Learning nonlocal sparse and low-rank models for image compressive sensing: Nonlocal sparse and low-rank modeling,” IEEE Signal Process. Mag., vol. 40, no. 1, pp. 32–44, Jan. 2023.
[10] Y. Wang, L. Lin, Q. Zhao, T. Yue, D. Meng, and Y. Leung, “Compressive sensing of hyperspectral images via joint tensor tucker decomposition and weighted total variation regularization,” IEEE Geosci. Remote Sens. Lett., vol. 14, pp. 2457–2461, 2017.
[11] L. Zhang, W. Wei, C. Tian, F. Li, and Y. Zhang, “Exploring structured sparsity by a reweighted laplace prior for hyperspectral compressive sensing,” IEEE Trans. Image Process., vol. 25, pp. 4974–4988, 2016.
[12] C. Li, T. Sun, K. F. Kelly, and Y. Zhang, “A compressive sensing and unmixing scheme for hyperspectral data processing,” IEEE Trans. Image Process., vol. 21, pp. 1200–1210, 2012.
[13] X. Li, H. Shen, L. Zhang, H. Zhang, Q. Yuan, and G. Yang, “Recovering quantitative remote sensing products contaminated by thick clouds and shadows using multitemporal dictionary learning,” IEEE Trans. Geosci. Remote Sens., vol. 52, no. 11, pp. 7086–7098, Nov. 2014.
[14] X. Lu, Y. Yuan, and X. Zheng, “Joint dictionary learning for multispectral change detection,” IEEE Trans. Cybern., vol. 47, no. 4, pp. 884–897, Apr. 2017.
[15] V. Abolghasemi, et al. “A gradient-based alternating minimization approach for optimization of the measurement matrix in compressive sensing,” Signal Processing, vol. 92, no. 4, 2012, pp. 999–1009, doi:10.1016/j.sigpro.2011.10.012.
[16] H. Nouasria, et al. “A fast gradient-based sensing matrix optimization approach for compressive sensing”, Signal, Image Video Process. pp. 1–8, 2022.
[17] Q. Xu, et al. “Measurement matrix optimization for compressed sensing system with constructed dictionary via Takenaka Malmquist functions,” Sensors, vol. 21, no. 4, 2021.
[18] X. Liu, G. Zhao, J. Yao, and C. Qi, “Background subtraction based on low-rank and structured sparse decomposition,” IEEE Trans. Image Process, vol. 24, pp. 2502–2514, 2015.
[19] X. Liu et al., “Background subtraction using spatio-temporal group sparsity recovery,” IEEE Trans. Circuits Syst. Video Technol., vol. 28, no. 8, pp. 1737–1751, Aug. 2018.
[20] B. Madathil and S. N. George, “Simultaneous reconstruction and anomaly detection of subsampled hyperspectral images using 1/2 regularized joint sparse and low-rank recovery,” IEEE Trans. Geosci. Remote Sens., vol. 57, no. 7, pp. 5190–5197, Jul. 2019.
[21] M. Golbabaee and P. Vandergheynst, “Hyperspectral image compressed sensing via low-rank and joint-sparse matrix recovery,” in Proc. IEEE Int. Conf. Acoust. Speech Signal Process. (ICASSP), pp. 2741–2744, 2012.
[22] M. Golbabaee and P. Vandergheynst, “Joint trace/TV norm minimization: A new efficient approach for spectral compressive imaging,” in Proc. IEEE Int. Conf. Image Process. (ICIP), pp. 933–936, 2012.
[23] L. Zhang, L. Zhang, D. Tao, X. Huang, and B. Du, “Compression of hyperspectral remote sensing images by tensor approach,” Neurocomputing, vol. 147, pp. 358–363, Jan. 2015.
[24] S. Yang, M. Wang, P. Li, L. Jin, B. Wu, and L. Jiao, “Compressive hyperspectral imaging via sparse tensor and nonlinear compressed sensing,” IEEE Trans. Geosci. Remote Sens., vol. 53, no. 11, pp. 5943–5957, Nov. 2015.
[25] B. Du, M. Zhang, L. Zhang, R. Hu, and D. Tao, “PLTD: Patch-based low-rank tensor decomposition for hyperspectral images,” IEEE Trans. Multimedia, vol. 19, no. 1, pp. 67–79, Jan. 2017.
[26] J. Xue, Y. Zhao, W. Liao, and J. C.-W. Chan, “Nonlocal tensor sparse representation and low-rank regularization for hyperspectral image compressive sensing reconstruction,” Remote Sens., vol. 11, no. 2, p. 193, 2019.
[27] K. Zhang, W. Zuo, and L. Zhang, “FFDNet: Toward a fast and flexible solution for CNN-based image denoising,” IEEE Trans. Image Process., vol. 27, pp. 4608–4622, 2018.
[28] J. Xue, Y. Zhao, W. Liao, and J. C.-W. Chan, “Hyper-Laplacian regularized nonlocal low-rank matrix recovery for hyperspectral image compressive sensing reconstruction,” Inf. Sci., vol. 501, pp. 406–420, Oct. 2019.
[29] S. Zhang, L. Jiao, F. Liu, and S. Wang, “Global low-rank image restoration with Gaussian mixture model,” IEEE Trans. Cybern., vol. 48, no. 6, pp. 1827–1838, Jun. 2018.
[30] S. Yao, et al. “An encryption system for color image based on compressive sensing,” Optics and Laser Technology, vol. 120, no. 105703, 2019, p. 105703, doi:10.1016/j.optlastec.2019.105703.
[31] W. Lu, et al. “Compressed sensing performance of random bernoulli matrices with high compression ratio,” IEEE Signal Processing Letters, vol. 22, no. 8, 2015, pp. 1074–1078, doi:10.1109/lsp.2014.2385813.
[32] N. Zhou, et al. “Novel hybrid image compression encryption algorithm based on compressive sensing,” Optik, vol. 125, no. 18, pp. 5075–5080, 2014.
[33] Q. Xu, et al. “A fast image encryption algorithm based on compressive sensing and hyperchaotic map,” Optics and Lasers in Engineering, vol. 121, pp. 203–214, 2019, doi:10.1016/j.optlaseng.2019.04.011.
[34] W. Lu, et al. “Binary matrices for compressed sensing,” IEEE Transactions on Signal Processing, vol. 66, no. 1, pp. 77–85, 2018, doi:10.1109/tsp.2017.2757915.
[35] S. Patel and A. Vaish, “An efficient optimization of measurement matrix for compressive sensing”, Journal of Visual Communication and Image Representation, Volume 95, 2023, 103904, ISSN 1047-3203, https://doi.org/10.1016/j.jvcir.2023.103904.
Biographies

Arti Kumari is a Ph.D. research scholar in the Department of Electronics and Communication Engineering at Birla Institute of Technology, Mesra, Ranchi, India. She received her M.Tech in Wireless Communication from BIT Mesra and her B.Tech from R.T.C Institute of Technology, Ranchi University. Her research focuses on signal processing techniques for efficient communication systems. Her current work emphasizes multispectral image processing, compressed sensing, sparse signal reconstruction, and wireless communication frameworks. Her broader interests include next-generation communication technologies, image compression, and data-efficient transmission systems. She aims to develop robust and computationally efficient models for real-world communication and imaging applications.

Sanjeet Kumar is an Assistant Professor in the Department of Electronics and Communication Engineering at Birla Institute of Technology, Mesra, Ranchi, India, where he has been serving since July 2003. He received his B.Sc. (Engineering) and M.E. degrees from BIT Mesra and earned his Ph.D. from IIT Kharagpur. His research focuses on advanced wireless communication systems and signal processing techniques. His areas of expertise include 5G and beyond communication, large-scale cooperative MIMO systems, green communication technologies, and wireless visual sensor networks. He has been actively involved in teaching, research supervision, and the development of efficient and reliable communication frameworks.
Journal of Mobile Multimedia, Vol. 22_2, 227–248.
doi: 10.13052/jmm1550-4646.2223
© 2026 River Publishers