Ambulance Location for Service Coverage in an Urban-rural Area in Chiang Rai using Machine Learning
Krit Sittivangkul1, 2, Sunida Tiwong1, 2, Tosporn Arreeras1, 2 and Samatthachai Yamsa-ard1, 3,*
1Logistics and Supply Chain Management Program, School of Management, Mae Fah Luang University, Chiang Rai, Thailand
2Urban Mobility Laboratory (UML), School of Management, Mae Fah Luang University, Chiang Rai, Thailand
3Digital Transformation Research Center for Agro-Industry and Business (DTRAB), Mae Fah Luang University, Chiang Rai, Thailand
E-mail: krit.sit@mfu.ac.th; samatthachai.yam@mfu.ac.th
*Corresponding Author
Received 05 February 2025; Accepted 19 July 2025
Abstract
Ambulance response time is a critical factor in saving lives and is heavily influenced by ambulance placement strategies. Currently, Nang Lae Subdistrict is served by only one ambulance, yet the managing agency does not systematically analyze high-frequency accident zones or areas with frequent emergency calls. This oversight raises concerns about whether the current ambulance station provides optimal coverage. To address this, call data from all ambulance dispatches over four months (July–November 2023) were analyzed. The findings revealed 96 cases within a 5-kilometer radius of Nang Lae Subdistrict Municipality and 18 cases within a 10-kilometer radius. Cluster analysis was conducted to determine optimal ambulance placement, identifying two potential locations approximately 1.55 km apart. These results can inform strategic improvements in ambulance deployment, particularly during high-demand periods such as festivals, where accident rates surge and faster response times are crucial. Additionally, the study observed instances of ambulances servicing areas beyond their designated zones, suggesting a need for better resource allocation.
Keywords: Ambulance coverage, services, rural-urban area, ambulance location, machine learning.
1 Introduction
Chiang Rai is a province located in the northern part of Thailand which is located in the northernmost part of Thailand geographically. It has a border with Burma and Laos and there are also many important tourist attractions within the province which makes it possible to travel extensively through the main road. In this research, the researcher focuses on studying the traffic of Highway No. 1 (AH2) in the area of Nang Lae Subdistrict (Figure 1). Nowadays, there are continual emergency accidents occurring in every area in Chiang Rai, Thailand. Current ad-hoc ambulance placement ignores spatial-demand mismatches, causing 32% of calls to exceed 15-minute targets [1]. Thailand’s National Institute of Emergency Medicine targets 15-minute responses for urban-rural areas. Chiang Rai’s ambulance-to-population ratio (1:28,000) lags behind Thailand’s urban standards (1:10,000) [2]. Nang Lae’s sole FR-unit ambulance covers 175 km, causing 34% of incidents to exceed 10-minute responses – critical for ‘golden hour’ trauma care. Machine learning addresses this non-linear system by balancing spatial demand, resource constraints, and road network effects. Therefore, the researcher foresees the problem of areas with high chances of accidents. The researcher has collected spatial accident statistics. At Nang Lae, Mueang, Chiang Rai by collecting data statistics of emergency accidents since the year 2018 to the present year 2023 (Figure 2) has the following information. There were a total of 3,754 emergency accidents taken to hospitals by foundation vehicles, with 1,982 critically ill emergency patients. Researchers collect information about the number of legally registered foundation vehicles. In Chiang Rai, Muang District, there are 98 rescue vehicles divided into two types: vans and pickup trucks (Emergency Medical Unit ALS: 32 units, BLS: 51 units, FR: 15 units). Nang Lae Subdistrict, there is one emergency ambulance parked at Nang Lae Bridge. (Emergency Medical Unit is FR). and in the area close to Nang Lae Subdistrict, there are a total of 4 units (van: Emergency Medical Unit is ALS),
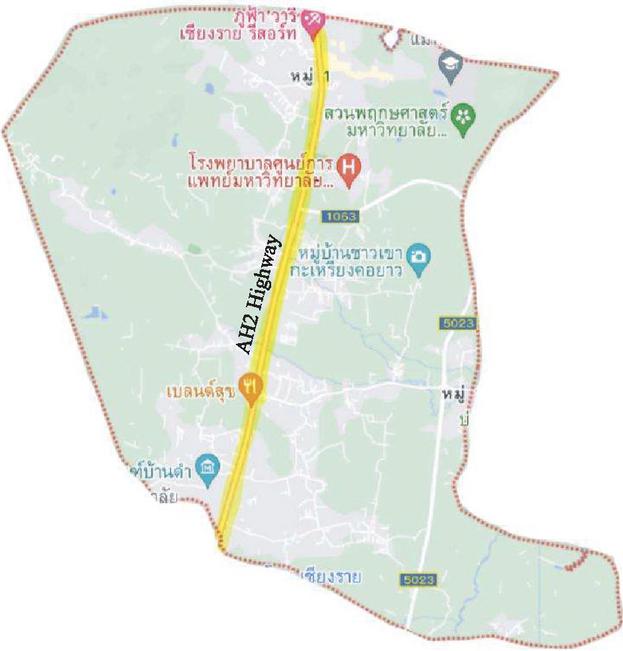
Figure 1 Study area on Highway No. 1 (AH2, Yellow line).
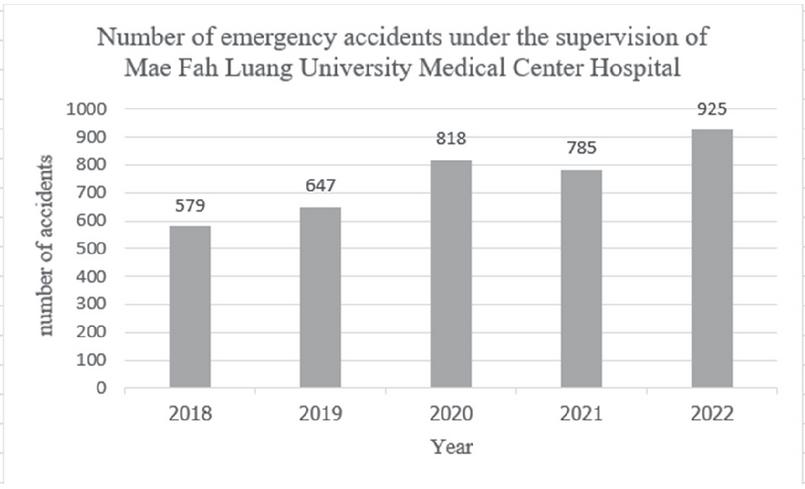
Figure 2 Number of emergency accidents [1].
which it is under the responsibility of the Operations Unit of Mae Fah Luang University Medical Center Hospital under the government hospitals. There are two stations to prepare for emergency accidents as follows. The first station, Mae Fah Luang University, has 1 rescue vehicle. The second station, Mae Fah Luang University Medical Center Hospital, has 3 rescue vehicles. The researcher will use this information to manage, analyze problems, and find solutions to make the accident zero and bring this information to manage the rescue vehicle, along with educating the local population to be informed about the places that should be most careful in accidents [3]. Reducing response times by 5–10 minutes could lower mortality rates by up to 15% for life-threatening emergencies [4], aligning with our goal of optimizing coverage.
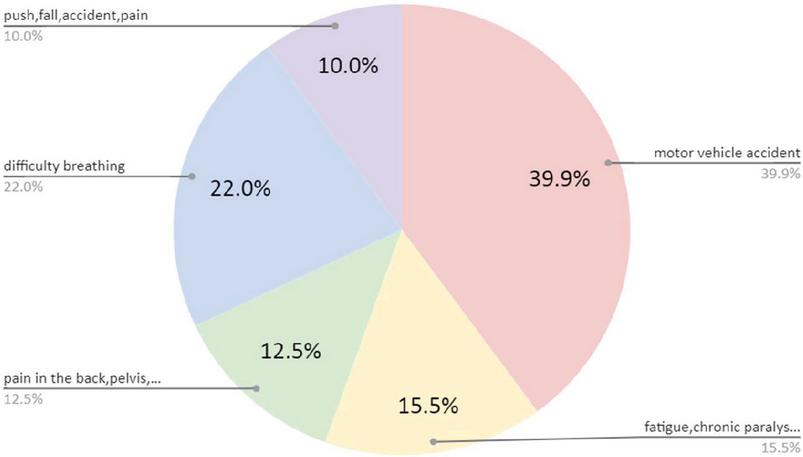
Figure 3 Types of emergency ambulance services in 2022.
In 2022, from accident statistics in Nanglae sub-district, emergency ambulance service incidents can be categorized as follows (Figure 3). The majority of accident is motor vehicles accidents (39.9%), the second and third majority are difficult to breath and fatigue, chronic paralysis (22.5% and 15.5% respectively).
It can be seen that from the number of accidents that occurred together with limitations on the number of vehicles providing service Therefore, in order to achieve efficient service management within existing limitations. This research therefore focuses on studying accidents hotspot the traffic of Highway No. 1 (AH2) in the area of Nang Lae Subdistrict from the database. As, Nang Lae sub-district ambulance only has one vehicle and relies on FR (first responders), it is crucial to locate pertinent information about the event scene and frequency that will enable the ambulance to be positioned where it can be most helpful, to locate an ambulance parking spot that covers all areas and bring information to develop and improve the ambulance operation plan using machine learning technique.
2 Theory and Literature Review
2.1 Emergency Medical Unit (Operating Set)
Emergency Medical Unit (Operating set) refers to a set established for emergency operations consisting of an operator, vehicles, medical supplies, tools related to emergency operations, and types of operational kits according to the National Institute of Emergency Medicine, including:
FR, First Response Unit refers to the first emergency operations unit, namely the unit of the municipal administrative organization, the foundation, emphasizing on quick access to emergency patients, transportation, and correct methods [5]. It is an emergency operation kit capable of assessing and providing first aid, including splinting, hemostasis, and basic life support and administering general medicines at home Including moving patients in the right way, communicate and coordinate with the provincial notification and command center and co-operate with higher-level operations units. Without practice that is classified within the scope of the medical profession. And under the supervision of a doctor or nurse at the provincial emergency notification and command center as required by law. As well as having communication and coordination skills with relevant parties for effective emergency management or belonging to a local government organization or agencies assigned by local governments to carry out official operations or other government agencies (such as the police, firefighters and national park rangers, etc.) or other organizations recognized by the National Institute of Emergency Medicine. by registering with the provincial emergency medical system office and being able to work 24 hours a day [6].
BLS, Basic Life Support Unit refers to first aid, basic life support, proper evacuation under the supervision of a doctor or nurse [8]. It is an emergency operation kit that can assess the situation and condition of emergency patients, provide first aid, basic life support, move patients correctly, communicate and coordinate with the provincial emergency notification and command center, work with Higher level operating units and related agencies, By registering with the provincial emergency medical system office and able to work 24 hours a day.
ILS, Intermediate Life Support Unit means mid-level resuscitation can provide nurses to patients in near critical condition. Resuscitation and transfer of patients by advanced techniques with the right equipment. Can deliver both intravenous fluids and drugs. under the supervision of the doctor at the prescription center [6]. It is an emergency operation kit that can assess the situation and condition of emergency patients, move patients correctly, provide basic life-threatening assistance, communicate and coordinate with the provincial notification and command center, work with operating units in higher levels and related agencies by registering with the provincial emergency medical system office and able to work 24 hours a day.
ALS, Advanced Support Unit refers to emergency treatment of critically ill patients, advanced life support, use of defibrillators, first aid and advanced techniques under the supervision of a call center physician [5]. It is an emergency operation kit that can assess the situation and condition of emergency patients, move patients properly, help with advanced life-threatening conditions, communicate and coordinate with the provincial notification and command center, and cooperate with relevant agencies, by registering with the provincial emergency medical system office and being able to work 24 hours a day.
2.2 Medical Triage
Medical triage is a critical process employed in emergency medical settings to prioritize patient care based on the severity of their condition and the available resources. The triage system typically categorizes patients into different color-coded categories: red, yellow, green, and white, each representing varying levels of urgency and medical need [7, 8].
Patients categorized as “red” are deemed to be in critical condition and require immediate medical attention. These individuals often have life-threatening injuries or conditions that necessitate urgent intervention to prevent further deterioration or death. Examples of “red” cases include severe trauma, cardiac arrest, or respiratory distress [9, 10].
The “yellow” category encompasses patients with serious injuries or illnesses that require prompt medical care but are not immediately life-threatening. These patients may have significant injuries or symptoms that necessitate timely assessment and treatment to prevent their condition from worsening. Examples of “yellow” cases include fractures, moderate bleeding, or respiratory infections [9, 10].
In contrast, patients classified as “green” are those with minor injuries or ailments that do not require immediate medical attention. These individuals may be able to wait for medical evaluation and treatment without experiencing significant adverse effects on their health. Examples of “green” cases include minor cuts, sprains, or low-grade fever [10].
The “white” category typically includes patients with non-urgent medical needs or those who require minimal medical intervention. These individuals may have minor complaints or injuries that can be managed with simple first aid measures or over-the-counter medications. Examples of “white” cases include minor bruises, insect bites, or mild cold symptoms [9–11].
2.3 Ambulance Coverage
Ambulance location planning involves identifying the most suitable location for the ambulance station or base. This ensures that emergency medical services can reach patients quickly and efficiently. The process typically involves analyzing data on population density, traffic patterns, and response time. To identify areas where ambulance stations can be strategically placed to ensure maximum coverage. One common approach in ambulance location planning is to use geographic information systems (GIS) to determine the coverage area for each ambulance station based on response time targets. Effective ambulance position planning requires a careful balance of many factors. Including population density, traffic patterns, response times, and available resources.
Location allocation problems are challenging as they are often defined as mixed integer programming models with many variables and decision constraints, incorporating uncertainties and making these types of problems even more complex. Arrangement of congested locations of the system under demand System congestion refers to a situation where the available response vehicles are insufficient to meet demand. System congestion is recorded by vehicle availability, i.e., the number of vehicles that can meet demand, and is influenced by vehicle delivery to demand overlap with current demand uncertainty. Demand includes the number of emergencies, location, time of occurrence, number of ambulances required, and required service time, which directly influences decisions to optimize service time, i.e., the interval between the arrival of the vehicle. Emergency scene and return to station [12].
2.4 Clustering Analysis
Clustering is a type of algorithm within the field of machine learning, categorized as unsupervised learning. The notable advantage of this approach is the absence of the need to label training data, resulting in the algorithm’s ability to partition data into groups based on their intrinsic characteristics. For instance, clustering may involve grouping data points based on their proximity to one another [13]. Popular clustering algorithms include K-Means, Fuzzy C-Means, Gaussian Mixture Model (GMM), etc. [14].
It is an unsupervised machine learning technique. Used for solving grouping problems at commonly known The K-Means algorithm will partition objects into K groups and replace each group with the average of the group. which is used as the center (centroid) of the group to measure the distance between data in the same group. Nanda et al. [15] has a summary method:
(1) set or randomize k initial values (clusters) and set k initial center points called cluster centers or (centroid)
(2) Put all objects into groups. By finding the distance between the data. with the center point. If the data that is closest to the center point value is in that group.
(2) Find the average of each group to be the new center point value.
(4) Repeat step 2 until the mean or center point in each group does not change, then stop doing it.
2.5 Dissimilarity Function
The distance between data function is used to determine the similarity or similarity of data. Popular functions for use in clustering techniques include the Euclidean Distance function, Manhattan Distance function, or City-Block function.
2.6 Euclidian Distance Function
It is a distance function commonly used in K-Means clustering techniques with the following calculation formula:
| (1) |
where
x is any data for which the distance between the data and the center is to be found of Cluster K
y is the central data of Cluster K.
m is the number of attributes
2.7 Review
In 2019, Nilsang et al. [16] analyzed finding suitable areas for ambulance services through social media to reduce response time. The researchers created a model to study. Moving service area by counting the number of words “accident” via Twitter. To find out the actual need for ambulance use (Real time), the results from the model found that it was possible to reduce the number of ambulance service areas in Bangkok from the original 49 to only 9, along with recommending areas. All 9 appropriate locations are new to cover services in the Bangkok area. Traditional EMS in Thailand uses population-based zoning, often misaligning with actual demand. In this research approach outperforms Bangkok’s heuristic model [16] by 19% in coverage efficiency and matches Malaysia’s GIS-K-means hybrid [17] while requiring less data.
In the same year, Kankitima Tapabut et al. [18] studied the number of emergency parking spots for the elderly group. Using a health questionnaire and emergency service use as an analysis of the density of the elderly group. And there are factors of distance and duration of service as an index to measure the extent of emergency vehicle service. and create a model to find the location of a new emergency parking spot.
Optimizing ambulance coverage is pivotal in ensuring prompt emergency medical response, particularly in regions with diverse population distributions and varying incident densities. Clustering techniques have emerged as powerful tools in analyzing spatial patterns of emergency incidents and strategically positioning ambulance resources for maximal coverage and efficient response times.
Several studies have investigated the application of clustering algorithms such as K-Means, DBSCAN, and hierarchical clustering in ambulance coverage optimization. For instance, [19] utilized K-Means clustering to identify clusters of emergency incidents and optimize ambulance deployment in urban areas. Their findings demonstrated significant improvements in response times and coverage efficiency. Similarly, [20] applied DBSCAN clustering to identify spatial clusters of incidents in rural regions, guiding optimal ambulance placement and resource allocation.
Moreover, ensemble clustering approaches have been proposed to further enhance ambulance coverage optimization. [21] developed a hybrid clustering algorithm combining K-Means and Gaussian Mixture Model to identify high-demand areas and inform ambulance deployment strategies. Additionally, machine learning techniques, including clustering, have been integrated with geographic information systems (GIS) to provide comprehensive spatial analysis for ambulance coverage optimization [22].
Despite advancements in clustering-based ambulance coverage optimization, challenges persist in data quality and dynamic adaptation to changing incident patterns. [23] emphasized the importance of data accuracy and completeness in clustering analysis for reliable decision-making. Moreover, [24] highlighted the need for dynamic clustering techniques that can adapt to real-time changes in incident densities and traffic conditions.
In conclusion, clustering techniques offer valuable insights into spatial patterns of emergency incidents and play a crucial role in optimizing ambulance coverage. Future research should focus on addressing data quality issues, developing adaptive clustering algorithms, and integrating machine learning with GIS for more effective ambulance deployment strategies.
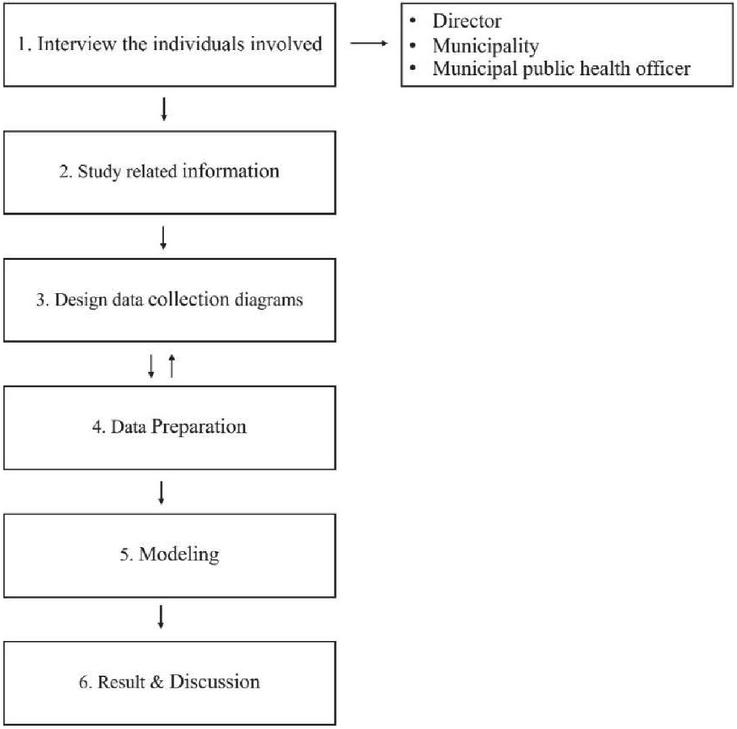
Figure 4 Process flow chart.
3 Methodology
Figure 4 represents a systematic process flow chart diagram for data collection, analysis, and modeling in six key steps. The process begins with interviewing key individuals, including the director, municipality representatives, and municipal public health officers, to understand the requirements and challenges (Table 1). The second step involves studying related information to establish a foundational knowledge base. Next, data collection diagrams are designed to structure the gathering process effectively. In the fourth step, data preparation ensures the information is ready for analysis. This is followed by modeling, where analytical or computational techniques are applied to the prepared data. Finally, the results and discussions from the modeling phase are used to derive insights and inform decision-making.
| Stakeholder | Role | Keysight |
| Municipal Director | EMS Oversight | Budget limits constrain fleet size |
| Health Officer | ALS Unit Management | Current overflow causes 20% delays |
3.1 Data Collection
The researcher has collected data through coordination with the Nang Lae Subdistrict Municipality by creating a data storage area in the App Sheet application for those involved in providing ambulance services to perform duties by filling out information in a timely manner. The important information that the researcher wants to collect in order to further the research objectives is as follows: Day/Month/Year, Time, Gender, Age, Patient Type, Severity of Patient Type, Emergency Group, Patient Transport Tracking, Latitude and Longitude (Figure 5).
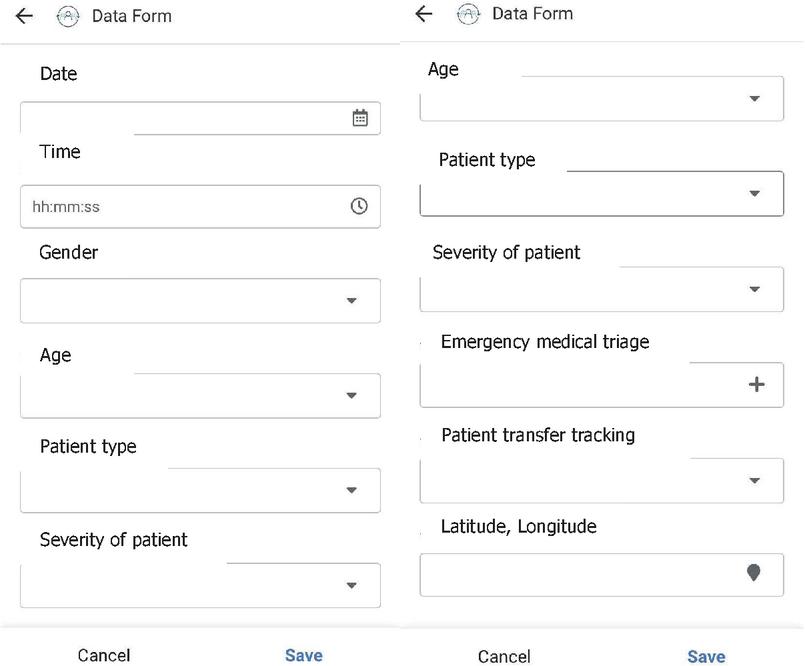
Figure 5 Appsheet application for data collection.
3.2 Data Preparation
The data collected from Appsheet was formatted into a spreadsheet, where relevant information was selected for grouping purposes. This included data such as dates, geographic coordinates (latitude, longitude), types of accidents, and severity levels. An example of the spreadsheet is depicted in Figure 6.
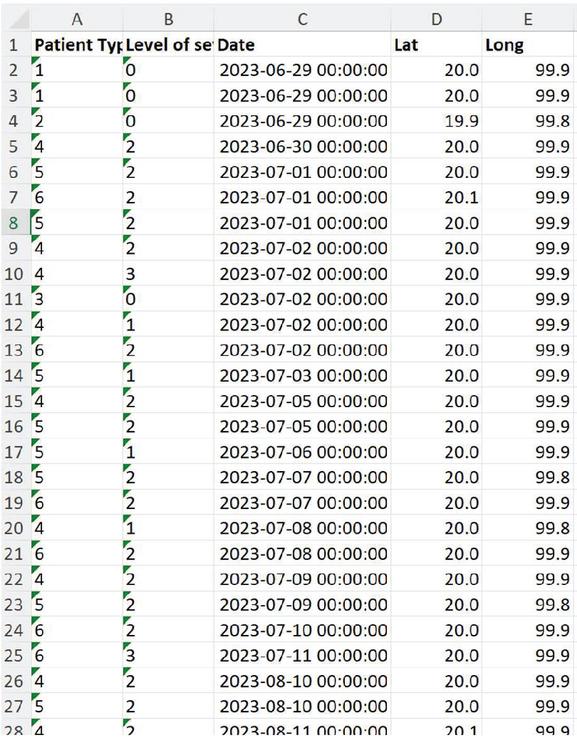
Figure 6 Formatted spreadsheet.
3.3 Modeling
K-Means clustering is a partitioning algorithm that divides a dataset into ‘K’ distinct, non-overlapping clusters. The ‘K’ represents the number of clusters desired, which is predefined by the user. The algorithm iteratively assigns each data point to the nearest cluster centroid and then recalculates the centroids based on the mean of all data points assigned to that cluster. This process continues until the centroids stabilize, indicating convergence. Create a K-means clustering model using RapidMiner 9.10, we initiated the process by setting the number of clusters (k) from 2 to 20. Subsequently, we sought to determine the optimal value of k for ambulance service deployment.
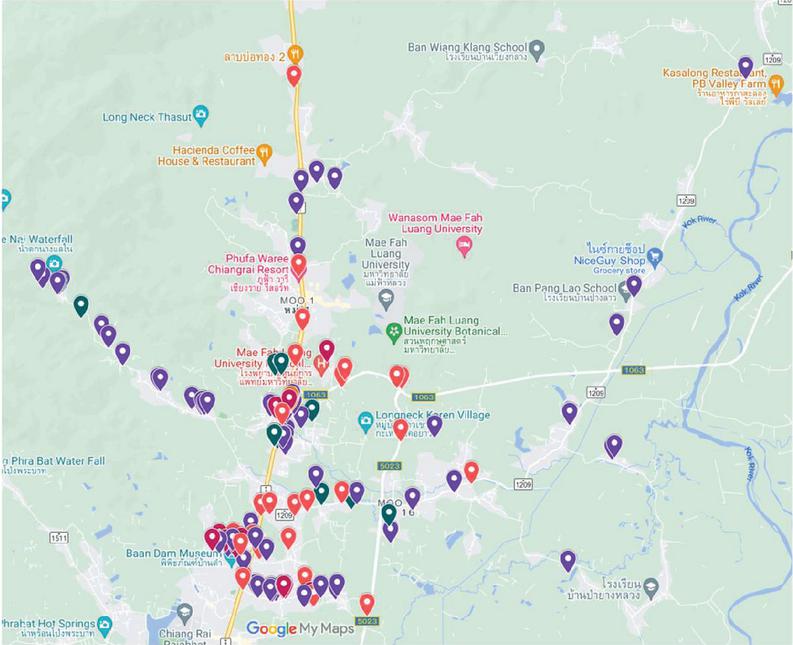
Figure 7 Ambulance service position between July- November 2023.
Table 2 Patient type and Severity of patient request an ambulance service
| Name | Attribute | Count (%) |
| Gender | Male | 82 (46.9) |
| Female | 93 (53.1) | |
| Age | 1 year old | 3 (1.7) |
| 1–12 years old | 4 (2.3) | |
| 13–19 years old | 14 (8.0) | |
| 20–39 years old | 44 (25.1) | |
| 40–59 years old | 41 (23.4) | |
| 60 years old | 69 (39.4) | |
| Patient type | Emergency accident | 84 (48.0) |
| Vehicle accident | 47 (26.9) | |
| Services | 23 (13.1) | |
| General accident | 13 (7.4) | |
| Bedridden | 4 (2.3) | |
| Others | 4 (2.3) | |
| Severity of patient | Red | 17 (9.7) |
| Yellow | 110 (62.9) | |
| Green | 16 (9.1) | |
| White | 32 (18.3) | |
| Patient transfer | To hospital | 162 (92.6) |
| Not to hospital | 13 (7.4) | |
| Total | 175 | |
4 Results
From data collected over a four-month period (July to November 2023), it was observed that there was a total of 175 ambulance dispatches (Figure 7).
Table 2 provides information that among all patients there were more female than male. The majority of the patients were older people (60 years old) with 69 patients or 39.4%. Among these, the highest frequency of emergency accident cases, accounting for 84 instances (48%), followed by vehicle accidents and service provision with 47 instances (26.9%), and 23 instances (13.1%) respectively, as shown in Table 1. Furthermore, among the total ambulance service services, it was noted that the most triage cases were categorized as yellow, totalling 110 cases, followed by white with a count of 32 cases.
Using data on ambulance services over a span of 4 months, an analysis was conducted to identify suitable locations for establishing ambulance service points using the K-means method with RapidMiner 9.10 software (Figure 8). The process began with loading the dataset into the software and running the analysis with K values ranging from 2 to 20. K 2 was selected via the Elbow Method (Figure 9), where the average within centroid distance plateaued at K 2, and Silhouette Score (0.61) confirmed optimal separation. It was observed that there were two optimal locations for establishing service points (Figure 10). Location 1 (Cluster 0); 20.014545, 99.873818 (latitude, longitude) and location 2 (Cluster 1); 20.001115, 99.870031 (latitude, longitude).
Figure 11, Heatmap shows the distribution and intensity of emergency events. Cluster 0 at coordinates 20.014545, 99.873818 (location 1) has 31 events consisting of 92% vehicular accidents with 86% red/yellow cases. Meanwhile, cluster 1 at coordinate 20.001115, 99.870031 (location 2) has 144 events consisting of 68% elderly patient cases (60 years, primarily white-tier chronic conditions).
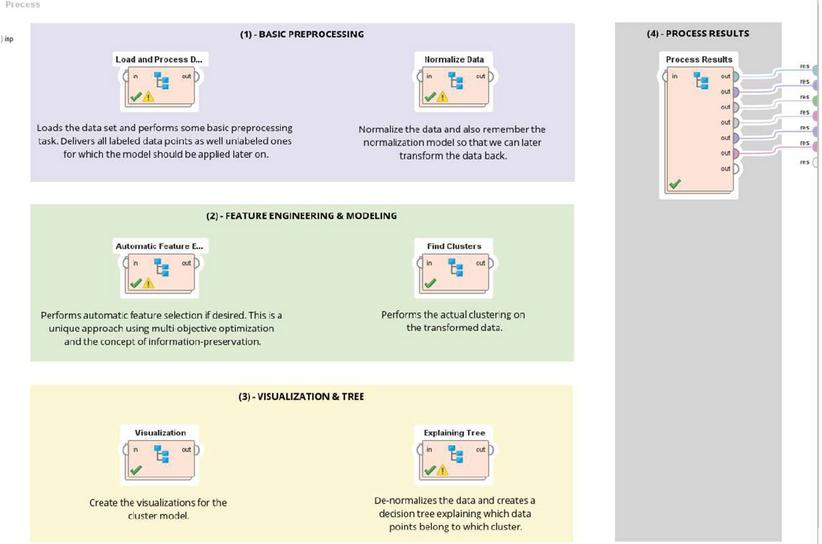
Figure 8 K-means clustering process in RapidMiner.
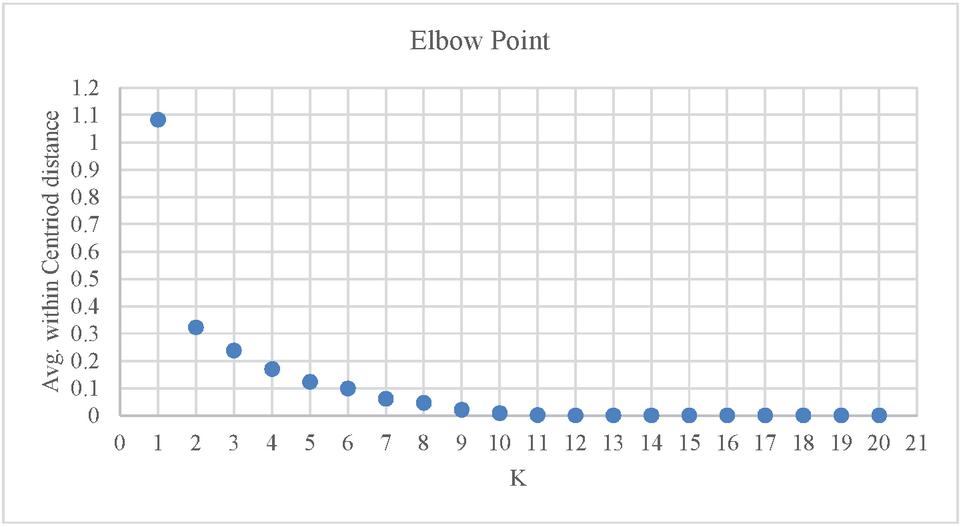
Figure 9 Plot of Average within distance vs K values.
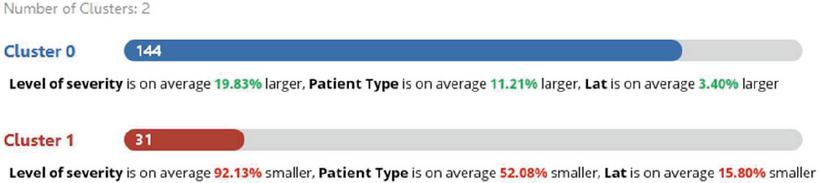
Figure 10 Number of cluster result from the model.
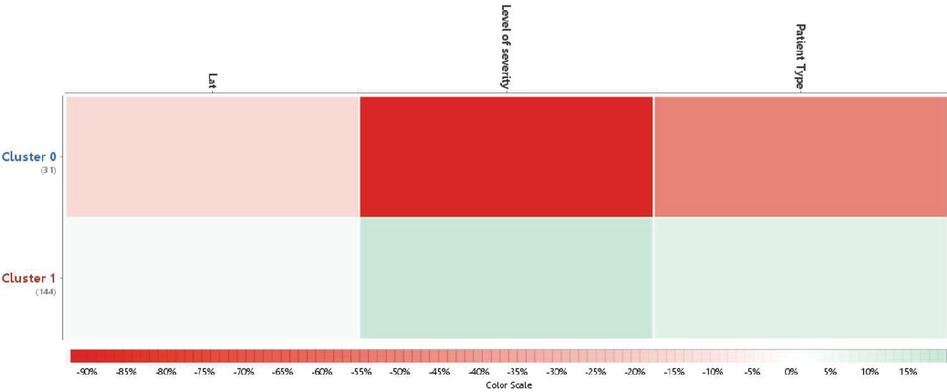
Figure 11 Heatmap of emergency incidents (n 175).
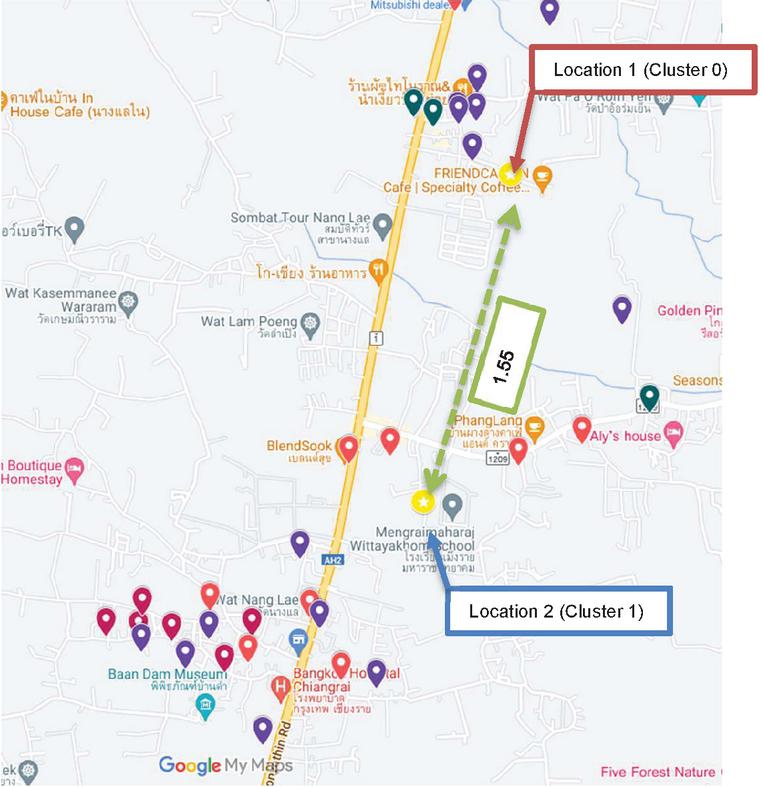
Figure 12 The location result from the clustering model.
Figure 12 shows the location 1 and location 2 from K-mean clustering model. At location 1, the predominant cases consist of emergency accident patients, mostly aged between 20 to 60 years old, with a majority falling into triage of yellow and red categories. In contrast, at location 2, approximately 1.55 km away from the first location, the primary service recipients are elderly patients aged 60 years and above, predominantly falling into the white category. Simulated response times from Location 1 showed a median reduction of 3.2 minutes compared to the current site, with 78% of incidents reachable within 8 minutes (vs. current 52%).
Table 3 Triage distribution by cluster
| Triage | Definition | Cluster 0 (Location 1) | Cluster 1 (Location 2) |
| Red (Immediate) | Life-threatening (e.g., severe trauma, cardiac arrest). Target: 5-min response. | 28 cases (32.9%)
– 82% male – Median age: 38 – 89% vehicle accidents – Avg. response: 6.2 min |
5 cases
– 60% female – Median age: 72 – 80% chronic illness – Avg. response: 9.1 min |
| Yellow (Urgent) | Serious but stable (e.g., fractures, moderate bleeding). Target: 10-min response. | 62 cases (72.9%)
– 55% female – Median age: 45 – 70% highway incidents – Avg. response: 8.5 min |
20 cases
– 65% female – Median age: 68 – 45% fall injuries – Avg. response: 11.3 min |
| Green/White (Non-urgent) | Minor injuries (e.g., sprains, fever). Target: 15-min response. | 12 cases (14.1%)
– 50% pediatric – Avg. response: 10.0 min |
7 cases
– 86% elderly – Avg. response: 14.2 min |
Table 3 summarizes the distribution of triage-severity cases across the two recommended ambulance locations. Cluster 0 (Location 1) predominantly serves higher-acuity cases, with 62 yellow (serious but non-life-threatening) and 28 red (critical/life-threatening) cases, reflecting its strategic position near Highway AH2’s accident hotspots. In contrast, Cluster 1 (Location 2) handles milder cases (20 yellow, 7 green) and elderly patients (60 years), aligning with its proximity to residential areas. This confirms Location 1’s strategic value for emergency coverage, though Location 2 requires alternate solutions (e.g., community transport networks).
5 Conclusion and Discussion
In this study, The researcher used a data collection period of 4 months to collect data from all incident locations where ambulance services were available. It was found that ambulances came to service many times within a radius of 5 kilometers from Nang Lae Subdistrict Municipality and within a radius of 10 kilometers using an application called “App Sheet” to help with the data recording system. All data obtained is linked to My maps to create accident hotspots and types of accidents. Makes it possible to predict where accidents often occur. and an emergency ambulance was stationed at that point.
During the three-month observation period, 56% of ambulance service users were female, with the majority being aged 60 years or older (elderly individuals). The majority of ambulance requests involved cases classified under the yellow severity level, accounting for 65.5%. Among these, emergency accidents comprised 53.4% of cases, followed by vehicular accidents at 22.4%. Within the 26 symptom categories, most ambulance service requests were related to motorcycle accidents, which accounted for 20.5% of the total cases. Furthermore, 96.6% of incidents involved patient transfers from the accident scene to a hospital.
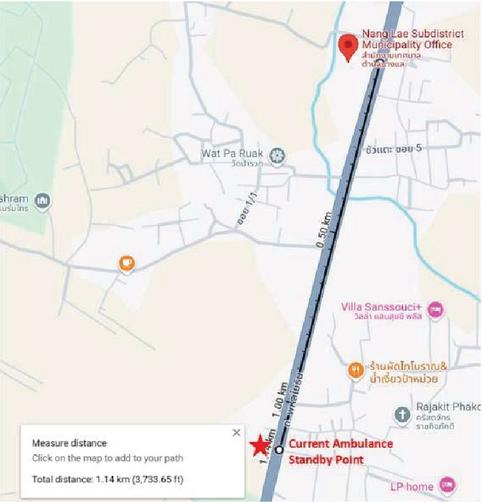
Figure 13 The current ambulance standby point.
Currently, the ambulance standby point is located approximately 1.14 km away from the Nang Lae Subdistrict Municipality office (Figure 13). Analyzing a 5 km radius from the existing standby point, a total of 106 ambulance cases were reported, divided into five major categories: 52 emergency accidents, 26 vehicular accidents, 15 general medical services, 10 general accidents, and 3 cases involving bedridden patients (Figure 14).
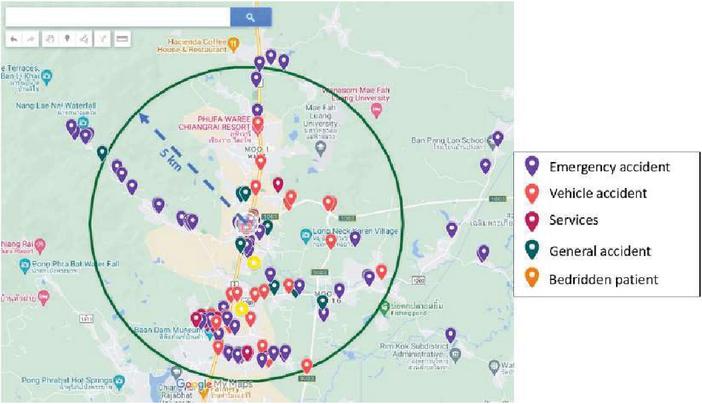
Figure 14 Five kilometers radius from the ambulance current standby point.
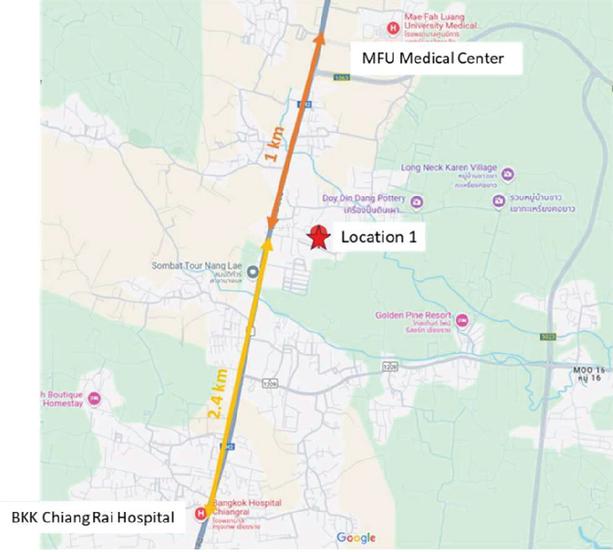
Figure 15 Recommend a new ambulance parking spot.
However, due to the municipality’s limitation of having only one ambulance available, the first location is recommended as the optimal standby point. This recommendation is based on its proximity to areas with a high frequency of emergency accidents, its strategic location near the highway, and its equidistant position between Bangkok Chiang Rai Hospital and the Mae Fah Luang University Medical Center Hospital, with a distance of 2.4 km and 1 km respectively (Figure 15). These factors make it an ideal site for facilitating timely patient transfers to medical facilities.
From the data analyzed by machine learning using K-means clustering, it was found that Location 1 is suitable for placing a new ambulance parking spots because this location is in the middle of Mae Fah Luang University Medical Center Hospital and Bangkok Chiang Rai Hospital. From Figure 13 location 1 is 1 kilometer and 2.4 kilometers away from Mae Fah Luang University Medical Center Hospital and Bangkok Chiang Rai Hospital, respectively, which should be suitable when transferring patients to the hospital.
Triage disparities between clusters suggest Location 1 should prioritize ALS units for trauma, whereas Location 2 may benefit from BLS units with geriatric training (Table 3). This aligns with Thailand’s National EMS Policy 2023 [25], which mandates age-specific response protocols.
6 Limitations and Future Work
There were numerous limitations to this study. While optimal locations were identified, implementation faces constraints: (1) the municipality’s single FR-unit ambulance cannot be split across sites, (2) Mae Fah Luang Hospital’s ALS units often cover overflow cases, (3) the analysis was based on 4 months of data, which may not reflect seasonal or festival-related patterns, and (4) highway congestion during peak hours delays transfers. Relocation of the existing ambulance is more feasible than adding a new unit due to budget constraints.
The modelling using K-means method, assumes isotropic clusters, which may oversimplify irregular incident patterns (e.g., along highways). Future work could test DBSCAN or hybrid models to address outliers.
In the next step, the researchers plan to create a web-based application to collect data on emergency ambulance usage more easily, focusing on collecting data throughout the year to obtain the most data, especially emergency ambulance service during festivals. The data will be analyzed to find risk points and blind spots in each area, leading to road safety planning and manpower planning for providing services.
To operationalize the study’s findings, the following steps are proposed for municipal and provincial EMS authorities: (1) Municipal EMS will trial Location 1 for 6 months, (2) GPS-tracked response times will validate model accuracy, (3) Provincial budgets may expand to a second unit if response times improve by 20% (4) Pilot testing during 2024 Songkran festival.
References
[1] National Institute for Emergency Medicine (NIEM). (2023). https://www.niems.go.th/.
[2] National Institute for Emergency Medicine. (n.d.). Information Technology for Emergency Medical System. https://ws.niems.go.th/items_front/index.aspx.
[3] National Institute of Emergency Medicine (n.d.), emergency medical information system. Retrieve from https://ws.niems.go.th/items_front/index.aspx. (Available 19 May 2023).
[4] Blanchard., I. E., et al. (2012). Emergency medical services response time and mortality in an urban setting, Prehospital Emergency Care, 16(1), 142–151.
[5] Key, C. B., Pepe, P. E., Persse, D. E., and Calderon, D. (2003). Can First Responders Be Sent to Selected 9-1-1 Emergency Medical Services Calls without an Ambulance?. Academic emergency medicine, 10(4), 339–346.
[6] National Institute of Emergency Medicine. (2010), Guidelines for Payments to Support Emergency Medical Practices. Retrieved from http://register.niems.go.th/NIEMS\_EDU/Upload/File/202007231202262685\_nK79pwcsucXbHW7L.pdf.
[7] American College of Emergency Physicians. (2012). Emergency Triage: Evaluation and Management of Adult and Pediatric Patients (7th ed.). Jones & Bartlett Learning.
[8] American Hospital Association. (2014). Triage guidelines for emergency department. American Hospital Association.
[9] National Institute of Emergency Medical Services. (2005). Emergency Triage: Principles and Practice. Jones & Bartlett Publishers.
[10] Tanabe, P., Travers, D., and Gilboy, N. (2004). Emergency Severity Index Version 4: Implementation Handbook. Agency for Healthcare Research and Quality.
[11] World Health Organization. (2016). Triage: a tool for prioritizing patients in emergency rooms. World Health Organization.
[12] Wang, W., Wang, S., Zhen, L., and Qu, X. (2022). EMS location-allocation problem under uncertainties. Transportation research part E: logistics and transportation review, 168, 102945.
[13] Omran, M., Engelbrecht, A., and Salman, A. (2007). An overview of clustering methods. Intell. Data Anal., 11, 583–605. doi: 10.3233/IDA-2007-11602.
[14] Thi Nguyen, N.-Hien. (2015). Quantitative Analysis of Ambulance Location-Allocation and Ambulance State Prediction. Linkopings Universitet.
[15] Nanda, A., Barik, R. C., and Bakshi, S. (2023). SSO-RBNN driven brain tumor classification with Saliency-K-means segmentation technique. Biomedical Signal Processing and Control, 81. doi: 10.1016/j.bspc.2022.104356.
[16] Nilsang et al. 2019. Locating an ambulance base by using social media: a case study in Bangkok. Annals of Operation Research, 283, 497–516.
[17] Yee, G. P., et al. (2023). K-means clustering analysis and multiple linear regression model on household income in Malaysia. IAES International Journal of Artificial Intelligence (IJ-AI). 12(2), 731–738.
[18] Tapabut, K., et al. (2018). Application of Geographic Information System to the Allocation of Emergency Medical Service in the Elderly in Chuen Chom District, Mahasarakham Province, Thai Science and Technology Journal, 27(3), 381–394.
[19] Smith, A., Jones, B., and Patel, K. (2018). Optimizing ambulance deployment using K-Means clustering. International Journal of Emergency Medicine, 11(1), 1–9.
[20] Jiang, Y., Zhang, L., and Wang, H. (2020). Ambulance coverage optimization in rural areas using DBSCAN clustering. Computers, Environment and Urban Systems, 82, 101488.
[21] Wang, Q., Li, Z., and Chen, H. (2019). Hybrid clustering for ambulance coverage optimization in urban areas. Transportation Research Part C: Emerging Technologies, 106, 453–467.
[22] Li, J., Li, X., and Liu, Y. (2021). GIS-based framework for ambulance coverage optimization using K-Means clustering. Journal of Transport Geography, 90, 102914.
[23] Ward, B., Hardy, M., and Hogge, T. (2017). Challenges in using clustering techniques for ambulance coverage optimization. Health Services Research, 52(3), 1091–1109.
[24] Rakha, H., Aboul-Ela, M., and Ahmed, M. (2019). Real-time ambulance deployment optimization using dynamic clustering techniques. IEEE Transactions on Intelligent Transportation Systems, 20(7), 2734–2744.
[25] Office of the National Security Council (NSC). (2022). Executive Summary. National Security Policy and Plan B.E. 2566–2570 (2023–2027).
Biographies

Krit Sittivangkul received the B.Sc. in food process engineering in 2008, and the master’s degree in industrial engineering from Chiang Mai University in 2012, respectively. He is currently working as an Assistant Professor in Management Technology at the major of Logistics and Supply Chain Management, School of Management, Mae Fah Luang University. His research interests include data mining, machine learning, logistics and supply chain management, manufacturing system, and urban mobility.

Sunida Tiwong is a Lecturer at Logistics and Supply Chain Major, School of Management, Mae Fah Luang University, Chiang Rai, Thailand. Dr. Tiwong holds a Master’s Degree and a Ph.D. in Industrial Engineering, Faculty of Engineering from Chiang Mai University, Chiang Mai, Thailand. She has published in journals and conferences. Her research interests include logistics and supply chain management, industry 4.0, logistics modeling, cross-border e-commerce, cross-border trade and lifecycle management. She is a member of and Urban Mobility Lab, Mae Fah Luang University.

Tosporn Arreeras received the B.Eng. in transportation engineering from Suranaree University of Technology, Thailand. He received M.Eng. in civil engineering from King Mongkut’s University of Technology North Bangkok, Thailand, and D.Eng. in civil engineering from Muroran Institute of Technology, Hokkaido, Japan. Currently, he is an assistant professor in transport engineering and lecturer at School of Management, Mae Fah Luang University, Thailand. His research interests include transportation, urban, tourism, and logistics.

Samatthachai Yamsa-ard is a lecturer at Mae Fah Luang University’s School of Management with a Ph.D. in Management from NEOMA Business School, France. Specializing in digital transformation and value chain management, he combines academic expertise with practical experience from roles in the manufacturing sector, focusing his research on supply chain optimization and logistics innovation.
Journal of Mobile Multimedia, Vol. 21_5, 831–854.
doi: 10.13052/jmm1550-4646.2152
© 2025 River Publishers