Novel Approach for Intrusion Detection in IoT Networks Based on ResNet-ABC-Chatterjee Algorithm
Mahmood Mohassel Feghhi1, Raya Majid Alsharfa1, 2,* and Mohammed Ridha Faisal3
1Faculty of Electrical and Computer Engineering, University of Tabriz, Tabriz, Iran
2Electrical Engineering Technical College, Middle Technical University, Baghdad, Iraq
3Department of Cybersecurity Engineering Techniques, Ibn Khaldun Private University College, Iraq
E-mail: mohasselfeghhi@tabrizu.ac.ir; rayamajid89@mtu.edu.iq; rayamajid@tabrizu.ac.ir; Mohammed.ridha@ik.edu.iq
*Corresponding Author
Received 27 February 2025; Accepted 28 June 2026
Abstract
The intrusion detection in the Internet of Things (IoT) network presents a number of difficulties, necessitating the skillful use of network device attributes for precise threat identification. With a multi-phase approach, this research provides a novel intrusion detection method. This technique takes advantage of the non-linear relationship identification capability of the Chatterjee correlation. The Artificial Bee Colony (ABC) approach is employed for optimizing the feature selection procedure. Lastly, a specialized Residual Neural Network (ResNet) is designed that can detect complex relationships from the data using minimal computational cost. The above design contains three types of residual blocks which are designed in a discriminatory fashion to enable the model to capture both the high-level and low-level features. At each layer, an increase in the number of filters is used to enhance the process of feature extraction. The convolutional layers are of great importance since they control the whole learning process. To ensure the effectiveness of the network in collecting complex relations, a method for converting 1D features into 2D images is provided to facilitate the ResNet input. Experimental results indicate that the suggested approach is exceptionally adept at identifying intrusions in the IoT networks, achieving accuracy of 98.5711%. The combination of ABC optimization, ResNet, and Chatterjee correlation leads in a strong and effective intrusion detection system, which shows promise for improving the cyber security of IoT environments.
Keywords: Intrusion detection, Internet of Things, Artificial Bee Colony, neural network, feature selection, cyber security.
1 Introduction
The Internet of Things (IoT) technologies have gained extensive adoption in a variety of fields by enabling autonomous connectivity between devices. By 2030, there is expected to be 50 billion IoT devices, with uses ranging from smart cities to healthcare [1, 2]. Nevertheless, the intricate integration of IoT devices on wireless networks, frequently in unsupervised situations, has created vulnerabilities that can be exploited by malevolent actors, bringing with it hitherto unheard-of security concerns. Accessing data and system without proper permission can have dire consequences that can be harmful to the integrity of the data and also jeopardize the health of individuals who rely on critical software [3].
Some dynamic issues could affect the security and efficiency of current networks. Phishing attacks, malware infections, and distributed denial-of-service DDoS could harm the integrity of systems. It will be even harder with IoT since these devices are configured to use minimal parameters while applications are developed independently to fit those environments. Furthermore, these attacks are too fast and sophisticated to detect using regular intrusion detection techniques, hence requiring new systems capable of countering various kinds of attacks.
In such scenarios, intrusion detection systems (IDSs) play an important role by offering hope for monitoring IoT environments through network-based approach. Real-time data packets analysis using such technologies could help detect and prevent malicious activity. But deployment of IDS in IoT environment comes with its own set of problems. These include the necessity to function in demanding environments with low energy, limited processing power, quick reaction times, and the difficult chore of managing enormous amounts of data. A thorough grasp of the inherent security flaws in IoT systems is necessary for the ongoing and vital research effort to improve embedded IDSs for IoT [4]. In this regard, many studies have focused on this area.
Research [5] investigates adversarial challenges in Network Intrusion Detection Systems (NIDS) by employing deep learning (generative adversarial networks) with particle swarm optimization (PSO) and genetic algorithms (GA). The study assesses on NSL-KDD and UNSW-NB15 datasets. Research [6] aims to enhance IDS efficiency through the neural networks, Random Forest, and SVM, with evaluation conducted on standard datasets such as KDD Cup 99. A deep blockchain framework is introduced in [7] for secure distributed intrusion detection and privacy in IoT networks, utilizing a bidirectional long short-term memory algorithm for intrusion detection, assessed on UNSW-NB15 and BoT-IoT. A hybrid IDS (HIDS) for groups is introduced in [8], leveraging a combination of a C5 and SVM classifier for enhanced protection of IoT devices. The model analyzed on the Bot-IoT featuring diverse attacks and legitimate IoT network traffic. A new breach detection system based on misuse integrated classification-based model is introduced in [9], focusing on detecting five groups (Exploit, DOS, Probe, Generic, Normal), utilizing the UNSW-NB15 dataset for model development. A comprehensive study is conducted in [10] on classifiers to advance anomaly-based IDSs, evaluating their effectiveness with reference to the CIDDS-001, UNSW-NB15, and NSL-KDD.
Statistical analyses are utilized to detect significant differences between classifiers, such as the Friedman and Nemenyi tests. While the classifiers’ performance on IoT-dedicated hardware is assessed through the utilization of Raspberry Pi, examining the time it takes for the classifiers to respond. An IDS is introduced in [11], employing an advance advanced deep convolutional neural network DCNN for car CAN bus protection. The DCNN, tailored for CAN bus data traffic, autonomously learns network patterns, achieving high detection performance, and is evaluated on datasets created from real vehicle scenarios. A mechanism for combining and stacking features across multiple dimensions, termed multi-dimensional feature fusion and stacking ensemble mechanism is proposed in [12] for effective detection of abnormal behaviors, utilizing multiple basic feature datasets derived from diverse aspects of traffic information. Experimental results is performed on datasets KDD Cup 99, NSL-KDD, UNSW-NB15, and CIC-IDS2017.
A federated learning scheme is proposed in [13] utilizing local training and inference to protect data privacy in IoT intrusion detection. Updates from the devices are sent to a distant server, which compiles and disseminates an improved detection model, and evaluated on an NSL-KDD to assess its efficiency. GA-based Feature Selection (GbFS), an improved GA for feature selection technique, is introduced in [14]. The method, incorporating parameter tuning and a novel fitness function, is analyzed on CIRA-CIC-DOHBrw-2020, UNSW-NB15, and Bot-IoT. A CNN intrusion approach is developed in [15]. This DL-based model specifically targets DoS attacks, utilizing the widely used KDD CUP 99 and the more advanced CSE-CIC-IDS2018 dataset. In [16], a novel anomaly detection method called MDS_AD is presented. It combines PCA, isolation forest, and locality-sensitive hashing (LSH) approaches to effectively address challenges in anomaly detection, particularly for multi-aspect data. The approach is validated via experiments undertaken on the UNSW-NB15 dataset.
Research [17] introduces an algorithm that leverages a GA in combination with 5-fold cross-validation to identify the bagging classifier and optimize the structure of a CNN model for impactful feature extraction. Research [18], deploys logistic regression (LR), naive Bayes (NB), and decision tree (DT) with a voting classifier, exhibiting greater accuracy in comparison to current cutting-edge methods. The proficiency of the suggested method is examined using the CICIDS2017 dataset. The suggested approach in [19] addresses the need for a well-organized classification methodology by applying ML approaches, specifically SVM and NB, on the NSL-KDD. In [20], a model is created, combining enhanced random forest (IRF) techniques with enhanced GA and PSO (EGA-PSO) for feature selection and classification. The model is examined on the NSL-KDD ID Tree (IntruDTree). A security concept based on machine learning is presented in [21]. The model demonstrates effectiveness in prediction accuracy and computational complexity reduction by minimizing feature dimensions, evaluated on cybersecurity datasets with criteria such as precision, recall, F1 score, accuracy, and ROC values.
A flexible IDS which is efficient, developed in [22] using a deep neural network (DNN), exploring various datasets generated through static and dynamic approaches to identify the optimal algorithm for detecting future cyberattacks. Experiments run on KDD Cup 99, NSL-KDD, UNSW-NB15, Kyoto, WSN-DS, and CICIDS 2017. A ML-based IDS is suggested in [23] for detecting IoT attacks, utilizing ML-supervised algorithms on the UNSW-NB15. The paper employs feature scaling, normalization, and Principal PCA dimensionality reduction. In [24], four feature subsets taken from the NSLKDD are used for intrusion detection using SVM, K-nearest neighbor, LR, NB, MLP, RF, Extra-tree classifier (ETC), and DT. Research [25] evaluates the influence of hyper-parameters on the results of ANNs for ID, conducting examinations on the NSL-KDD and CICIDS2017. An intrusion detection model is proposed in [26], utilizing machine learning to identify cyberattacks in IoT networks with limited resources. The model is improved by sampling, eliminating multicollinearity, and testing on the CICIDS2017 and NSL-KDD datasets. A smart IDS named Passban is presented in [27], as a method that can safeguard IoT devices, which are directly connected. This model demonstrates detection of several kinds of malicious traffic, including SYN flood assaults, HTTP and SSH brute force attacks, and port scanning. In [28], deep learning architectures are put out as a means of creating a robust and adaptable network IDS, with a focus on their capacity to identify both known and novel network behavioral characteristics. The UNSW-NB15 is used to illustrate the method’s efficacy.
Research [29] suggests a new way of finding and stopping attacks on a blockchain system by using data fusion and clustering features. While the AI model is responsible for validating and arranging data in a blockchain network, it merges them through a statically predetermined math element. In the same scope, we present in Research [30] a network attack detection application enhanced by attaching an unconventional DNN coupled with Q-learning. The bonus to the detector is that it learns and configures its settings on its own. Most attacks on NSL-KDD can be detected and stopped using this concept.
This research proposes a new solution for the detection of intrusions on IoT networks based on ML algorithms and feature selection methods. There is still a critical gap in solving complex relationships between features, especially when linear dependency does not exist. The main contributions are as follows.
(1) The proposed algorithm fills gap by introducing the Chatterjee correlation coefficient and proposing it as a tool for innovative feature selection based on impact factor in the Artificial Bee Colony (ABC) optimization algorithm. Another goal is to reduce the computational requirements of other methods and better distill complex patterns from IoT sensor data using a modified Residual Neural Network (ResNet).
(2) The proposed approach operates in four stages. The initial selection of features shall be made with the Chatterjee correlation coefficient, which shows relevant characteristics necessary to identify intrusions.
(3) In order to ensure a well-balanced and usable subset of features, the feature selection process is then optimized by means of an ABC method.
(4) After this, a method is implemented to convert selected 1D features into 2D images and optimize their input so that it can be used in the next application of your custom ResNet.
(5) The final phase involves the ResNet-based classification, where the network’s architecture is strategically configured to capture intricate relationships within the feature space.
The rest of this paper is structured as follows. In Section 2, we explore the dataset and offer an in-depth analysis of the dataset, which are used in our research. The technique, serves as the foundation for our paper, is presented in Section 3 and includes a breakdown of every stage of our unique IDS. In Section 4, we go over the metrics and criteria, which were utilized to assess how well our suggested IDS performed. The simulation results will be discussed in Section 5 where we shall introduce and explore our empirical findings that demonstrate the efficiency of our approach. Section 6 concerns the comparison where we conduct an in-depth analysis of our suggested method with the other IDSs that exist. In Section 7, we conclude our work by analyzing the implications of our study and making conclusions.
Recent research papers published in the Journal of Mobile Multimedia also stress the need for IoT/IIoT intrusion detection models with balanced detection efficiency, computational cost, privacy, and robustness in the constrained environment [47, 48]. This is another reason for designing the proposed feature selection-based deep learning framework.
To understand the technical contributions, it is important to interpret the developed framework not as just a simple concatenation of existing techniques but as a well-coordinated pipeline. For the purpose of quantifying nonlinear feature-target relationship, Chatterjee correlation is considered; in order to find the minimum number of features, which will not be highly redundant, an ABC optimization is applied; 1D-to-2D transformation is used for convolutional residual learning; finally, ResNet does binary classification. This division of roles reduces the burden on the classifier and strengthens the representation of nonlinear network-traffic patterns.
2 Dataset
2.1 NSL-KDD Dataset
The NSL-KDD was first introduced and published in [31]. The authors proposed this dataset as an enhanced iteration of the initial KDD Cup 99, which had been widely used but was recognized to have certain limitations. In order to overcome these drawbacks and offer a more demanding and realistic benchmark for assessing IDS, the NSL-KDD was developed. It includes important records from the entire KDD dataset and provides scholars with downloadable files. In order to ensure impartiality, redundant records shall be removed in a systematic manner. In order to carry out thorough tests, this creates a logical distribution of records between train and test data sets. The difficulty levels of the records are taken into account during the dataset selection process in inverse proportion to the record percentages in the original KDD dataset. Every NSL-KDD record has 41 attributes that describe different flow features and a label that either indicates an offensive mode or typical behavior. One normal class and one attack class, comprising the four attack types (DoS, Probe, R2L, U2R) are captured by the 42nd attribute. The format of this dataset makes it easy to apply the dataset in evaluating the real-world network security scenarios and helps in the formulation of the intrusion detection models [32]. For the purpose of replicating our experiment, we have provided the features of the dataset and the experimental split used in this paper in Table 1.
Table 1 Characteristics of the NSL-KDD dataset used in this study
| Item | Description |
| Dataset | NSL-KDD intrusion detection benchmark |
| Dataset source | Public NSL-KDD benchmark derived from KDD Cup 99; cited in [31, 32] |
| Input dimensionality | 41 input features and one class label |
| Classification setting | Binary classification: normal traffic versus attack traffic |
| Attack categories represented | DoS, Probe, R2L and U2R attack families |
| Samples used in the reported experiment | 12,597 records, based on the training and testing confusion-matrix totals |
| Training/testing split | 70:30 holdout split: 8818 training records and 3779 testing records |
| Preprocessing | Min-Max normalization, KNN-based missing-value imputation, label encoding and holdout partitioning |
| Selected features after Chatterjee-ABC optimization | 24 features selected from the original 41-dimensional feature space |
2.2 Preprocessing Stages
In the data pre-processing stage, we utilized three vital methods to improve our data quality.
2.2.1 Min-Max scaling
We utilized this method for scaling our values into a particular range, where all numeric values contribute equally to our analysis. This is done using:
| (1) |
where and represent the minimum and maximum values, respectively, while X shows the initial feature value.
2.2.2 Data cleaning using K-nearest neighbors (KNN)
For the missing data, KNN imputation was used. Here, KNN imputation works by predicting the values of the missing data based on the quantity of its nearest neighbors. Specifically, in the present case where , it means that the KNN imputation finds the four nearest neighbors of the missing data and averages them or combine them to estimate the missing data. In the calculation of the nearest neighbors, Euclidean Distance is commonly used:
| (2) |
2.2.3 Partitioning of data using the holdout method
The holdout method is adopted to partition the data set into two partitions where 30% data is kept for testing purposes while the remaining is for training. The holdout method randomly partitions the data set into two parts, one which serves as the training data and the other as testing data. This will make our IDS robust and accurate due to objective evaluation of its generalization capabilities.
3 Methodology
This section begins by giving a thorough analysis of the fundamental algorithms and ideas that are necessary to lay the groundwork for the suggested method. Thereafter, a comprehensive and detailed description of the proposed approach is provided in addition to all its minute details.
3.1 Chatterjee Correlation Coefficient
This technique, which was recently introduced in correlation analysis, is useful for the analysis of nonlinear interactions in datasets. Examine a dataset with being non-constant, represented as . To compute the Chatterjee correlation coefficient, we assume ordered inputs as , arranged such that . If set has no duplicate data, then a unique state is created. The parameter , or rank, is determined as the count of for each where . Chatterjee correlation coefficient in this scenario is calculated using (3):
| (3) |
where is the quantity of instances in each set of and .
In cases where duplicate data exists in the X-set, one of the conditions, in which the s are arranged randomly in increments the same as the previous explanation, is considered. Assuming the earlier definition for , the parameter is established as the count of where . The Chatterjee correlation coefficient is then defined as (4):
| (4) |
where is the new parameter defined for the presence of duplicate data. These formulations provide a robust means to compute the Chatterjee correlation coefficient, accommodating both scenarios of dataset configurations [33].
3.2 Artificial Bee Colony Optimization Algorithm
The behavior of individual insects is governed by a few basic rules that support the self-organization of bees, particularly evident in complex tasks such as the organized collection and processing of nectar. Bees decide to forage based on dances performed by nestmates, creating a structured dance floor area for communication. Upon reaching a nectar source, a bee may either abandon, continue foraging, or recruit nestmates through dancing. The decision is probabilistic [34].
To gain insights into the fundamental behavioral traits of foragers, let us analyze Figure 1. Imagine two recognized food supplies have been identified, A and B. Initially, a prospective forager is an unemployed bee with no knowledge of nearby food sources. This bee faces two options: it can act as a scout, spontaneously exploring the surroundings for food based on internal motivation or external cues (denoted as S in Figure 1), or it can become a recruit by observing waggle dances and then search for a food source (denoted as R in Figure 1). Once a food source is found, the bee memorizes its location and transforms into an employed forager.
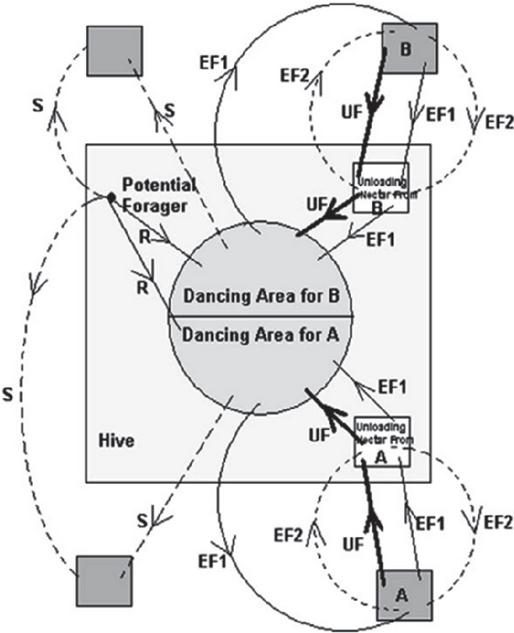
Figure 1 Fundamental behavioral traits of bees searching for nectar [33].
After returning to the hive and unloading the nectar, the forager bee has several choices: it may become an uncommitted follower by abandoning the food source (UF), Before returning to the same food source, dance and recruit nestmates (EF1), or carry-on foraging without recruiting (EF2). Interestingly, not every bee starts foraging at the same time. Research verifies that fresh bees start foraging in proportion to the distinction in the overall quantity of bees that will eventually exist and the population of bees that are currently foraging [35]. The ABC algorithm, developed by Karaboga in 2005, draws inspiration from the foraging conduct of honeybees as they seek nourishment (nectar) for their colony. This swarm-based metaheuristic algorithm is designed for optimizing NP-hard problems, relying on the principles of autonomous coordination and task specialization to achieve swarm intelligence. The ABC consists of worker bees attached to particular food sources, observer bees watching dances to identify a food source, and scout bees haphazardly seeking for food. Initially, scouts locate available food sources, and then utilized and onlooker bees exploit the nectar. As bees become exhausted, the employed bees may turn into scouts to seek additional nourishment positions. In the technique, the place of a nutritional reservoir shows a feasible answer, and the nectar quantity matches with the solution’s grade. Initialization, employed bee phase, spectator bee phase, and scout bee phase are the four stages of the ABC technique [36].
3.2.1 Initialization
The ABC begins by haphazardly selecting potential solutions (food sources) for employed bees. The solutions are generated using (5).
| (5) |
in which is the th dimension of the th employed bee, is a randomized digit in [0, 1], is the dimensionality of the issue, and is the size of the swarm. Every used bee’s abandonment counter (AC) gets reset.
3.2.2 Employed bee phase
Each used bee produces a new candidate solution by updating one parameter using the (6).
| (6) |
where is unity, is a randomly selected candidate in the neighborhood, and are distinct members from the same collection. is a random number in [1, 1]. Fitness values are calculated using (7).
| (7) |
in which is the objective function value. If the fresh answer improves fitness, it substitutes the existing solution, and the AC is reset; otherwise, the AC is improved.
3.2.3 Onlooker bee phase
Onlooker bees select used bees based on fitness probabilities determined by Roulette wheel selection. Using the same equation as in the employed Bee Phase, the answer provided by the selected employed bee is enhanced. If the new solution’s fitness is superior, the onlooker bee replaces the employed bee, resetting the AC; otherwise, the AC is increased. The likelihood of choosing the th employed bee is determined through the process of Roulette wheel selection using the (8).
| (8) |
3.2.4 Phase of the scout bee
After checking the hired bees’ abandonment counters, those who surpass a certain threshold are turned into scout bees. Scout bees use the initialization equation to come up with fresh solutions. The scout bee turns into an employed bee once more after the abandonment counter is reset, preventing population stagnation [37].
3.3 Residual Neural Network
Over the course of time, significant advancements in image recognition and classification have been achieved through the progression of deep convolutional neural networks [38]. As networks delve into more intricate tasks, challenges such as the vanishing gradient problem arise. In the case of excessively deep networks, the ability to learn even simpler problems may be compromised. The degradation problem is the result of a model’s accuracy gradually declining when its layers are continuously increased to a point where it saturates [39]. introduced the residual learning framework to address these problems by training very deep models through residual functions and skip connections [40]. Residual network variants have subsequently been applied successfully in image classification tasks, including medical image classification [41].
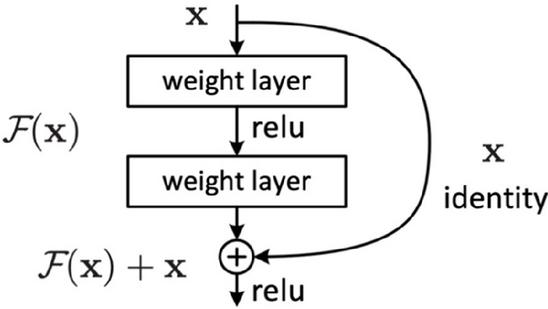
Figure 2 Block building of residual network [40].
This residual-learning design provides the basis for the ResNet architecture used in the proposed intrusion-detection framework. Residual networks are made up of ResNet blocks, as shown in Figure 2. From Figure 2, there are some layers that make use of skip connections. Let us assume a neural network that receives an input and approximates . Their difference will be referred to as from the Equation (9).
| (9) |
acts like a residual function, and proposing several layers to approximate complicated functions is similar to the proposition of approximating residual functions through such layers asymptotically. The idea behind introducing the layers in the residual block is the approximation of the residual function , which leads to Equation (10).
| (10) |
Therefore, the main function is stated as , as is clearly illustrated in Figure 2.
With the help of skip connections, large gradients can be propagated back into the earlier layers. The process ensures that the early layers learn at the same pace as the later layers, thus resolving the problem of vanishing gradients [42].
3.4 Proposed Method
Intrusion detection in IoT network has become increasingly difficult to carry out with the changing nature of technology. It has been very difficult to use the unique attributes of the networked systems to detect any form of intrusion in order to thwart any attack. The NSL-KDD dataset has been useful in tackling this problem through provision of a wide variety of features for intrusion detection purposes. However, with 41 input features, the dataset is very high dimensional, and hence there is need for a feature selection technique that works. Feature selection is crucial for improvement of classification performance, minimization of processing burden, and avoiding overfitting. It becomes very important in this context to look for the features that are less similar to each other but are highly relevant to the target variable. Traditional techniques often neglect the nonlinear relations between variables. The Chatterjee correlation coefficient proposed in recent years offers an innovative approach by finding nonlinear correlations between two vectors. This technique stands apart from the traditional methods like the Pearson correlation due to this reason. Figure 3 represents the advantage of the Chatterjee correlation coefficient over other methods, particularly in detecting complex relationships. Considering these points, the present paper recommends the use of Chatterjee correlation coefficient as a reliable way to calculate similarity between pairs of features and dissimilarity between features and targets.
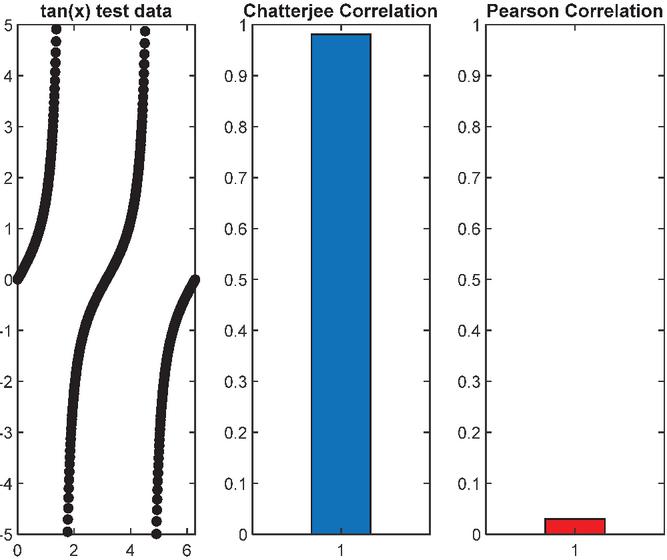
Figure 3 Comparison between the Chatterjee and Pearson correlation coefficients in detecting the non-linear correlation of the function tan(x).
The use of the Chatterjee correlation as a feature subset scoring technique emphasizes its nature as a tool of assessment and not as an algorithm for subset selection. The need for an algorithm to enable dynamic selection of feature subsets is critical and, from the above discussion, it is evident that metaheuristic optimization algorithms have great potential due to their fast convergence properties and minimal number of trials. Of the metaheuristic optimization algorithms, ABC algorithm emerges as a leading metaheuristic optimization algorithm due to its capability to search complex solution spaces and converge at global optima.
The proposed feature selection technique employs the ABC algorithm by virtue of its capability to search solution spaces. The Chatterjee correlation coefficient forms an important aspect of the cost function, as indicated by the following equations in Section 3.1. The correlation matrix started to accommodate this, as follows:
| (13) | |
| (18) |
where is the proposed correlation matrix, The selected subset’s number of characteristics is , is the th feature vector, is the th feature vector, is the length of the feature vectors, is the target vector, and is Chatterjee correlation coefficient.
By calculating the reverse Chatterjee correlation coefficient in the elements on the oblique of the confusion matrix, the level of correlation between the selected features and the target variable is assessed. Features exhibiting low absolute Chatterjee correlation values indicate significant differences between their distributions and the target, with lower diagonal values indicating higher similarity between feature and target distributions – an objective in feature selection.
This principle extends to other elements of the matrix, where lower values for non-diagonal elements suggest greater dissimilarity between each pair of selected features, contributing to the reduction of redundant information. Consequently, a lower value for each element of the matrix signifies an improved situation for feature selection. Moreover, considering the asymmetry of the Chatterjee correlation , the is strategically designed to incorporate both terms, ensuring a comprehensive representation of the feature relationships.
Next, the summation of all elements of the matrix can be calculated in order to obtain the final cost value. However, to address the potential bias favoring smaller subsets in the cost calculation due to the summation of all matrix elements, a normalization approach is adopted to ensure a fair evaluation of subsets. This adjustment is crucial as smaller subsets inherently possess fewer elements, potentially leading to consistently lower cost values. In light of this, the normalized cost function for the ABC algorithm is formulated as follows:
| (19) |
where Cost is the proposed Chatterjee-correlation-based cost function. This normalization process ensures that the cost is not unduly influenced by the subset size, providing an equitable basis for the ABC algorithm to assess and select feature subsets. The objective is to promote a balanced evaluation that considers both the quality of the features and their interrelationships, ultimately contributing to the intrusion detection method’s efficacy. Following the formulation of the normalized cost function, the decision variables for feature selection are defined as binary flags, serving as indicators for whether a corresponding feature should be retained (assigned a value of 1) or discarded (assigned a value of 0). With the goal of choosing a subset of characteristics that minimizes the cost function, the optimization process iteratively and methodically modifies these choice variables.
3.4.1 Chatterjee-ABC feature selection formulation
The combination of the Chatterjee correlation and ABC optimization is defined as follows for the sake of reproducibility. Let denote the original feature set, where for the NSL-KDD dataset. A candidate solution in the ABC algorithm is encoded as a binary vector , where indicates that feature is retained and indicates that it is discarded. Each food source in the ABC population therefore represents one candidate feature subset.
For a selected subset S, Chatterjee correlation is used in two complementary ways: (i) to estimate nonlinear relevance between each selected feature and the target class , and (ii) to estimate redundancy among selected features. The optimization objective is to minimize redundancy while maximizing feature-target relevance and controlling subset size:
| (20) |
In Equation (3.4.1), denotes the Chatterjee correlation coefficient, balances relevance and redundancy, penalizes unnecessarily large subsets, is the number of selected features, and is the original number of features. The ABC algorithm searches for the binary vector that minimizes . The resulting is then used to filter the original NSL-KDD records before the 1D-to-2D transformation and ResNet classification stages.
Algorithm 1 summarizes the revised feature-selection pipeline. Step 1: normalize and clean the NSL-KDD records. Step 2: initialize ABC food sources as binary feature-selection vectors. Step 3: evaluate each food source using the Chatterjee-based objective in Equation (3.4.1). Step 4: update employed, onlooker and scout bees according to the ABC equations. Step 5: retain the best binary vector S*. Step 6: construct the reduced feature matrix using S*. Step 7: transform the reduced 1D vector into the proposed 2D matrix and train the ResNet classifier.
Afterwards, in order to take use of the ResNet network’s ability to capture complex correlations between features, an efficient way to translate the 1D feature vector into 2D images is developed. To perform this transformation, a diagonal matrix of size nn must be created, with all of the specified characteristics housed in the major diagonal. At the same time, in order to maintain the uniformity of the spacing between the features and to ensure that filters can catch all of them, these features are arranged in a different sequence by the secondary diagonal.
To obtain a normalized distance measure, we split the feature vector into two halves and then swap them diagonally. A systematic process of this technique, demonstrated in Figure 4, produces uniformly disturbed characteristic distances where superior distance between features will enable the ResNet network to make sense of more intricate connections through them.
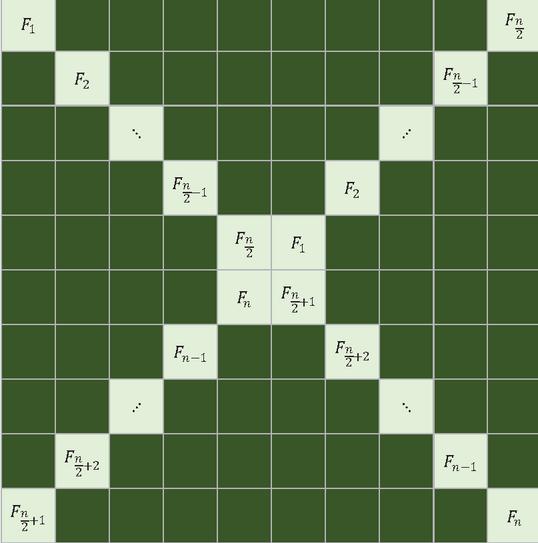
Figure 4 Method for converting 1D features space to a 2D feature matrix is proposed.
3.4.2 Rationale for the 1D-to-2D feature transformation
The selected NSL-KDD attributes are tabular variables and do not possess natural image-like spatial locality. Therefore, the proposed transformation is not intended to claim physical spatial relationships among features. Instead, it provides a structured representation that enables convolutional filters to learn local interactions among selected features while preserving the original feature values.
The transformation does not generate synthetic features and does not alter the numerical value of any selected feature. It only reorganizes the selected 1D vector into a matrix by distributing features along the main and secondary diagonals. This arrangement reduces arbitrary adjacency effects by exposing each selected feature to multiple filter neighborhoods. Possible artificial adjacency effects are acknowledged and should be interpreted as an architectural design choice rather than as a physical correlation between variables.
A direct 1D-CNN can also be used for tabular intrusion detection. However, the proposed 2D arrangement was adopted to exploit the residual 2D convolutional structure of ResNet and to test whether matrix-based residual learning improves representation learning after Chatterjee-ABC feature reduction. This point is now explicitly separated from the feature-selection contribution so that the transformation can be evaluated independently in ablation experiments.
For the classification step after preprocessing input images, the final part of our methodology uses a tailored ResNet adapted for functionality with worker/citizen data. This specific ResNet is designed to reduce the computational burden of regular residual neural networks while still being able to represent complex relationships.
The suggested architecture has three residual blocks, each serving a purpose for learning complex patterns on different hierarchical levels. These blocks provide the model with both high- and low-level characteristics. ResNet understands the input better through the production of three stacks of such blocks, consisting of 4, 3, and 2 residual blocks, respectively. The usage of the number of filters in the blocks equal to 16, 32, and 64 makes the process of filtering more effective. With time, the sequence of these changes leads to increasingly complex layers of abstraction, needed for discovering exotic design patterns or intrusion detection.
The first convolutional layers with a stride of 1, filter size of 3, and starting number of filters of 16 are essential in preparing the ground for learning. This will enable us to capture the spatial information from the inputs while capturing useful features. The thought process behind such architecture design is based on the complexities of ID. The selective positioning of residual blocks and the scaling down of feature maps also enable the network to learn both local and global dependencies over input data.
Since the first layers are progressively better at picking up underlying differences after fine-tuning, this setup could rapidly extract informative representations. The aim of this ResNet setup is a higher recognition rate, distinguishing between general and anomalous network behavior using hierarchical learning abilities. Proceeding from the intentional location of residual blocks and gradual increases in filter count, it reinforced that the right placement of deep blocks trains only for feature extraction and abstraction, leading to an accurate intrusion detection tool. The configuration of the planned network is presented graphically in Figure 5. Additionally, the flowchart for the suggested solution using the aforementioned stages is shown in Figure 6.
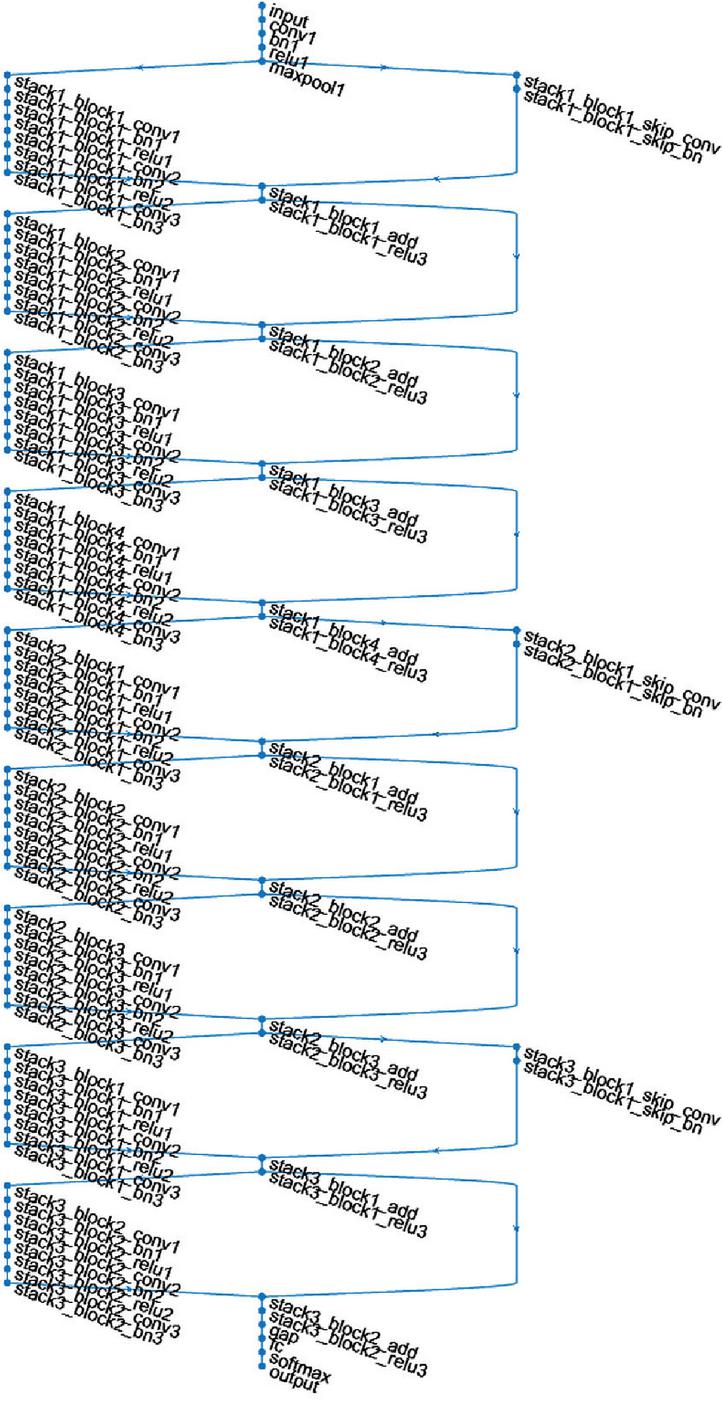
Figure 5 Proposed ResNet architecture.
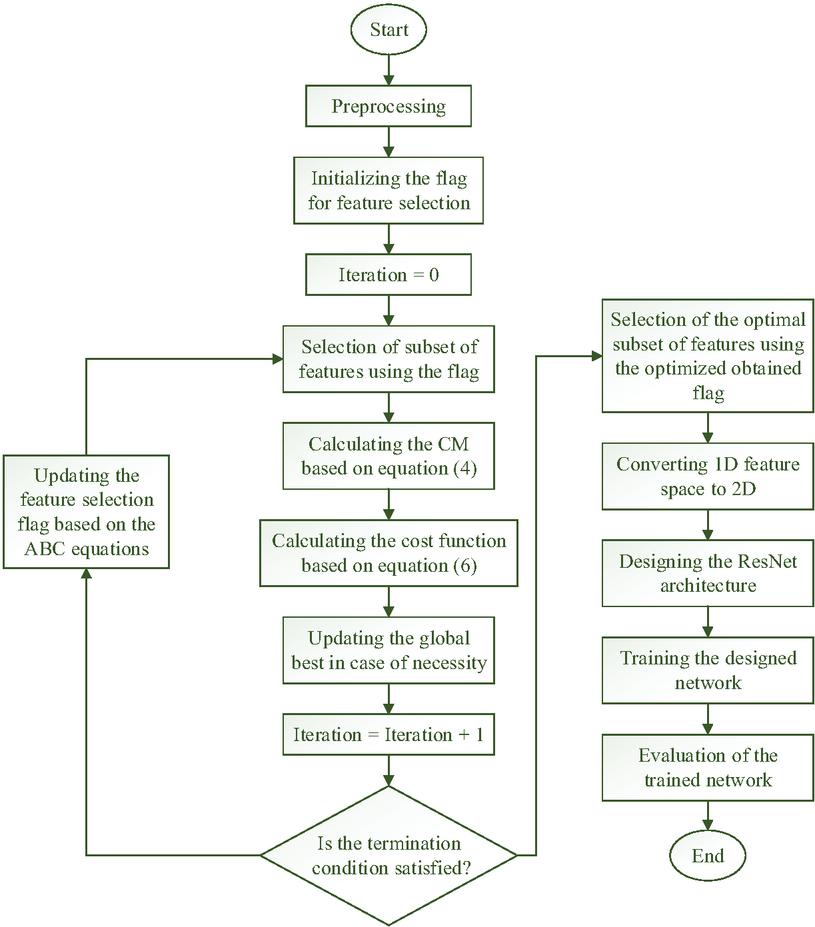
Figure 6 Flowchart of the proposed method.
4 Evaluation Metrics
Evaluation metrics are vital in assessing the performance of IDSs (IDS). These metrics help quantify the ability of IDS to accurately detect and categorize network intrusions.
4.1 Accuracy
The ratio of accurately classified cases to the overall cases is used to determine accuracy, which is a measure of overall correctness
| (21) |
4.2 Precision
This parameter is articulated as the quotient of true positives over the entirety of instances identified as positive, serving as a gauge for the correctness of positive predictions
| (22) |
4.3 Recall
Recall measures the ability to find every possible positive event and is calculated as the number of true positives compared with all actual positives
| (23) |
4.4 F1 Score
This harmonic mean-derived parameter provides an overall evaluation by keeping a good balance between recall and precision. Detection rate measures the proportion of actual attack records correctly detected. In binary intrusion detection, it is equivalent to recall for the attack class
| (24) |
4.5 Detection Rate (DR)
False Positive Rate refers to the rate of normal transactions which were erroneously marked as attacks and is crucial in implementing an IDS because an alarmingly high number of false positives increases analyst workload
| (25) |
4.6 False Positive Rate (FPR)
| (26) |
In these above equations
• True Positives (TP): Items properly identified as positive.
• True Negatives (TN): Negative outcomes correctly identified.
• False Positives (FP): Items incorrectly classified as positive.
• False Negatives (FN): Positive items incorrectly classified as negative.
4.7 Precision-Recall Balance
This is very important in IDS. F1 Score, which is the combined result of all these factors since rare events happen in real time, is highly important. Depending on the exact security case, other metrics can be more important than others.
5 Simulation Results
Below are the descriptions regarding the methodology adopted to evaluate the proposed intrusion detection scheme.
5.1 Feature Selection
Utilization of the ABC approach together with the Chatterjee correlation coefficient is critical during the feature selection process. Evaluation of the simulation results is done with respect to the convergence of the ABC approach together with the heat map of Chatterjee correlation coefficient. The first critical stage of this approach is a change in the parameters of the ABC algorithm. In our case study, after thorough analysis, we set the maximal number of iterations to 12 and population size to 4. This tuning is based on the compromise between execution time and number of evaluation points. This will take more computation time; however, it will provide a better optimization result. It can be so because a larger population requires more time for the computation but explores more of the solution space. Our choice of the parameter values tries to find a good balance between computation efficiency and optimization performance. The convergence plot of the ABC method depending on the number of iterations is presented in Figure 7. The number of function evaluations is plotted by the x-axis, while the convergence rate is plotted by the y-axis. Figure 7 presents the efficiency of the algorithm in optimizing the feature subset in each iteration. The parameters that are used allow us to make the ABC method converge under certain restrictions.
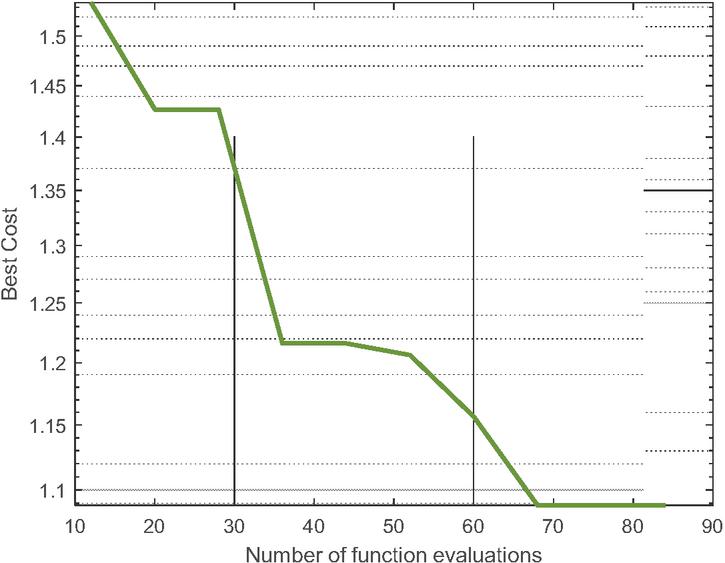
Figure 7 Convergence curve of the ABC optimization algorithm for feature selection.
Post feature selection, there are a total of 24 selected features which become the final optimal features. Figure 8 displays the heatmap created for the selected features with respect to the Chatterjee correlation coefficients. Each cell in the heatmap depicts the correlation between the two features. The yellow colors represent the high correlation value, whereas the green color indicates low correlation. The final selected subset contains the following 24 features: protocol_type, service, flag, src_bytes, num_failed_logins, logged_in, root_shell, num_file_creations, count, srv_count, serror_rate, srv_serror_rate, rerror_rate, same_srv_rate, diff_srv_rate, srv_diff_host_rate, dst_host_count, dst_host_srv_count, dst_host_same_srv_rate, dst_host_diff_srv_rate, dst_host_ same_src_port_rate, dst_host_serror_rate, dst_host_rerror_rate and dst_host_srv_ rerror_rate. Contrary to the aforementioned analysis, apart from depicting the low correlation between each of the pairs of selected features, the heat map also denotes the deletion of any redundant features. This result demonstrates an exceptional capability of deriving unique qualities from each selected feature, indicating the effectiveness of our approach in eliminating redundancy. The low correlation ensures that each of the selected features has its own unique quality.
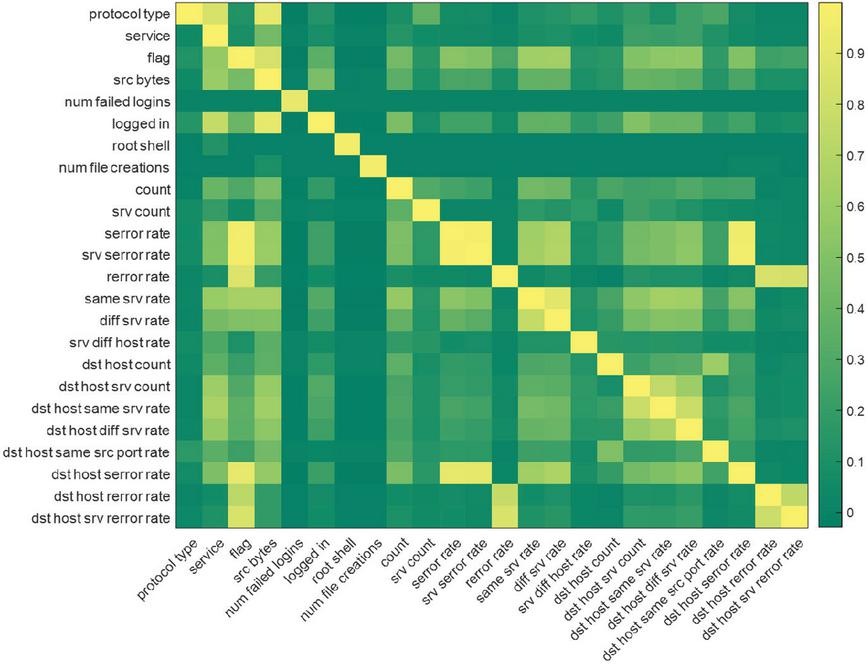
Figure 8 Chatterjee correlation heatmap of the selected features.
Lastly, the maximum number of epochs to be used is 100 while the batch size is 16. Such choices are made with the intention of balancing the speed of convergence and classification accuracy. The use of ADAM optimization algorithm is favored because of its fast convergence and other good qualities that improve efficiency during training of the model. This is illustrated in Figure 9.
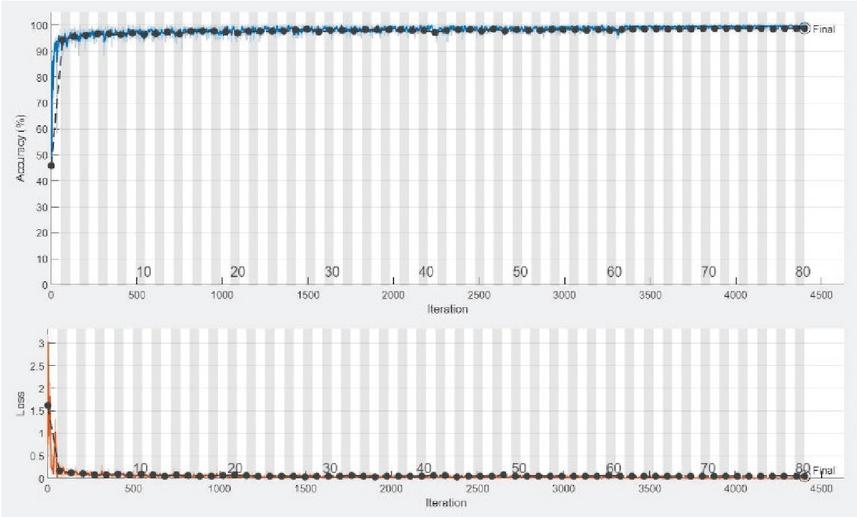
Figure 9 Optimization progress of the designed ResNet.
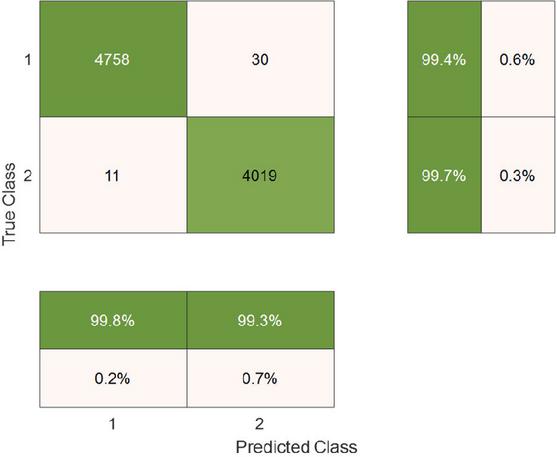
Figure 10 Confusion matrix for training data.
5.2 Confusion Matrix
The proposed IDS’s performance is analyzed through confusion matrices, which provide a comprehensive classification outcome analysis through true positives (correct classifications of intrusions), true negatives (correct classification of non-intrusions), false positives (classification of non-intrusions as intrusions) and false negatives (classification of intrusions as non-intrusions). The confusion matrices for the training phase and testing phases are shown in Figures 10 and 11. The comprehensive confusion matrices analysis forms the basis for further investigation into the ROC curves and performance measures which enable a thorough examination of the IDS’s performance in various cases of network intrusion. Analysis of the confusion matrix in Figure 10 shows prominent diagonal elements showing the precision of classification of each class; however, careful consideration of the off-diagonal elements is required to understand the misclassifications. Moreover, in Figure 11, evaluation matrix is shown that depicts how much the model has learned to apply to new data and possible problems of a particular category.
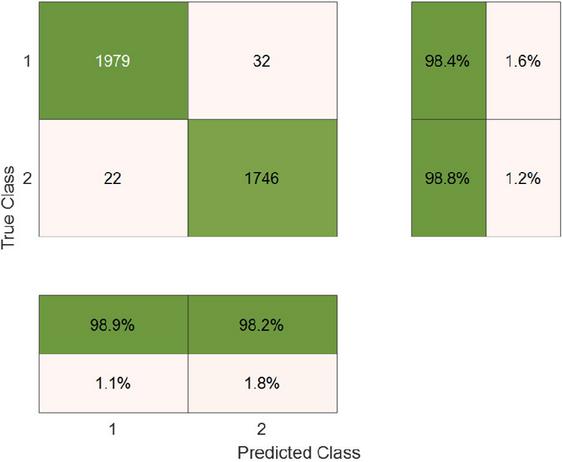
Figure 11 Confusion matrix for test data.
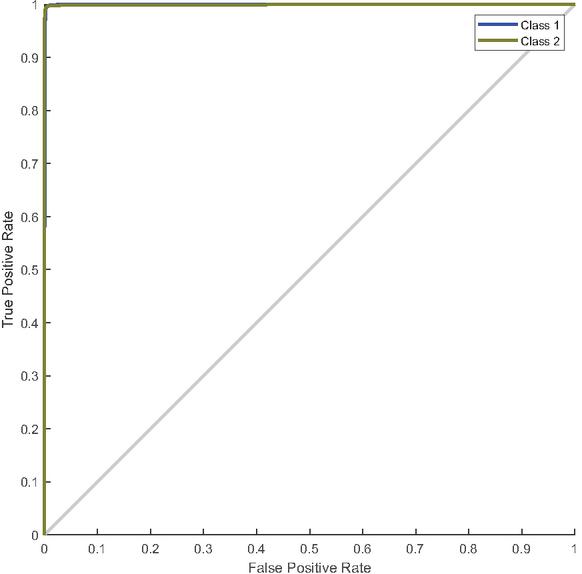
Figure 12 ROC curve for training data.
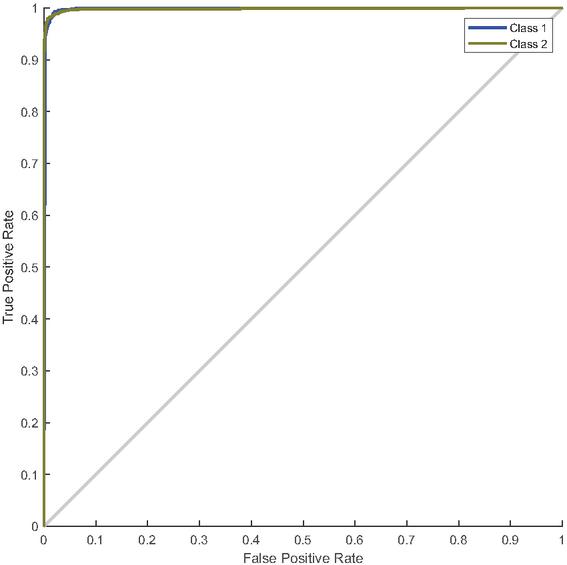
Figure 13 ROC curve for test data.
5.3 Receiver Operating Characteristics (ROC) Curve
The above data is essential in determining the ability of the suggested identification process in telling the difference between normal and attack cases – the ROC curve can help with this purpose. The ROC curve presents an index of the predictive ability of a model through the plot of true positive rate vs. false positive rate at various decision levels. Figures 12 and 13 represent the ROC curve of the testing stage and the ROC curve of the training stage where perfect performance occurs. In the end stages of detecting intrusion, these curves present a wider view on the sensitivity of the model to identify the intrusions with different attacks not only in one but in two stages. Further analysis of the ROC curve (area under the curve) may help to determine how good your model operates at various decision thresholds. This will give you a complete view about the capability of your model in balancing the trade-off between specificity and sensitivity in order to effectively detect the intrusions. Further performance metric analysis in later sections gives you better insight into the performance of this.process.
5.4 Performance Evaluation Utilizing Assessment Metrics
The outcome of the last intrusion detection assessment has been shown through Figures 14 and 15. The above-mentioned graphs clearly reveal a substantial improvement in intrusion detection with the precision rate of 99.727% and 98.7557% as well as accuracy rate of 99.535% and 98.5711%. These outcomes demonstrate the exceptional proficiency of the ResNet in detecting intrusions and the usefulness of feature selection using the Chatterjee and ABC algorithms. The substantial increase in intrusion detection accuracy demonstrates the network’s effectiveness not only in thwarting attacks but also in effectively managing challenges and adapting to dynamic threats within the network environment.
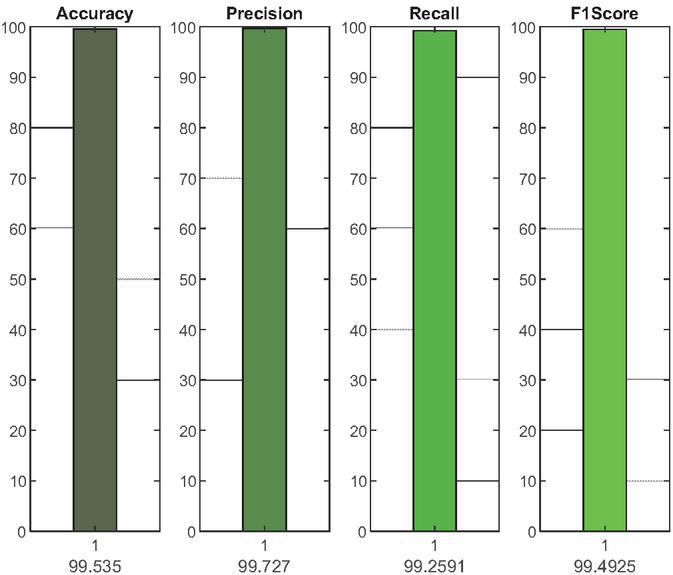
Figure 14 Evaluation of modelling using evaluation metrics for training dataset.
To strengthen the robustness evidence, future re-runs of the implementation should report repeated holdout or k-fold cross-validation results as mean standard deviation. This is particularly important because the current experimental evidence is based on a single holdout split. The present revision therefore clarifies the validation design and explicitly identifies cross-validation as the required robustness extension before deployment-level claims are made.
Additional deployment-oriented metrics were derived from the testing confusion matrix in Figure 11. Treating Class 2 as the intrusion class, the test false-positive rate is , and the detection rate is . These values complement the accuracy, precision, recall, and F1-score values and provide a clearer assessment of IDS behavior in terms of missed attacks and false alarms.
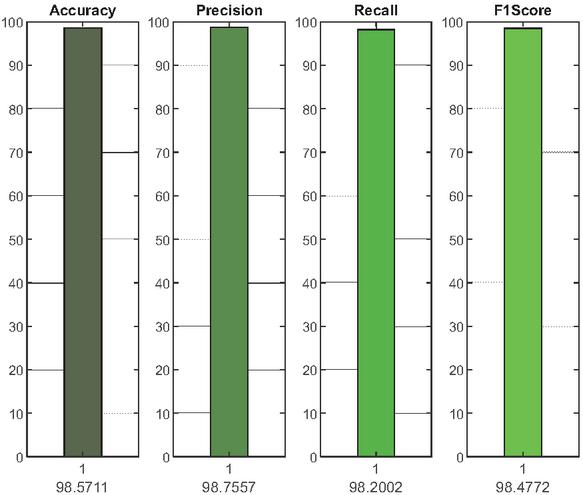
Figure 15 Evaluation of modelling using evaluation metrics for test dataset.
5.5 Ablation and Robustness Analysis
The ablation design separates the contribution of each major component by isolating the roles of nonlinear feature relevance, ABC optimization, 1D-to-2D feature mapping and residual classification. Table 2 defines a reproducible component-level evaluation matrix for reporting the effect of each module. In the full model, the Chatterjee-ABC feature selector reduces the original 41 features to 24 selected features, and the ResNet classifier achieves 98.5711% testing accuracy. The same training/testing split, preprocessing steps, random seed control and performance metrics are required for all variants to ensure a fair component-level comparison.
Table 2 Ablation matrix for isolating the contribution of each component in the proposed IDS framework
| Variant | Feature Selection | Feature Representation | Classifier | Purpose of Comparison |
| Full proposed model | Chatterjee+ABC, 24 features | 2D matrix | Customized ResNet | Baseline full framework; reported test accuracy 98.5711% |
| Without ABC optimization | Chatterjee-ranked features only | 2D matrix | Customized ResNet | Tests the benefit of population-based subset search |
| Without Chatterjee relevance | ABC with conventional/fitness-only scoring | 2D matrix | Customized ResNet | Tests the benefit of nonlinear correlation-based relevance |
| Without 1D-to-2D transformation | Chatterjee+ABC | 1D vector | 1D-CNN or MLP | Tests whether the 2D arrangement improves residual learning |
| Without feature selection | All 41 features | 2D matrix or 1D vector | ResNet/1D-CNN | Tests whether feature reduction improves accuracy and complexity |
| Classical ML baselines | All or selected features | Tabular | SVM, Random Forest, XGBoost | Tests performance against standard IDS classifiers |
Table 3 Comparing the suggested approach with other literature
| Reference | Method | Dataset/Context | Reported Performance | Relevance to This Study |
| [43] | DT, RF, and XGBoost | NSL-KDD | Accuracy 95.95% | Classical ML baseline on same benchmark |
| [44] | DLNID with Bi-LSTM and attention | NSL-KDD | Accuracy 90.73% F1-score 89.65% | Deep sequential IDS baseline |
| [45] | PSO-LightGBM and one-class SVM | UNSW-NB15 | Accuracy=86.68% | Optimization-based feature extraction/classification |
| [46] | Tree-CNN with SRS activation | Campus/company/ CICIDS2017 datasets | Average accuracy approximately 98% | CNN-based IDS comparator |
| [47] | Deep-learning IDS review | IoT IDS literature | Review paper | Journal of Mobile Multimedia; highlights DL, CNN/DNN, and optimization-based IDS challenges |
| [48] | SecureFLACF: federated learning blockchain-infused IDS | IIoT | Framework-level IDS security contribution | Journal of Mobile Multimedia; supports distributed and privacy-aware IDS context |
| Proposed method | Chatterjee correlation ABC optimization customized ResNet | NSL-KDD | Accuracy 98.5711% Precision 98.7557% Recall 98.2002% F1-score 98.4772% FPR 1.59% | Combines nonlinear feature relevance, optimized feature subset selection, and residual classification |
6 Comparison with Existing Algorithms
In order to evaluate how well the suggested method compares with the existing literature, four recently published studies are employed. ML algorithms, including DT, RF, and XGBoost, are employed in reference [43] for NIDS within the SDN controller to detect vicious behavior in network traffic, utilizing the NSL-KDD. Advanced preprocessing techniques are applied to enhance data quality, achieving outstanding results with a 95.95% accuracy in detection and classification of (DDoS, PROBE, R2L, U2R) attacks employing exclusively five out of 41 features of NSL-KDD.
In [44], a DL model for network ID (DLNID) is put forth. It incorporates a Bi-LSTM network and an attention mechanism. Adaptive synthetic sampling (ADASYN) is used to address data imbalance, and a modified stacked auto-encoder is used to reduce dimensionality. DLNID reaches greater accuracy 90.73% and F1 score 89.65% when tested on the NSL-KDD.
A PSO-LightGBM approach is presented in [45]. This method is employed to extract data features, which are then channeled into a one-class SVM. The UNSW-NB15 is employed to confirm the suggested method. Experimental findings show accurate detecting in a variety of harmful data, including tiny sample data like worms, shellcode, and backdoors, with an accuracy of 86.68%.
In reference [46], a description is provided for an IDS using the Soft-Root-Sign activation function based on the Tree-CNN. The system demonstrates an average detection accuracy of 98% across various attack types, including DDoS, Infiltration, Brute Force, and Web attacks. An evaluation of the effectiveness within a medium-sized company highlights its low complexity and reduced processing time.
The summarized comparative outcomes of the recommended process against the introduced approaches are showcased in Table 3. Notably, the suggested method surpasses other approaches in terms of accuracy. The comparison has been revised to include both performance-oriented IDS baselines and recent Journal of Mobile Multimedia studies relevant to deep-learning-based and distributed IDS design. Because the compared studies use different datasets, class definitions, and validation protocols, the values should be interpreted as indicative rather than strictly one-to-one comparisons.
7 Conclusion
This study introduces an inventive and effective approach for detecting intrusions in Internet of Things (IoT) networks, employing a tailored residual neural network (ResNet), Artificial Bee Colony (ABC) optimization, and the Chatterjee correlation coefficient. Through meticulous sequential phases, the methodology deals with significant challenges in relation to finding nonlinear relationships existent within feature selection, impeding capabilities of ResNet from capturing complex patterns, and simplifying the choice mechanism through metaheuristic optimization.
By using the Chatterjee correlation coefficient, we can create a nuanced view (both in terms of noise handling and duplicate data), which makes this approach to scale consistent for many kinds of dataset configurations. It improves the performance of feature selection, thereby providing a balanced subset for ResNet-based classification. Indeed, ResNet gets to play a very crucial role when we design it thoughtfully for utility that is helping in discerning high-level and low-level considerations, which make it efficient as hell and serves well with ID.
Empirical results (98.5711%) on the test dataset prove the effectiveness of the suggested methodology in intrusion detection for IoT networks. At last, comparative analysis of the suggested methodology with others proves the superiority of the Chatterjee correlation coefficient-driven approach in addressing research challenges in intrusion detection.
In this paper, a new perspective in intrusion detection through Chatterjee coefficient has been explored and extended its application domain to cybersecurity. Robust simulation and evaluation have provided an affirmation to the effectiveness of the proposed methodology.
7.1 Limitations and Future Work
While the presented model has demonstrated high performance in the NSL-KDD dataset, several drawbacks need to be considered. First, NSL-KDD is a well-known benchmark, but it doesn’t reflect the diversity of traffic, the protocols used, and the attacks performed in the modern IoT network. Second, the presented experimental results are based only on the held-out experiment that should be additionally confirmed using repeat held-out, k-fold cross-validation, or independent experiment on the other IoT data sets like BoT-IoT, ToN-IoT, CICIoT2023, and UNSW-NB15.
Thus, future research needs to include conducting complete ablation studies, significance testing against the strongest baselines, validation on the latest IoT/IIoT datasets, as well as computation cost, memory footprint, and latency evaluation on the test devices. All of these improvements will help to understand which feature – Chatterjee relevance calculation, ABC optimization, or 2D residual representation learning – contributed most to improvement of the results.
References
[1] Alsharfa, R. M., Feghhi, M. M., and Majeed, M. H. (2025). Wireless sensor networks nodes clustering and optimization based on fuzzy C-means and water strider algorithms. International Journal of Intelligent Engineering and Systems, 18(11), 598–612.
[2] Frank, C., Nance, C., Jarocki, S., and Pauli, W. (2017). Protecting IoT from Mirai botnets; IoT device hardening. In Proceedings of the Conference on Information Systems Applied Research, Austin, Texas.
[3] Asbaghi, S. S., and Feghhi, M. M. (2023). Resource allocation for secure ultra-reliable low-latency-communication in IoT applications. Journal of Communication Engineering. arXiv:2312.10555.
[4] Albulayhi, K., Smadi, A. A., Sheldon, F. T., and Abercrombie, R. K. (2021). IoT intrusion detection taxonomy, reference architecture, and analyses. Sensors, 21(19), 6432.
[5] Alhajjar, E., Maxwell, P., and Bastian, N. (2021). Adversarial machine learning in network intrusion detection systems. Expert Systems with Applications, 186, 115782.
[6] Sajja, G. S., Mustafa, M., Ponnusamy, R., and Abdufattokhov, S. (2021). Machine learning algorithms in intrusion detection and classification. Annals of the Romanian Society for Cell Biology, 25(6), 12211–12219.
[7] Alkadi, O., Moustafa, N., Turnbull, B., and Choo, K. K. R. (2020). A deep blockchain framework-enabled collaborative intrusion detection for protecting IoT and cloud networks. IEEE Internet of Things Journal, 8(12), 9463–9472.
[8] Khraisat, A., Gondal, I., Vamplew, P., Kamruzzaman, J., and Alazab, A. (2019). A novel ensemble of hybrid intrusion detection system for detecting internet of things attacks. Electronics, 8(11), 1210.
[9] Kumar, V., Sinha, D., Das, A. K., Pandey, S. C., and Goswami, R. T. (2020). An integrated rule based intrusion detection system: Analysis on UNSW-NB15 data set and the real time online dataset. Cluster Computing, 23, 1397–1418.
[10] Verma, A., and Ranga, V. (2020). Machine learning based intrusion detection systems for IoT applications. Wireless Personal Communications, 111, 2287–2310.
[11] Song, H. M., Woo, J., and Kim, H. K. (2020). In-vehicle network intrusion detection using deep convolutional neural network. Vehicular Communications, 21, 100198.
[12] Zhang, H., Li, J. L., Liu, X. M., and Dong, C. (2021). Multi-dimensional feature fusion and stacking ensemble mechanism for network intrusion detection. Future Generation Computer Systems, 122, 130–143.
[13] Rahman, S. A., Tout, H., Talhi, C., and Mourad, A. (2020). Internet of Things intrusion detection: Centralized, on-device, or federated learning? IEEE Network, 34(6), 310–317.
[14] Halim, Z., Yousaf, M. N., Waqas, M., Sulaiman, M., Abbas, G., Hussain, M., …and Hanif, M. (2021). An effective genetic algorithm-based feature selection method for intrusion detection systems. Computers & Security, 110, 102448.
[15] Kim, J., Kim, J., Kim, H., Shim, M., and Choi, E. (2020). CNN-based network intrusion detection against denial-of-service attacks. Electronics, 9(6), 916.
[16] Qi, L., Yang, Y., Zhou, X., Rafique, W., and Ma, J. (2021). Fast anomaly identification based on multi-aspect data streams for intelligent intrusion detection toward secure industry 4.0. IEEE Transactions on Industrial Informatics, 18(9), 6503–6511.
[17] Nguyen, M. T., and Kim, K. (2020). Genetic convolutional neural network for intrusion detection systems. Future Generation Computer Systems, 113, 418–427.
[18] Abbas, A., Khan, M. A., Latif, S., Ajaz, M., Shah, A. A., and Ahmad, J. (2021). A new ensemble-based intrusion detection system for internet of things. Arabian Journal for Science and Engineering, 1–15.
[19] Halimaa, A., and Sundarakantham, K. (2019, April). Machine learning based intrusion detection system. In IEEE 3rd International Conference on Trends in Electronics and Informatics (ICOEI) (pp. 916–920).
[20] Balyan, A. K., Ahuja, S., Lilhore, U. K., Sharma, S. K., Manoharan, P., Algarni, A. D., …and Raahemifar, K. (2022). A hybrid intrusion detection model using EGA-PSO and improved random forest method. Sensors, 22(16), 5986.
[21] Sarker, I. H., Abushark, Y. B., Alsolami, F., and Khan, A. I. (2020). Intrudtree: A machine learning based cyber security intrusion detection model. Symmetry, 12(5), 754.
[22] Vinayakumar, R., Alazab, M., Soman, K. P., Poornachandran, P., Al-Nemrat, A., and Venkatraman, S. (2019). Deep learning approach for intelligent intrusion detection system. IEEE Access, 7, 41525–41550.
[23] Saheed, Y. K., Abiodun, A. I., Misra, S., Holone, M. K., and Colomo-Palacios, R. (2022). A machine learning-based intrusion detection for detecting Internet of Things network attacks. Alexandria Engineering Journal, 61(12), 9395–9409.
[24] Abrar, I., Ayub, Z., Masoodi, F., and Bamhdi, A. M. (2020, September). A machine learning approach for intrusion detection system on NSL-KDD dataset. In IEEE International Conference on Smart Electronics and Communication (ICOSEC) (pp. 919–924).
[25] Choraś, M., and Pawlicki, M. (2021). Intrusion detection approach based on optimised artificial neural network. Neurocomputing, 452, 705–715.
[26] Roy, S., Li, J., Choi, B. J., and Bai, Y. (2022). A lightweight supervised intrusion detection mechanism for IoT networks. Future Generation Computer Systems, 127, 276–285.
[27] Eskandari, M., Janjua, Z. H., Vecchio, M., and Antonelli, F. (2020). Passban IDS: An intelligent anomaly-based intrusion detection system for IoT edge devices. IEEE Internet of Things Journal, 7(8), 6882–6897.
[28] Feghhi, M. M., Alsharfa, R. M., and Majeed, M. H. (2025). Efficient fault detection in WSN based on PCA-optimized deep neural network slicing trained with GOA. International Journal of Intelligent Engineering and Systems, 18(5), 426–441.
[29] Liang, W., Xiao, L., Zhang, K., Tang, M., He, D., and Li, K. C. (2021). Data fusion approach for collaborative anomaly intrusion detection in blockchain-based systems. IEEE Internet of Things Journal, 9(16), 14741–14751.
[30] Alavizadeh, H., Alavizadeh, H., and Jang-Jaccard, J. (2022). Deep Q-learning based reinforcement learning approach for network intrusion detection. Computers, 11(3), 41.
[31] Tavallaee, M., Bagheri, E., Lu, W., and Ghorbani, A. A. (2009, July). A detailed analysis of the KDD Cup 99 data set. In IEEE Symposium on Computational Intelligence for Security and Defense Applications (pp. 1–6).
[32] Dhanabal, L., and Shantharajah, S. P. (2015). A study on NSL-KDD dataset for intrusion detection system based on classification algorithms. International Journal of Advanced Research in Computer and Communication Engineering, 4(6), 446–452.
[33] Chatterjee, S. (2021) A new coefficient of correlation. Journal of the American Statistical Association 116(536): 2009–2022.
[34] Teodorovic, D., Lucic, P., Markovic, G., and Dell’Orco, M. (2006, September). Bee colony optimization: Principles and applications. In IEEE 8th Seminar on Neural Network Applications in Electrical Engineering (pp. 151–156).
[35] Karaboga, D., and Akay, B. (2009). A comparative study of Artificial Bee Colony algorithm. Applied Mathematics and Computation, 214(1), 108–132.
[36] Sharma, A., Sharma, A., Choudhary, S., Pachauri, R. K., Shrivastava, A., and Kumar, D. (2020). A review on Artificial Bee Colony and it’s engineering applications. Journal of Critical Reviews, 7(11), 4097–4107.
[37] Bansal, J. C., Gopal, A., and Nagar, A. K. (2018). Stability analysis of Artificial Bee Colony optimization algorithm. Swarm and Evolutionary Computation, 41, 9–19.
[38] Hassan, A. N., Mohassel Feghhi, M., and Esmaeili, V. (2021). A fast automatic modulation classification based on STFT using hybrid deep neural network. Journal of Communication Engineering, 10(2).
[39] Residual blocks – Building blocks of ResNet. https://towardsdatascience.com/residual-blocksbuilding-blocks-of-resnet-fd90ca15d6ec.
[40] He, K., Zhang, X., Ren, S., and Sun, J. (2016). Deep residual learning for image recognition. In Proceedings of the IEEE Conference on Computer Vision and Pattern Recognition (pp. 770–778).
[41] Sarwinda, D., Paradisa, R. H., Bustamam, A., and Anggia, P. (2021). Deep learning in image classification using residual network (ResNet) variants for detection of colorectal cancer. Procedia Computer Science, 179, 423–431.
[42] Mhapsekar, M., Mhapsekar, P., Mhatre, A., and Sawant, V. (2020). Implementation of residual network (ResNet) for Devanagari handwritten character recognition. In Advanced Computing Technologies and Applications: Proceedings of 2nd International Conference on Advanced Computing Technologies and Applications – ICACTA (pp. 137–148). Springer Singapore.
[43] Alzahrani, A. O., and Alenazi, M. J. (2021). Designing a network intrusion detection system based on machine learning for software defined networks. Future Internet, 13(5), 111.
[44] Fu, Y., Du, Y., Cao, Z., Li, Q., and Xiang, W. (2022). A deep learning model for network intrusion detection with imbalanced data. Electronics, 11(6), 898.
[45] Liu, J., Yang, D., Lian, M., and Li, M. (2021). Research on intrusion detection based on particle swarm optimization in IoT. IEEE Access, 9, 38254–38268.
[46] Mendonça, R. V., Teodoro, A. A., Rosa, R. L., Saadi, M., Melgarejo, D. C., Nardelli, P. H., and Rodríguez, D. Z. (2021). Intrusion detection system based on fast hierarchical deep convolutional neural network. IEEE Access, 9, 61024–61034.
[47] Ravindran, S., and Sarveshwaran, V. (2023). Deep learning towards intrusion detection system (IDS): Applications, challenges and opportunities. Journal of Mobile Multimedia, 19(05), 1299–1330, doi: 10.13052/jmm1550-4646.1958.
[48] Dineshbabu, V., and Vigenesh, M. (2025). SecureFLACF: Secure federated learning access control framework with blockchain-infused intrusion detection system for IIoT. Journal of Mobile Multimedia, 21(05), 939–966. doi:10.13052/jmm1550-4646.2155.
Biographies

Mahmood Mohassel Feghhi received the B.S. and M.S. degrees (Hons.) in electrical engineering from the Iran University of Science and Technology, Tehran, Iran, in 2006 and 2009, respectively, and the Ph.D. degree in electrical engineering from the College of Engineering, University of Tehran, Tehran, in 2015. From 2007 to 2016, he was a Senior Design Engineer in communication systems design with several communications industries. Since 2016, he has been with the Faculty of Electrical and Computer Engineering, University of Tabriz, Iran, where he is currently an Associate Professor. He has published more than 60 technical papers in international journals and conferences in the fields of information theory, wireless communications, signal and image processing, machine learning, data science, 5G/6G cellular networks, Internet of Things (IoT), scheduling, and optimization. He is the Director-in-Charge of the Journal of Advanced Signal Processing (JASP), and the Executive Manager of the Tabriz Journal of Electrical Engineering (TJEE). His current research interests include information theory, wireless communication networks, signal processing, machine learning, and optimization. Mohassel Feghhi was Chair of Scientific Committee at the 4th West Asian Symposium on Optical and Millimeter-wave Wireless Communications (WASOWC 2022) and Scientific Committee Chair of the Communications section at the 28th Iranian Conference on Electrical Engineering (ICEE 2020). Moreover, he served as a TPC member of several international conferences, and also serves as a reviewer for several international journals, such as IEEE Transactions on Green Communications and Networking, IEEE Transactions on Vehicular Technology (IEEE-TVT), IEEE Systems Journal, IET Communications, Ad Hoc Networks, and Journal of the Franklin Institute.

Raya Majid Alsharfa is an Assistant Professor at the Department of Computer Engineering Techniques, Electrical Engineering Technical College, Middle Technical University, Iraq. She completed her Master’s degree in the USA in 2016. She has published 13 research papers in the field of communications. She is currently a Ph.D. student at the University of Tabriz, Faculty of Engineering, Department of Communications. Her research interests include wireless communications, IoT, communication systems, and related advanced technologies.

Mohammed Ridha Faisal received his Ph.D. in Computer Engineering from Süleyman Demirel University, Turkey, in 2023. He is an academic, researcher, and consultant specializing in computer engineering, cybersecurity, artificial intelligence, and digital transformation. He has authored several books in both Turkish and English and has published numerous research papers in international journals and conferences. His research interests encompass cybersecurity, he has served as the Head of the Cybersecurity Engineering Department at Ibn Khaldun College, alongside his ongoing academic and consulting work in the fields of digital transformation and cybersecurity.
Journal of Mobile Multimedia, Vol. 22_4, 413–452
doi: 10.13052/jmm1550-4646.2241
© 2026 River Publishers