AI-Powered Personalization in Online Shopping: Key Factors Influencing Customer Retention
Vicha Panya, Prush Sa-nga-ngam and Adisorn Leelasantitham*
Technology of Information System Management Division, Faculty of Engineering, Mahidol University, NakhonPathom, Thailand
E-mail: vicha_panya@outlook.com; prush.san@mahidol.ac.th; adisorn.lee@mahidol.ac.th
*Corresponding Author
Received 03 March 2025; Accepted 09 May 2025
Customer retention is essential for the sustainability of retail businesses. Particularly as digital technology and AI personalize online shopping experiences. This study develops a consumer purchase behavior model for online shopping by categorizing retention factors into two groups: physical (technology readiness, information availability, ease of use) and social (perceived personalization and social norms). Personalization is shown to positively influence customer relationships and retention. Data were collected from 410 respondents in Thailand who had experience using online retail platforms, and the analysis was conducted using the PLS-SEM method. The findings indicate that AI-driven personalization significantly enhances customer retention. Among all factors, ease of use exerted the strongest influence (, p 0.05). However, the influence of social norms showed a negative path coefficient (, p 0.05), suggesting that some customer segments remain socially hesitant in adopting such technology.
To address these concerns, online retailers should clearly communicate the security measures of AI-based shopping, especially regarding data privacy and protection. Strengthening trust in AI-powered personalization will improve customer retention, enhance shopping experiences, and drive sales growth.
Keywords: Consumer behaviour model, physical factors, social factors, personalize online shopping, AI-powered personalization, customer retention.
The e-commerce market in Thailand has expanded rapidly during the COVID-19 pandemic, as lockdown measures have prompted consumers to turn to online services, such as ordering food and essentials online. Thailand’s Business-to-Customer (B2C) and Business-to-Business (B2B) e-commerce market was worth US$49 billion in 2020, up from US$33 billion in 2017. Despite the expansion of online shopping, only 23% of the population made purchases online in 2020, with 57% of online transactions conducted via mobile devices. The three most popular product categories were travel (57%), electronics (11%), and fashion (10%), respectively. Key factors driving the growth of the e-commerce market include increased internet access, with Thailand being the first country in Southeast Asia to offer 5G services since 2020; widespread smartphone adoption; and improved online logistics and payment systems. It is estimated that by 2025, the internet penetration rate in Thailand will increase from 75.1% in 2020 to 81.5%. In 2021, the number of e-commerce users in the consumer goods group was 36.6 million, with a total spending value of 18.97 billion USD or an average of 518 USD per person, with 65.1% of users choosing to buy products via mobile phones. However, after the COVID-19 situation, the growth of online retail platforms has slowed down, although the overall e-commerce market still has a tendency to expand continuously [1].
Note: As of January 2024, Thailand had 63.21 million internet users, with an average mobile internet speed of 40.69 Mbps and fixed internet speed of 216.26 Mbps, while the number of active social media users stood at 49.10 million, including Facebook (49.10 million), YouTube (44.20 million), TikTok (44.38 million), Instagram (18.75 million), X (Twitter) (14.68 million), LinkedIn (5 million), and Snapchat (0.615 million) [2].
Online retail platforms in Thailand are continuously evolving to enhance the consumer shopping experience, with an increasing reliance on AI technology to customize shopping experiences according to personalization needs (AI-powered personalization) [3]. Various determinants of online purchasing decisions in Thailand include the cash-on-delivery option [4], interest-free installment option [5], click-and-collect option [6], free delivery [7], next-day delivery [8], coupons and discounts [9], easy returns [10], simple online checkout [11], social media “buy,” [12] loyalty points [13], “like” and comments on social media, live chat box, customer review, competitions of e-commerce platforms, and eco-friendly credentials.
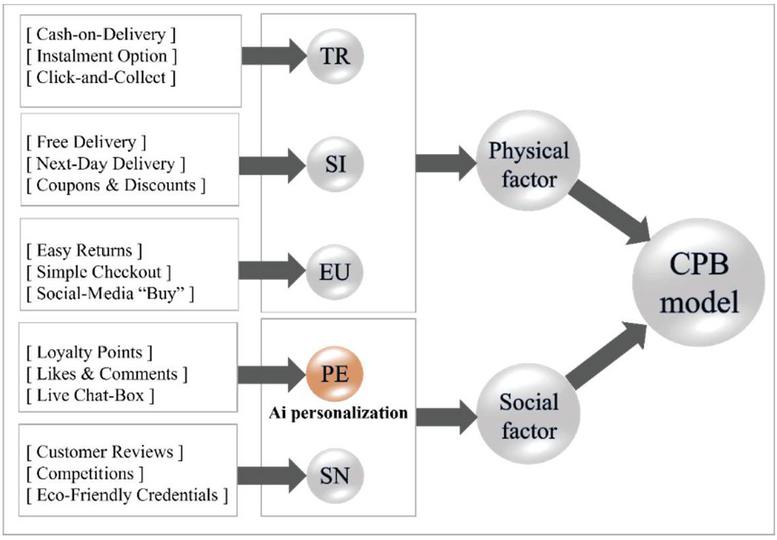
This study has developed a consumer purchasing behavior model (CPB), which categorizes the determinants of online purchasing decisions into two primary groups: Physical Factors and Social Factors. Within Physical Factors, Technology Readiness refers to the necessary infrastructure and support systems, including cash-on-delivery (cash-on-delivery option), interest-free installment options (interest-free installment option), and flexible delivery services (click-and-collect option). Sufficient information plays a crucial role by ensuring that consumers have access to details such as free shipping (free delivery), next-day delivery (next-day delivery), and coupons and discounts (coupons and discounts), which facilitate informed decision-making and influence shopping behavior. Ease of use emphasizes the importance of a user-friendly platform, incorporating a quick and easy payment (simple online checkout), hassle-free returns (easy returns), and convenient purchasing through social media (social media “buy”).
In the category of Social Factors, perceiving a personalized experience in online shopping (AI-driven personalization) that customers tend to perceive as normal in Thailand, AI utilizes loyalty points from previous customer purchase histories and behavior to recommend relevant products and promotions (loyalty points). AI also analyzes content and purchasing behavior to select appropriate social media comments (likes and comments on social) [14] and facilitates real-time customer interaction via AI-driven communication channels (live-chat box) [15]. Purchase behavior is affected by social norms, which include reading real customer reviews (customer reviews) [16], choosing products based on popular trends and often portraying themselves as better than competitors (competitions) [17], and giving more weight to purchases that are environmentally friendly (eco-friendly credentials) [18].
This research identifies five key factors – Technology Readiness (TR), Sufficient Information (SI), Ease of Use (EU), Perceiving a Personalised Experience (PE), and Social Norm (SN) – each comprising three measurement items.
TR includes: Cash-on-Delivery Option, Interest-Free Instalment Option, and Click-and-Collect Option.
SI includes free delivery, next-day delivery, and coupons and discounts.
EU includes easy returns, simple online checkout, and social media “buy”.
PE includes loyalty points, “likes” and comments on social media, and live chat boxes.
SN includes customer reviews, competitions, and eco-friendly credentials.
The first three factors are categorized as physical factors, while the latter two represent social factors – based on the classification proposed by Furaiji et al. [19]. These 15 measurement items serve as indicators of online shopping behavior in Thailand, which are regarded as key drivers [1]. Accordingly, the identified factors and their corresponding measurement items comprehensively capture and influence online shopping behavior in Thailand. This study addresses a critical research gap by shifting the focus from system-centric evaluations of AI efficiency and user interface design to a consumer-centric understanding of how social norms and perceived personalization influence trust and behavioral intention. Accordingly, the identified factors and their corresponding measurement items comprehensively represent the key dimensions of online shopping behavior in Thailand and are used to develop a Consumer Purchasing Behavior (CPB) model. Insights from this study can help refine AI-powered e-commerce platforms to deliver personalized experiences, boost engagement, drive business growth, and improve customer retention.
This study identifies 15 key determinants of online purchase decisions in Thailand and categorizes them into physical and social factors to develop a consumer purchasing behavior (CPB) model. By integrating these factors, the research addresses a critical gap in understanding the role of AI-powered personalization in online shopping platforms, which is essential for enhancing customer relationships and influencing customer retention. To support the development of this CPB model, a comprehensive literature review was conducted on the relevant constructs. These determinants are described in detail below and subsequently summarized in Table 1.
Table 1 Online shopping behavior (physical factors and social factors)
| Determinants of Online | ||
| Factors | Purchasing Decisions | Description |
| Physical factors Technology Readiness (TR) | Cash-on-delivery option. | This payment system allows customers to pay for goods upon delivery instead of in advance. This approach is particularly beneficial to offering consumers a sense of security by allowing payment only after receiving the product and service [19]. |
| Interest-free Instalment Option. | The financing system arrangement enables customers to divide their purchase total into equal, interest-free payments over a specified period, which encourages increased spending without the burden of interest charges [20]. | |
| Click and collect Option. | This service system allows customers to order products online and pick them up at a designated store or collection point. This option provides flexibility, eliminates shipping costs, and often reduces waiting times compared to home delivery [21]. | |
| Physical factors Sufficient information (SI) | Free delivery. | The information is that the seller covers the shipping costs, allowing buyers to receive their orders without additional expenses. This benefit plays a crucial role in influencing consumer purchase behavior on an online shopping platform [22]. |
| Next-day delivery. | The information is that the sellers enhance convenience by ensuring that products are delivered to buyers within one day of placing an order. This expedited shipping option increases customer satisfaction [22]. | |
| Coupons and discount. | The information is that the seller offers special offers that lower the cost of products or services. These promotions serve as valuable incentives for online shoppers, making consumer purchasing behavior more appealing [23]. | |
| Physical factors Easy to Use (EU) | Easy returns. | A hassle-free return process that allows customers to return or exchange products effortlessly, increasing their confidence in online shopping and reducing purchase hesitation [24]. |
| Simple online checkout. | This is a quick and easy payment process that minimizes steps in the purchasing process, making transactions faster and more efficient and reducing cart abandonment rates [25]. | |
| Social-media “Buy”. | A convenient purchasing process that enables consumers to buy products directly from social media platforms without being redirected to another website, making shopping more seamless [27]. | |
| Social factors Perceiving a Personalized Experience (PE) | Loyalty points. | AI utilizes loyalty points accumulated from previous purchases to suggest relevant products and exclusive promotions, encouraging repeat purchases and enhancing customer retention [28]. |
| “Like” and comments on social. | AI analyzes customer interactions on social media, including content engagement and purchasing behavior, to select relevant comments and recommendations, making the shopping experience more interactive and personalized [29]. | |
| Live chat-box. | AI-powered real-time communication channels enable instant customer support, answering inquiries, providing product and service suggestions, and resolving preliminary issues promptly, improving overall customer satisfaction and trust [30]. | |
| Social factors Social Norm (SN) | Customer reviews. | Consumers rely on authentic feedback from previous buyers to assess product quality and reliability, which significantly impacts purchasing behavior [31]. |
| Competitions. | Sellers often choose products based on current trends and market popularity, often portraying themselves as better than competitors, driven by peer influence and social norms, reinforcing the perception of value and desirability [32]. | |
| Eco-friendly credentials. | Growing environmental awareness encourages customers to prioritize purchases that align with sustainability, favoring brands and products that emphasize eco practices and materials [33]. |
The Cash-on-Delivery (CDO) option [19] allows consumers to pay in cash upon receiving their goods, eliminating the need for advance payment. This method offers convenience, especially for those who prefer not to use credit cards or online payments. It also enhances trust among consumers concerned about online payment security and provides access for those unfamiliar with digital payment systems.
The IFO option [20] is a payment system that allows customers to pay for goods or services in installments without paying interest over a specified period of time. Choosing this option provides flexibility in managing finances because customers do not have to pay the entire amount at once but rather pay in installments that they have agreed upon. This allows for better money management, as well as allowing customers to access high-priced items without having to pay a large amount at once. It also reduces short-term financial burdens and eliminates the need to worry about paying additional interest. This installment payment method allows customers to effectively plan their finances in the long term.
The CCO Option [21] is an online shopping system that allows customers to purchase products through a website or mobile application and pick them up at a warehouse or local store instead of opting for home delivery. This approach eliminates shipping costs and significantly reduces waiting time for parcel deliveries. Additionally, it offers flexibility in pickup scheduling, enabling customers to collect their purchases at a time that best suits their convenience.
FRD is “Free Shipping,” [22] a strategy often used by online sellers to attract customers. Removing the shipping cost and showing this information can help reduce the barrier to purchase, as shipping costs are often one of the final decision-makers. Offering free shipping can increase the overall value of a product or service from the customer’s perspective and can increase satisfaction with the shopping experience. In addition, free shipping influences customer purchasing behavior, often encouraging customers to purchase larger quantities or more frequently, resulting in increased sales for the sellers.
NED is a delivery service that ensures customers receive their orders within 24 hours of completion [22]. This service plays an important role in increasing convenience and satisfaction for customers, especially in cases where they need products urgently. NED information helps increase the efficiency of online shopping by reducing customer waiting time, which affects satisfaction and may influence purchasing decisions. Such services are also a tool for creating competitive differentiation in a market with many types of delivery services. Sellers are often used as a strategy to attract new customers as well as customer retention. It also helps increase awareness of fast service and effectively responds to customer needs.
CAD are important promotional strategies that encourage consumers to purchase products by offering discounts on products or services [23]. If information is provided about coupons and discounts, they can appeal to customers to purchase by creating interest and urgency and reducing hesitation in making a decision. In addition, discounts increase customer satisfaction because shoppers feel that they are getting a good deal. These pricing strategies are widely used by sellers for customer retention.
EAR is a process where consumers can return purchased products without any hassle and with clear terms and conditions, often including a simple return process and refund or exchange [24]. Providing an easy return process promotes a better shopping experience for customers, especially in online businesses where uncertainty about product quality or satisfaction can be a barrier to purchasing decisions. Providing a convenient and fast return option reduces the risk to consumers and increases confidence in online shopping. It can also increase satisfaction and encourage consumers to return to buy in the future. It also helps to build a good relationship between sellers and customers, which can create customer retention.
SOC is a process by which customers can make a quick and simple payment for online purchases [25]. The checkout process is designed to be easy for users to complete without going through a complicated or time-consuming process. A simple and convenient checkout process improves the efficiency of online transactions and reduces the cart abandonment rate, which is a common problem in e-commerce businesses. Streamlining the checkout process not only improves the user experience but also increases customer satisfaction and promotes customer retention. In addition, simplifying the checkout process can encourage customers to make faster purchase decisions and reduce the cart abandonment of transactions in the online environment [26].
SMB is Social Media Shopping, a process in which consumers can purchase products or services directly through social media platforms such as Facebook, Instagram, TikTok, or X without having to leave the social media application or website to go to the store or seller’s website [27]. Shopping through social media helps increase the convenience and speed of transactions because consumers can search for product information and make payments within the same platform. It also allows sellers to reach customers directly through interactions via posts or advertisements that have immediate responses, which can encourage easier buying and selling. The convenience and agility of this process, therefore, increase the efficiency of consumers’ purchasing decisions.
The Loyalty Point (LOP) system [28] rewards consumers for purchases from participating merchants, encouraging ongoing engagement. Points can be redeemed for discounts or benefits, promoting repeat purchases and customer retention. Additionally, AI can analyses point-based transaction data to personalize the shopping experience based on individual behaviors and preferences. This data also supports targeted marketing strategies tailored to each customer’s profile through AI-powered personalization.
The Like-and-Comment System (LCS) [29] enables customers to express preferences and interests, serving as a valuable tool for AI-driven personalization. “Likes” and comments reflect individual tastes, allowing AI to recommend products aligned with prior interactions. This form of engagement enhances user satisfaction and makes the AI-personalized shopping experience feel more tailored and responsive to consumer needs.
It is a tool that enhances the consumer buying experience by providing rapid and personalized responses. By providing services through live chat channels, AI can help consumers receive advice or information about specific products and services as needed or solve basic problems at that time, which helps customers feel that they are being cared for individually and appropriately [30]. Using a live chat box helps create a buying experience that meets customer expectations and interests directly and encourages consumers to participate in better purchasing decisions because they can receive useful and timely information to influence purchase decisions.
CRV is opinions or suggestions from consumers who have used products or services, which can be posted on online platforms or websites [31]. These reviews often include information about the user experience, quality of the product or service, and consumer satisfaction. Reading reviews from real users helps other consumers make more confident purchasing decisions, as they can gain useful and direct information from the experiences of those who have actually used the product. In addition, providing reviews is an important tool in building trust and transparency in online businesses, often influencing consumers’ purchasing decisions and increasing satisfaction and trust in products and services.
In the competitive online businesses, sellers often choose products based on current market trends and popularity. In order to attract customers and gain a competitive advantage, they often present their products as superior to their competitors, whether through quality, price, or marketing image [32]. Social influences and consumer behavior play a significant role, causing some products to be accepted and seen as more valuable. This competition is driven by market perception rather than the actual value of the product, resulting in rapid changes in trends, and sellers must constantly adjust their strategies to maintain their position in the market.
EFC is an environmentally friendly certification strategy that reflects the influential values and behaviors in society that promote environmental responsibility [33]. Choosing products that are certified as environmentally friendly reflects compliance with social standards that emphasize sustainability [34]. Currently, many consumer groups consider environmental responsibility as a primary factor in deciding to purchase products or services. Supporting environmentally friendly products not only meets personal needs but also demonstrates adherence to social values and norms that promote a reduction in environmental impact. Choosing such products also reflects being part of a society that emphasizes environmental conservation and sustainable resource use.
Various artificial intelligence (AI) models have been employed in e-commerce platforms to deliver personalized shopping experiences. Among the most widely adopted are collaborative filtering and content-based filtering. Collaborative filtering relies on user–user or item–item similarities to generate recommendations and has been shown to perform well in platforms with rich user interaction data [35] In contrast, content-based filtering focuses on product attributes and user profiles, which is particularly effective in addressing cold-start problems for new users [36]. Recent developments have seen the emergence of hybrid models, which integrate both collaborative and content-based techniques to improve recommendation accuracy and system robustness [37]. Furthermore, deep learning models – such as neural networks – have been increasingly utilized to capture complex behavioral patterns, enabling real-time and dynamic personalization based on both structured and unstructured data [38]. While these models differ in complexity and application scope, each contributes to enhancing consumer engagement and purchase intent through tailored recommendations. This study builds upon these foundations by examining how AI-powered personalization interacts with physical and social factors to influence online consumer purchasing behavior in Thailand.
Based on the conceptual foundation established in items 1 to 16, the grouping of measurement items into five key constructs of the CPB model is illustrated in Figure 1.
Figure 1 Measurement item grouping for the CPB model.
This study examines the key factors influencing consumer purchasing behavior, categorizing them into two main groups: physical factors and social factors. Based on the literature review and the relationships illustrated in Figure 1 between measurement items and their corresponding factors, a Consumer Purchasing Behavior (CPB) model has been developed, incorporating these factors along with the research hypotheses, as illustrated in Figure 2. Physical factors are represented by TR, SI, and EU, while social factors include PE and SN. This classification effectively highlights the distinct influences of these two groups on customer retention in AI-driven, personalized online shopping platforms.
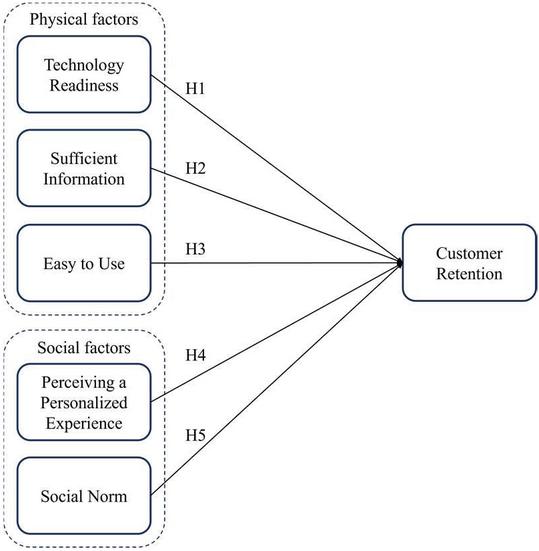
Figure 2 Proposed research model.
Technology readiness (TR) reflects a platform’s ability to meet customer needs through seamless and convenient features [39]. This includes offering cash-on-delivery (CDO) services, providing interest-free installment options (IFO) with personalized payment plans, and enabling customers to place orders online and pick them up at a warehouse or nearby store (CCO). When consumers perceive that an online shopping platform is technologically equipped with these capabilities, they are more likely to engage in purchasing behaviors and influence customer retention. This factor leads to the following hypothesis:
H1: Technology readiness has a positive influence on the consumer retention.
System information (SI) refers to the availability of comprehensive and clear product and service details on an online shopping platform, enabling consumers to evaluate options and make informed purchasing decisions with confidence [40]. Providing SI reduces uncertainty and enhances the shopping experience through features such as free shipping (FRD), which lowers purchasing barriers and encourages higher or more frequent spending; next-day delivery (NDD), which ensures convenience by delivering products within 24 hours; and coupons and discounts (CAD), which offer cost-saving alternatives. When consumers perceive that an online shopping platform provides adequate information, they are more likely to engage in purchasing behaviors and influence customer retention. This factor leads to the following hypothesis:
H2: Sufficient information has a positive influence on customer retention.
Ease of Use (EAU) in an online shopping platform refers to the design and functionality process that enhances customer convenience, ensuring seamless access to services and information [41]. By minimizing purchasing barriers, EAU improves customer satisfaction and decision-making. Key aspects include easy returns (EAR), which provide a hassle-free and transparent return process, increasing consumer confidence and reducing perceived risks; simplified online checkout (SOC), which streamlines payment procedures to minimize complexity, reducing cart abandonment rates and facilitating quicker purchase decisions; and social media shopping (SMB), which enables direct purchasing and payment through platforms like Facebook, Instagram, TikTok, or X without redirecting to external websites, enhancing purchase opportunities and accelerating decision-making. By prioritizing the EU, online shopping platforms elevate the consumer experience, increase satisfaction, and influence customer retention. This factor leads to the following hypothesis:
H3: Easy to use has a positive influence on customer retention.
Perceived Personalized Experience (PE) refers to the ability of AI-driven online shopping platforms to deliver personalized experiences that align with individual consumer preferences [42]. As AI becomes a normal part of online shopping in Thailand, it enhances platform responsiveness and accuracy in understanding customer needs. Key components include loyalty points (LOP), which incentivize repeat purchases by allowing customers to redeem rewards while also enabling sellers to analyze consumer behavior and personalize shopping experiences; likes and comments on social media (LCS), which provide valuable insights into customer interests, allowing platforms to recommend products and services that match user preferences, thereby enhancing personalization and engagement; and live chatbots (LCB), which offer real-time assistance, ensuring consumers receive relevant support and recommendations, increasing confidence in purchasing decisions and overall satisfaction. By leveraging AI to create PE, online platforms can enhance shopping experiences and influence customer retention. This factor leads to the following hypothesis:
H4: Perceiving a Personalized Experience has a positive influence on customer retention
Social norms (SN) refer to the societal standards that influence consumer behavior in online shopping, often shaped by social recommendations and prevailing trends [43]. These norms impact purchasing decisions by reinforcing trust, desirability, and perceived value. Key components include customer reviews (CRV), which serve as a crucial source of information, helping consumers make confident purchasing decisions by providing authentic user experiences that enhance credibility, transparency, and trust in products and services; competitive positioning (COP), where sellers strategically select products based on market trends and popularity, presenting themselves as superior to competitors, driven by peer influence and social norms that shape consumer perceptions of value and desirability; and environmentally friendly choices (EFC), where consumers opt for eco-certified products that emphasize sustainability, reflecting both personal values and adherence to social expectations of environmental responsibility. By aligning with these social norms, consumer purchasing behavior remains in sync with broader social norms, influencing customer retention. This factor leads to the following hypothesis:
H5: Social norm has a positive influence on customer retention
This qualitative research explores customer behavior on online shopping platforms to personalize shopping experiences using AI for customer retention. The researcher carefully screened the population group, focusing on Thai consumers with prior experience using online shopping platforms, particularly those registered with a purchase history on AI-powered personalization platforms such as Shopee, Lazada, and other well-known platforms in Thailand. The screening criteria required participants to have engaged in online shopping within the six months preceding data collection to ensure the relevance and freshness of the data. Additionally, participants met at least one of the following criteria: (1) prior use of digital payment channels (E-Wallet, Mobile Banking) or (2) experience with online shopping services and familiarity with technology. Eligibility was verified using mandatory screening questions at the start of the online survey. Only respondents who met the criteria were allowed to continue with the full questionnaire. Data collection was conducted through an online questionnaire (Google Form Online Survey), yielding a sample size of 410 participants over a three-month period. This approach facilitated efficient access to the target group and ensured a systematic screening process. By selecting respondents who met the screening criteria, the study obtained accurate data aligned with the research objectives, providing clear insights into the impact of AI personalization on consumer purchasing behavior.
This research utilized a 15-item questionnaire to test the model and hypotheses, employing a quantitative approach to assess their validity. The questionnaire was divided into three sections: (1) demographic information, including gender, age, and education level; (2) behavioral information, such as prior experience and frequency of online platform usage; and (3) a set of questions measured on a 5-point Likert scale, where 1 represents “strongly disagree,” 2 represents “disagree,” 3 represents “neutral,” 4 represents “agree,” and 5 represents “strongly agree.” Experience with online shopping platforms was used as a screening criterion, categorized into three groups: 3–6 months, 6–12 months, and more than 1 year. In addition, frequency of online shopping usage – classified as daily, weekly, or monthly – was also applied as a screening condition to ensure that all respondents had relevant and recent experience. These criteria formed the basis for the questionnaire design. These criteria formed the basis for the questionnaire design, and the reliability of the questionnaire was tested using Cronbach’s alpha.
Table 2 The questionnaire index
| Index | Questionnaire | Sources |
| Physical factors | ||
| TR1 | Cash-on-Delivery Option (CDO) The availability of a cash-on-delivery payment option makes me feel secure and increases the likelihood that I will return to use this platform. | Adapted from [44] |
| TR2 | Interest-Free Instalment Option (IFO) I am more likely to return to a platform that offers an interest-free installment payment option, as it helps me manage my expenses more effectively | Adapted from [45] |
| TR3 | Click and Collect (CCO) “The availability of a Click and Collect option increases my likelihood of shopping through an online platform more frequently.” Clarification of Click and Collect: Click and Collect is a shopping method where customers purchase products online and pick them up at a designated store or pickup location instead of having them delivered to their homes. | Adapted from [46] |
| SI1 | Free Delivery (FRD) I am more likely to shop online if free shipping is available. | Adapted from [47] |
| SI2 | Next-Day Delivery (NDD) I am more likely to shop frequently if next-day delivery service is available on the platform I use. | Adapted from [48] |
| SI3 | Coupons and Discounts (CAD) Using coupons or discounts makes me feel that I am getting good value for my purchases. | Adapted from [49] |
| EU1 | Ease Returns (EAR) Having an easy return and refund policy increases my confidence and likelihood of returning to use the platform. | Adapted from [50] |
| EU2 | Simple Online Checkout (SOC) I am more likely to return to the platform if the payment process is easy and fast. | Adapted from [51] |
| EU3 | Social-media “Buy” (SMB) Being able to purchase products directly through Facebook, Instagram, TikTok, or X without switching to another website increases my likelihood of using the platform more frequently. | Adapted from [14] |
| PE1 | Loyalty Point (LOP) I feel that AI can use my loyalty points data to recommend products and services that match my needs, increasing my likelihood of becoming a loyal customer. | Adapted from [52] |
| PE2 | “Like” and Comments on Social (LCS) The use of my social media data by AI to recommend products that match my interests increases the likelihood that I will return to this platform. | Adapted from [14] |
| PE3 | Live Chat-Bot (LCB) I feel satisfied and am more likely to return to the platform when I can chat with an AI via live chat before making a purchase decision. | Adapted from [53] |
| SN1 | Customer Reviews (CRV) I usually read customer reviews (CRV) before making an online purchase to ensure product quality. | Adapted from [54] |
| SN2 | Competitions (CPT) I tend to choose platforms that offer trending products in the market, as it gives me confidence in the value and quality of the items. | Adapted from [55] |
| SN3 | Eco-Friendly Credentials (EFC) I am more likely to return to a platform that supports environmentally friendly products. | Adapted from [56] |
The data for this study were collected through an online survey (Google Forms), designed to examine customer behavior on online platforms. The research focuses on the role of AI in personalizing shopping experiences (AI-Powered Personalization) and its impact on customer retention. Based on the study’s findings, the proposed model, and the formulated hypotheses, an experimental research approach was selected to further test the hypotheses derived from the survey data. This study was reviewed and approved by the Human Research Ethics Committee of Mahidol University, ensuring compliance with ethical guidelines for research involving human participants. The IRB Research Project Code is COE No. MU-CIRB 2024/101.0107, confirming adherence to ethical research standards.
A pilot test using an online survey was conducted with a preliminary sample of 30 people in September 2024 to assess the preliminary results and improve the questionnaire to better align with the research objectives. The pilot test process lasted for 1 month, with the data collected analyzed to check the clarity and appropriateness of the questions. The need for revision was identified based on respondent feedback regarding unclear wording, redundant items, and inconsistent Likert-scale alignment, which affected the flow and interpretability of responses. Based on the analysis results, the questionnaire was revised to increase the efficiency of data collection and make it more accurate. Then, new data collection was conducted using the revised questionnaire, as detailed in Table 2. As illustrated in Figure 1, this study focuses specifically on the factor of Perceived Personalization (PE), which is directly related to AI-driven personalization in online shopping platforms. Accordingly, the research questions were formulated to explore issues concerning AI personalization and its impact on consumer behavior. The final data collection process took 2 months to ensure that the data obtained accurately and comprehensively reflected the research issues.
In November 2024, following the revision of the questionnaire to align with the research objectives, a new phase of data collection commenced through an online survey over a two-month period. However, as this timeframe overlapped with the year-end holiday season, responses to the questionnaire may have been slower compared to the pilot test. During this data collection phase, a total of 542 questionnaires were received. However, the evaluation of data quality revealed that some responses did not meet the screening criteria and did not align with the study’s objectives. Additionally, certain respondents provided answers that appeared unreliable (inconsistent or straight-lining responses), potentially compromising the accuracy of the analysis. To ensure data integrity, data cleaning was conducted by filtering out and excluding responses that did not meet the criteria. As a result, the final sample size eligible for analysis was 410, meeting the required standards.
Following data inspection, SmartPLS 4.1.0.9 software was utilized to analyze the conceptual model and assess the structural relationships between variables. A key step in this analysis involved classifying the population into distinct groups, as detailed in Table 3.
Table 3 Respondents of online shopping platform
| Respondents (N 410) | |||
| Variables | Level | Frequency | Percentage |
| Gender | Male | 181 | 44.15 |
| Female | 229 | 55.85 | |
| Age | 18–20 (True Gen Z) | 27 | 6.78 |
| 20–27 (Zillennial) | 56 | 14.07 | |
| 28–35 (Younger Millennials) | 46 | 11.56 | |
| 36–43 (Older Millennials) | 240 | 60.30 | |
| 44–50 (Young Gen X) | 20 | 5.03 | |
| 51 (Older Gen X) | 9 | 2.26 | |
| Experience | 3–6 month | 68 | 16.59 |
| with online | 6–12 month | 132 | 32.20 |
| shopping platform | 1 years | 210 | 51.22 |
| Frequency of | Daily | 79 | 19.27 |
| using online | Weekly | 256 | 62.44 |
| shopping platform | Monthly | 75 | 18.29 |
This research employed SmartPLS Version 4.1.0.9 to conduct an in-depth analysis of the conceptual model. Utilizing Structural Equation Modeling (SEM), this approach enables the concurrent examination of both measurement and structural models. The evaluation process commenced with the measurement model to verify the constructs’ validity and reliability, followed by the structural model, which was applied to assess the proposed hypotheses.
The evaluation process began with an analysis of the measurement model to assess the validity and reliability of the latent variables, namely TR, SI, EU, PE, and SN, along with the observable variables, including TR1, TR2, TR3, SI1, SI2, SI3, EU1, EU2, EU3, SN1, SN2, and SN3. The results of this analysis are presented in Table 4.
Table 4 Construct reliability and validity
| Abbreviation | Mean | S.D. | Loading (0.70) | Outler VIF (5.00) |
| Physical factors | ||||
| TR1 | 3.546 | 1.043 | 0.927 | 3.532 |
| TR2 | 3.683 | 1.003 | 0.944 | 3.907 |
| TR3 | 4.266 | 0.875 | 0.722 | 1.459 |
| SI1 | 3.632 | 0.796 | 0.818 | 1.520 |
| SI2 | 4.239 | 0.727 | 0.900 | 2.244 |
| SI3 | 4.185 | 0.677 | 0.719 | 1.635 |
| EU1 | 3.612 | 1.099 | 0.843 | 1.590 |
| EU2 | 4.183 | 0.792 | 0.788 | 1.620 |
| EU3 | 4.120 | 0.807 | 0.881 | 1.984 |
| Social factors | ||||
| PE1 | 3.676 | 0.913 | 0.904 | 2.571 |
| PE2 | 3.820 | 1.103 | 0.845 | 2.402 |
| PE3 | 3.715 | 0.855 | 0.732 | 1.250 |
| SN1 | 3.654 | 1.053 | 0.877 | 2.253 |
| SN2 | 3.673 | 0.878 | 0.907 | 2.366 |
| SN3 | 3.724 | 0.680 | 0.750 | 1.391 |
First, the relationship between the observable variables and the latent variables was examined using the Outer Loadings value, which must exceed 0.7 [57] to be deemed acceptable. The analysis revealed that the obtained values ranged from 0.719 to 0.944. Additionally, multicollinearity was assessed to detect any excessive correlation among the independent variables. This was measured using the Outer Variance Inflation Factor (Outer VIF), where an acceptable threshold is below 5 [58]. The results indicated values between 1.25 and 3.907, confirming that multicollinearity was within an acceptable range.
Subsequently, the reliability and validity of the results were examined, as detailed in Table 5. The analysis began with an evaluation of the internal consistency of the latent variables, measured through Cronbach’s Alpha, which must exceed 0.7 [57]. The findings showed values ranging from 0.749 to 0.838. Next, the internal consistency reliability of the indicators was assessed using Composite Reliability (CR), which must also be greater than 0.7 [59]. The results were within the range of 0.855 to 0.902. Furthermore, the ability of the indicators to explain the latent variables was analyzed through the Average Variance Extracted (AVE) value, which should be above 0.5 [60]. The results fell between 0.665 and 0.758.
For discriminant validity, presented in Table 6, the Fornell-Larcker criterion was applied to ensure that each latent variable was significantly distinct from the others. The acceptable threshold for this measure is above 0.7 [59], and the results ranged from 0.815 to 0.87, indicating a clear distinction between variables.
Table 5 The reliability and validity of results
| Average | ||||
| Cronbach’s | Composite | Variance | ||
| Item | Alpha | Reliability | Extracted | |
| Constructs | Code | (0.70) | (CR) (0.70) | (AVE) (0.50) |
| Physical factors | ||||
| Technology Readiness | TR | 0.838 | 0.902 | 0.702 |
| Sufficient Information | SI | 0.749 | 0.855 | 0.665 |
| Easy to Use | EU | 0.789 | 0.876 | 0.702 |
| Social factors | ||||
| Perceive personalized Experience | PE | 0.770 | 0.868 | 0.688 |
| Social Norm | SN | 0.801 | 0.884 | 0.718 |
Table 6 Fornell-Larcker criterion
| Construct name | Customer Retention (CR) | TR | SI | EU | PE | SN |
| CR | 0.857 | |||||
| TR | 0.828 | 0.870 | ||||
| SI | 0.792 | 0.790 | 0.815 | |||
| EU | 0.820 | 0.775 | 0.776 | 0.838 | ||
| PE | 0.680 | 0.664 | 0.752 | 0.558 | 0.830 | |
| SN | 0.680 | 0.700 | 0.764 | 0.653 | 0.718 | 0.847 |
A structural model is a mathematical representation used to show the relationship between latent variables or unobserved variables in CPB, namely TR, SI, EU, PE, and SN. The measurement of the structural model is performed according to the statistical quality criteria, which are detailed in Table 7. The evaluation of the model is based on several criteria, including: The t-value is used to check whether the relationship between the independent variables and the dependent variables is statistically significant. The appropriate value must be greater than 1.96. The analysis results found that the value is in the range of 2.289 7.408. The Inner Variance Inflation Factor (Inner VIF) is used to check the problem of multicollinearity or excessive overlapping relationships between independent variables. The appropriate value must be less than 5 [58]. The analysis results found that the value is in the range of 3.231 4.393, which is within the acceptable range. The p-value is a probability value used to test the null hypothesis (H0), which means “no relationship between variables.” The appropriate value must be less than 0.05 to indicate that the relationship between the variables is statistically significant. The results are in the range of 0.000–0.022, which meets the specified criteria. In addition, the quality of CPB was considered through the R value, which is an indicator of the ability of the independent variable to explain the variance of the dependent variable. The possible values must be between 0 and 1. The analysis results found that the R value 0.792, which is at a high level, indicating that the model has sufficient quality for hypothesis testing. Therefore, the statistical analysis results indicate that CPB has a higher quality value than the minimum requirements, making it suitable for hypothesis testing. It was found that H1, H2, H3, H4, and H5 have a statistically significant relationship, except for H5, which has a relationship in the opposite direction as expected as shown in Figure 3.
Table 7 Results of the structural model
| Path | ||||||
| Coefficient | t-value | p-value | Inner | |||
| Hypothesis | Path | () | (1.96) | (0.05) | VIF (5) | Decision |
| H1 | TR- CR | 0.347 | 7.408 | 0.000 | 3.417 | Supported |
| H2 | SI- CR | 0.114 | 2.289 | 0.022 | 4.408 | Supported |
| H3 | EU- CR | 0.405 | 9.939 | 0.000 | 3.231 | Supported |
| H4 | PE- CR | 0.230 | 5.033 | 0.000 | 4.150 | Supported |
| H5 | SN- CR | -0.110 | 2.380 | 0.017 | 4.393 | *Supported |
| Support in the opposite direction. | ||||||
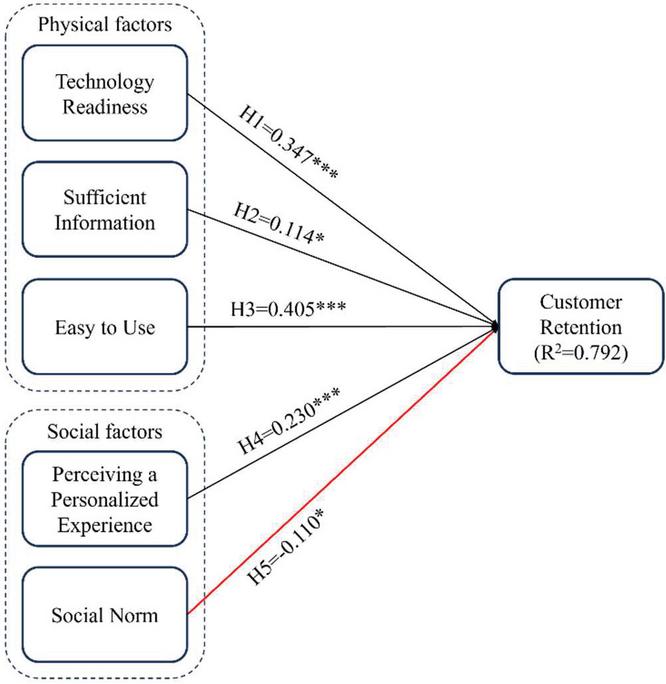
Figure 3 Summary of hypothesis testing results. *p-value 0.05; ***p-value 0.001.
This study identifies AI-Powered Personalization as a key influence on customer retention in online shopping by examining both physical factors (TR, SI, and EU) and social factors (PE and SN) through CPB to understand the underlying mechanisms of customer retention in AI-driven e-commerce platforms. The structural model showed that Perceived Personalization (PE) had the strongest positive effect on customer retention (, p 0.001). In contrast, Social Norms (SN) demonstrated a significant but negative relationship with retention (, p 0.05), suggesting that heightened sensitivity to social expectations may reduce consumers’ willingness to engage with AI-driven shopping. The findings provide valuable insights for designing online shopping platforms, particularly regarding SN (social norms), as some customer segments still express concerns about social expectations and confidence in AI-powered online shopping, particularly in relation to personal data security and privacy. To address these concerns, sellers and platform providers should prioritize clear and transparent communication about security measures and data protection within AI-driven shopping experiences. Strengthening trust in AI-powered personalization not only enhances customer confidence but also improves the overall shopping experience, drives sales growth, and can create customer retention.
This study presents a new perspective on AI-Powered Personalization and the role of physical factors (TR, SI, EU) and social factors (PE, SN) in influencing customer retention in online shopping. However, the individual factors have not been clearly grouped into the two main categories – physical and social factors – for comparative interpretation. Unlike previous research, which primarily focuses on user experience (UX/UI), AI efficiency, and ease of use, this study emphasizes the impact of social norms (SN) and perceived experience (PE) on customer trust and confidence in AI adoption, an area that has been largely overlooked. Yet, the individual factors have not been clearly grouped into the two main categories – physical and social – for comparative interpretation. While prior studies have been dedicated to improving AI technology performance, this research highlights the importance of transparent communication regarding security measures and data protection as a key factor in fostering customer confidence in AI-powered online shopping, offering a new approach beyond solely enhancing AI capabilities.
Table 8 Example of practical guidelines for AI-powered personalization in online shopping
| Area | Practical Measure | Intended Outcome |
| Transparency [62] | Clearly communicate how AI personalization works and what data is collected | Increase customer trust and reduce uncertainty |
| Ethical AI Practices [63] | Implement regular audits to detect algorithmic bias and ensure fairness | Promote responsible use of AI and fair treatment |
| User Education [64] | Provide accessible explanations and visual guides on AI usage in recommendations | Empower users and improve engagement |
This study offers both theoretical and practical implications for AI-powered online shopping. Theoretically, it advances existing research by integrating physical factors (TR, SI, EU) and social factors (SN, PE) to develop a new conceptual model [61] and gain deeper insights into customer retention in AI-driven e-commerce. Practically, the findings emphasize the importance of transparent communication on AI security and data protection to foster customer trust and confidence. Sellers and online providers should prioritize enhancing transparency, ethical AI practices, and user education to strengthen customer satisfaction and engagement and create customer retention. Table 8 provides an example of actionable measures derived from the findings, offering practical suggestions to support the development of AI-driven e-commerce platforms.
This study examines AI-Powered Personalization and the influence of physical factors (TR, SI, EU) and social factors (PE, SN) on customer retention in online shopping platforms in Thailand, utilizing CPB as a conceptual model to explore the mechanisms of customer retention in AI-driven online shopping. The findings reveal that social factors, particularly SN (Social Norms), continue to play a crucial role in shaping customer confidence in AI-powered online shopping platforms. Many customer segments remain concerned about data security and privacy measures. Sellers or online providers that build trust in AI-powered personalization not only increase customer confidence and security but also enhance the online shopping experience and strengthen customer retention.
Despite the valuable insights offered by this study, several limitations should be acknowledged as they may influence the interpretation and generalizability of the findings.
First, the sampling was limited to consumers who had prior experience with AI-powered online shopping platforms. As a result, the study may not capture the perspectives of non-users or late adopters, potentially overlooking barriers to adoption and limiting the explanatory power regarding initial resistance to AI personalization.
Second, the context-specific focus on Thailand’s online shopping environment may influence behavioral patterns that are unique to local market dynamics. Therefore, the generalizability of the findings to global or culturally diverse markets should be approached with caution.
Third, the study primarily examined physical and social factors affecting customer retention, without including psychological or behavioral variables such as trust, perceived risk, or decision-making complexity. This may restrict the comprehensiveness of the model and exclude latent constructs that could play a significant role in consumer retention decisions in AI-driven platforms.
• Study consumer groups that have never used AI-Powered Personalization – to understand the factors that hinder their decision-making and ways to increase acceptance of AI technology. Future research should examine the extent to which overcoming these barriers contributes to improving customer retention.
• Expand the study to a global context – to analyze differences in consumer behavior in international online markets and enable the application of the results in a broader context. It would be beneficial to assess the strength of influence that cultural and regional variations have on customer retention through AI personalization.
• Add new variables to the study – should include psychological factors (e.g., trust in AI technology) and behavioral factors (e.g., decision-Making process) to gain a more comprehensive understanding of the factors that affect customer retention. Future studies may explore the degree to which each factor contributes positively to retention.
• Study the potential of AI [65] in other areas – should analyze the feasibility of applying AI in Metaverse Shopping, Augmented Reality (AR), Quantum Technology [66] to enhance the shopping experience and enhance the capabilities of AI-powered online shopping platforms. Subsequent research could evaluate how such innovations influence long-term customer engagement and retention.
[1] CR Team, “E-Commerce in Thailand: Market Trends, Statistics, and Insights,” Oosga. Accessed: Mar. 02, 2025. [Online]. Available: https://oosga.com/e-commerce/tha/.
[2] Simon Kemp, “Digital 2024: Thailand,” DataReportal. Accessed: Mar. 02, 2025. [Online]. Available: https://datareportal.com/reports/digital-2024-thailand.
[3] M. A. Raji, H. B. Olodo, T. T. Oke, W. A. Addy, O. C. Ofodile, and A. T. Oyewole, “E-commerce and consumer behavior: A review of AI-powered personalization and market trends,” GSC Advanced Research and Reviews, vol. 18, no. 3, pp. 66–77, 2024.
[4] B. Wu, X. Deng, and X. Cui, “Cash on delivery or online payment: mobile channel, order size and payment methods,” Journal of Contemporary Marketing Science, vol. 3, no. 2, pp. 225–242, 2020.
[5] L. Xiaoyan, H. Lei, and C. Xin, “Interest-free installment payment strategy for retailers under third party payment platform,” in Proceedings of the 4th International Conference on Industrial and Business Engineering, 2018, pp. 29–33.
[6] M. Jara, D. Vyt, O. Mevel, T. Morvan, and N. Morvan, “Measuring customers benefits of click and collect,” Journal of Services Marketing, vol. 32, no. 4, pp. 430–442, 2018.
[7] M. E. Kruk, G. Mbaruku, P. C. Rockers, and S. Galea, “User fee exemptions are not enough: out-of-pocket payments for ‘free’delivery services in rural Tanzania,” Tropical medicine & international health, vol. 13, no. 12, pp. 1442–1451, 2008.
[8] Y. Wang, F. Xu, Z. Lin, J. Guo, and G. Li, “Community Group Purchasing of Next-Day Delivery: Bridging the Last Mile Delivery for Urban Residents during COVID-19,” Sustainability, vol. 16, no. 16, p. 7233, 2024.
[9] Y. Jiang, Y. Liu, H. Wang, J. Shang, and S. Ding, “Online pricing with bundling and coupon discounts,” Int J Prod Res, vol. 56, no. 5, pp. 1773–1788, 2018.
[10] P. Jiang and B. Rosenbloom, “Customer intention to return online: price perception, attribute-level performance, and satisfaction unfolding over time,” Eur J Mark, vol. 39, no. 1/2, pp. 150–174, 2005.
[11] T. Fernandes and R. Pedroso, “The effect of self-checkout quality on customer satisfaction and repatronage in a retail context,” Service Business, vol. 11, pp. 69–92, 2017.
[12] L. Zhou, P. Zhang, and H.-D. Zimmermann, “Social commerce research: An integrated view,” Electron Commer Res Appl, vol. 12, no. 2, pp. 61–68, 2013.
[13] A. Kushnarevych, “Building Loyalty Programs with AI-Powered Online Tools,” in 2024 IEEE 24th International Symposium on Computational Intelligence and Informatics (CINTI), IEEE, 2024, pp. 185–190.
[14] N. Hajli, “Social commerce constructs and consumer’s intention to buy,” Int J Inf Manage, vol. 35, no. 2, pp. 183–191, 2015.
[15] J.-S. Chen, L. Tran-Thien-Y, and D. Florence, “Usability and responsiveness of artificial intelligence chatbot on online customer experience in e-retailing,” International Journal of Retail & Distribution Management, vol. 49, no. 11, pp. 1512–1531, 2021.
[16] G. Askalidis and E. C. Malthouse, “The value of online customer reviews,” in Proceedings of the 10th ACM Conference on Recommender Systems, 2016, pp. 155–158.
[17] J. W. Wiktor and K. Sanak-Kosmowska, “The competitive function of online advertising. An empirical evaluation of companies’ communication strategies in a digital world,” Procedia Comput Sci, vol. 192, pp. 4158–4168, 2021.
[18] E. Gingerich, “‘ Eco-Friendly’ Marketing: Beyond the Label,” Journal of Applied Business and Economics, vol. 17, no. 3, 2015.
[19] D. I. Hajati, “The The Effect of Cash on Delivery, Online Consumer Rating and Reviews on the Online Product Purchase Decisions,” Business Innovation and Entrepreneurship Journal, vol. 4, no. 1, pp. 18–26, Mar. 2022, doi: 10.35899/biej.v4i1.348.
[20] S. Maesen and D. Ang, “Buy Now, Pay Later: Impact of Installment Payments on Customer Purchases,” J Mark, p. 00222429241282414, Sep. 2024, doi: 10.1177/00222429241282414.
[21] M. Jin, G. Li, and T. C. E. Cheng, “Buy online and pick up in-store: Design of the service area,” Eur J Oper Res, vol. 268, no. 2, pp. 613–623, 2018.
[22] H. Buldeo Rai, S. Verlinde, and C. Macharis, “The ‘next day, free delivery’ myth unravelled: Possibilities for sustainable last mile transport in an omnichannel environment,” International Journal of Retail & Distribution Management, vol. 47, no. 1, pp. 39–54, 2019.
[23] P. Wang, R. Du, and Q. Hu, “How to promote sales: Discount promotion or coupon promotion?,” J Syst Sci Syst Eng, vol. 29, pp. 381–399, 2020.
[24] P. Mandal, P. Basu, and K. Saha, “Forays into omnichannel: An online retailer’s strategies for managing product returns,” Eur J Oper Res, vol. 292, no. 2, pp. 633–651, 2021, doi: https://doi.org/10.1016/j.ejor.2020.10.042.
[25] T. Fernandes and R. Pedroso, “The effect of self-checkout quality on customer satisfaction and repatronage in a retail context,” Service Business, vol. 11, pp. 69–92, 2017.
[26] T. Petcharat, A. Jattamart, and A. Leelasantitham, “A conceptual model to imply a negative innovation assessment framework on consumer behaviors through the electronic business platforms,” Journal of Retailing and Consumer Services, vol. 74, Sep. 2023, doi: 10.1016/j.jretconser.2023.103450.
[27] X.-J. Lim, J.-H. Cheah, D. S. Waller, H. Ting, and S. I. Ng, “What s-commerce implies? Repurchase intention and its antecedents,” Marketing Intelligence & Planning, vol. 38, no. 6, pp. 760–776, 2020.
[28] N. Patel and S. Trivedi, “Leveraging predictive modeling, machine learning personalization, NLP customer support, and AI chatbots to increase customer loyalty,” Empirical Quests for Management Essences, vol. 3, no. 3, pp. 1–24, 2020.
[29] E. O. Sodiya et al., “AI-driven personalization in web content delivery: A comparative study of user engagement in the USA and the UK,” World Journal of Advanced Research and Reviews, vol. 21, no. 2, pp. 887–902, 2024.
[30] F. R. Sofiyah, A. Dilham, A. Q. Hutagalung, Y. Yulinda, A. S. Lubis, and J. L. Marpaung, “The chatbot artificial intelligence as the alternative customer services strategic to improve the customer relationship management in real-time responses,” International Journal of Economics and Business Research, vol. 27, no. 5, pp. 45–58, 2024.
[31] A. Elwalda, K. Lü, and M. Ali, “Perceived derived attributes of online customer reviews,” Comput Human Behav, vol. 56, pp. 306–319, 2016.
[32] L. Chen and F. Zhu, “Seller information sharing in online marketplaces,” Journal of Marketing Management, vol. 37, no. 11–12, pp. 1191–1218, 2021.
[33] I. Rizomyliotis, “Consumer trust and online purchase intention for sustainable products,” American Behavioral Scientist, p. 00027642241236174, 2024.
[34] P. Puengwattanapong and A. Leelasantitham, “A Holistic Perspective Model of Plenary Online Consumer Behaviors for Sustainable Guidelines of the Electronic Business Platforms,” Sustainability (Switzerland), vol. 14, no. 10, May 2022, doi: 10.3390/su14106131.
[35] B. Sarwar, G. Karypis, J. Konstan, and J. Riedl, “Item-based collaborative filtering recommendation algorithms,” in Proceedings of the 10th international conference on World Wide Web, 2001, pp. 285–295.
[36] D. Jannach, L. Lerche, F. Gedikli, and G. Bonnin, “What recommenders recommend–an analysis of accuracy, popularity, and sales diversity effects,” in User Modeling, Adaptation, and Personalization: 21th International Conference, UMAP 2013, Rome, Italy, June 10-14, 2013 Proceedings 21, Springer, 2013, pp. 25–37.
[37] X. Su and T. M. Khoshgoftaar, “A survey of collaborative filtering techniques,” Advances in artificial intelligence, vol. 2009, no. 1, p. 421425, 2009.
[38] S. Zhang, L. Yao, A. Sun, and Y. Tay, “Deep learning based recommender system: A survey and new perspectives,” ACM computing surveys (CSUR), vol. 52, no. 1, pp. 1–38, 2019.
[39] D. Goutam, S. Ganguli, and B. V Gopalakrishna, “Technology readiness and e-service quality–impact on purchase intention and loyalty,” Marketing Intelligence & Planning, vol. 40, no. 2, pp. 242–255, 2022.
[40] M. B. Gulfraz, M. Sufyan, M. Mustak, J. Salminen, and D. K. Srivastava, “Understanding the impact of online customers’ shopping experience on online impulsive buying: A study on two leading E-commerce platforms,” Journal of Retailing and Consumer Services, vol. 68, Sep. 2022, doi: 10.1016/j.jretconser.2022.103000.
[41] V. Frick and E. Matthies, “Everything is just a click away. Online shopping efficiency and consumption levels in three consumption domains,” Sustain Prod Consum, vol. 23, pp. 212–223, 2020, doi: https://doi.org/10.1016/j.spc.2020.05.002.
[42] Y. Gao and H. Liu, “Artificial intelligence-enabled personalization in interactive marketing: a customer journey perspective,” Journal of Research in Interactive Marketing, vol. 17, no. 5, pp. 663–680, Oct. 2023, doi: 10.1108/JRIM-01-2022-0023.
[43] P. Kalia, A. Zia, and K. Kaur, “Social influence in online retail: A review and research agenda,” European Management Journal, vol. 41, no. 6, pp. 1034–1046, 2023, doi: https://doi.org/10.1016/j.emj.2022.09.012.
[44] D. Gefen and D. Straub, “Managing user trust in B2C e-services,” e-Service, vol. 2, no. 2, pp. 7–24, 2003.
[45] C.-M. Chiu, E. T. G. Wang, Y.-H. Fang, and H.-Y. Huang, “Understanding customers’ repeat purchase intentions in B2C e-commerce: the roles of utilitarian value, hedonic value and perceived risk,” Information Systems Journal, vol. 24, 2014, [Online]. Available: https://api.semanticscholar.org/CorpusID:14634454.
[46] E. Pantano and M. Viassone, “Engaging consumers on new integrated multichannel retail settings: Challenges for retailers,” Journal of Retailing and Consumer Services, vol. 25, pp. 106–114, 2015, doi: https://doi.org/10.1016/j.jretconser.2015.04.003.
[47] S. Yang, Y. Lu, S. Gupta, Y. Cao, and R. Zhang, “Mobile payment services adoption across time: An empirical study of the effects of behavioral beliefs, social influences, and personal traits,” Comput Human Behav, vol. 28, no. 1, pp. 129–142, 2012.
[48] X. Wang, C. Yu, and Y. Wei, “Social media peer communication and impacts on purchase intentions: A consumer socialization framework,” Journal of interactive marketing, vol. 26, no. 4, pp. 198–208, 2012.
[49] B. Berman and S. Thelen, “Planning and implementing an effective omnichannel marketing program,” International Journal of Retail & Distribution Management, vol. 46, no. 7, pp. 598–614, 2018.
[50] N. Janakiraman, H. A. Syrdal, and R. Freling, “The Effect of Return Policy Leniency on Consumer Purchase and Return Decisions: A Meta-analytic Review,” Journal of Retailing, vol. 92, no. 2, pp. 226–235, Jun. 2016, doi: 10.1016/j.jretai.2015.11.002.
[51] D. Gefen, E. Karahanna, and D. W. Straub, “Trust and TAM in online shopping: An integrated model,” MIS quarterly, pp. 51–90, 2003.
[52] R. N. Bolton, P. K. Kannan, and M. D. Bramlett, “Implications of loyalty program membership and service experiences for customer retention and value,” J Acad Mark Sci, vol. 28, no. 1, pp. 95–108, 2000.
[53] B. Lu, W. Fan, and M. Zhou, “Social presence, trust, and social commerce purchase intention: An empirical research,” Comput Human Behav, vol. 56, pp. 225–237, 2016.
[54] J. A. Chevalier and D. Mayzlin, “The effect of word of mouth on sales: Online book reviews,” Journal of marketing research, vol. 43, no. 3, pp. 345–354, 2006.
[55] I. Simonson and A. Tversky, “Choice in context: Tradeoff contrast and extremeness aversion,” Journal of marketing research, vol. 29, no. 3, pp. 281–295, 1992.
[56] M. R. Gleim, J. S. Smith, D. Andrews, and J. J. Cronin Jr, “Against the green: A multi-method examination of the barriers to green consumption,” Journal of retailing, vol. 89, no. 1, pp. 44–61, 2013.
[57] J. F. Hair Jr, L. M. Matthews, R. L. Matthews, and M. Sarstedt, “PLS-SEM or CB-SEM: updated guidelines on which method to use,” International Journal of Multivariate Data Analysis, vol. 1, no. 2, pp. 107–123, 2017.
[58] R. M. O’brien, “A caution regarding rules of thumb for variance inflation factors,” Qual Quant, vol. 41, pp. 673–690, 2007.
[59] C. Fornell and D. F. Larcker, “Evaluating structural equation models with unobservable variables and measurement error,” Journal of marketing research, vol. 18, no. 1, pp. 39–50, 1981.
[60] G. W. Cheung, H. D. Cooper-Thomas, R. S. Lau, and L. C. Wang, “Reporting reliability, convergent and discriminant validity with structural equation modeling: A review and best-practice recommendations,” Asia Pacific Journal of Management, vol. 41, no. 2, pp. 745–783, Jun. 2024, doi: 10.1007/s10490-023-09871-y.
[61] A. Leelasantitham, “A Novel Guideline Framework for Research and Development in the Field of Management of Technology and Innovation,” in 2024 5th Technology Innovation Management and Engineering Science International Conference (TIMES-iCON), IEEE, Jun. 2024, pp. 1–5. doi: 10.1109/TIMES-iCON61890.2024.10630775.
[62] F. Pasquale, The black box society: The secret algorithms that control money and information. Harvard University Press, 2015.
[63] L. Floridi and J. Cowls, “A unified framework of five principles for AI in society,” Machine learning and the city: Applications in architecture and urban design, pp. 535–545, 2022.
[64] D. Shin, “User perceptions of algorithmic decisions in the personalized AI system: Perceptual evaluation of fairness, accountability, transparency, and explainability,” J Broadcast Electron Media, vol. 64, no. 4, pp. 541–565, 2020.
[65] A. Nirapai and A. Leelasantitham, “A new adoption model for quality of experience assessed by radiologists using AI medical imaging technology,” Journal of Open Innovation: Technology, Market, and Complexity, vol. 10, no. 3, Sep. 2024, doi: 10.1016/j.joitmc.2024.100369.
[66] N. Chaipunha, V. Panya, and A. Leelasantitham, “Analytical Challenges of Quantum and Classical Computing in Thailand: A Comparative Exploration of Machine Learning Through Classification,” in 2024 5th Technology Innovation Management and Engineering Science International Conference (TIMES-iCON), IEEE, 2024, pp. 1–5.

Vicha Panya (Ph.D. Candidate) received the B.Eng. degree in Computer Engineering from Kasetsart University, Thailand and the M.M. degree in General Management from College of Management, Mahidol University, Thailand, in 2004, respectively.

Prush Sa-nga-ngam is a lecturer of Information Technology Management at the Faculty of Engineering, Mahidol University, Thailand. He holds a bachelor’s degree in Mechanical Engineering, a master’s degree in the Technology of Information System Management, and a Ph.D. in Information Technology Management, all from Mahidol University. His research interests include management information systems, cloud computing, cybersecurity, usability, and user experience. He served as a board member of the Association of Thai Digital Industry and is deeply committed to advancing the field of information technology through cutting-edge research and innovation.

Adisorn Leelasantitham (Ph.D.) received the B.Eng. degree in Electronics and Telecommunications and the M.Eng. degree in Electrical Engineering from King Mongkut’s University of Technology Thonburi (KMUTT), Thailand, in 1997 and 1999, respectively. He received his Ph.D. degree in Electrical Engineering from Sirindhorn International Institute of Technology (SIIT), Thammasat University, Thailand, in 2005. He is currently the Associate Professor in Technology of Information System Management Division, Faculty of Engineering, Mahidol University, Thailand. His research interests include applications of blockchain technology, conceptual models and frameworks for IT management, disruptive innovation, image processing, AI, neural networks, machine learning, IoT platforms, data analytics, chaos systems, and healthcare IT. He is a member of the IEEE.
Journal of Mobile Multimedia, Vol. 21_2, 307–342.
doi: 10.13052/jmm1550-4646.2125
© 2025 River Publishers