VLF Dielectric Response and HF Localized Dielectric Discharge Measurement for Rotating Machine Insulation Assessment
P. Nimsanong and N. Pattanadech*
Department of Electrical Engineering, Faculty of Engineering, King Mongkut’s Institute of Technology Ladkrabang, Chalongkrung Road, Ladkrabang, Bangkok 10520, Thailand
E-Mail: phethai.ni@gmail.com; norasage.pa@kmitl.ac.th
* Corresponding Author
Received 01 May 2020; Accepted 14 May 2020; Publication 17 August 2020
Abstract
This paper represents the very low frequency (VLF) dielectric response and high frequency (HF) localized dielectric discharge measurement for rotating machine insulation assessment. The integral conditions of stator winding insulation, the so-called aging condition, were investigated by the dielectric response measuring technique. The polarization and depolarization currents in the VLF range from 0.0001 to 1 Hz were measured under an external step electric field. The local conditions of stator winding insulation, the so-called weak spot condition, were examined by the partial discharge (PD) measuring technique. The PD pulse currents were detected by a capacitive sensor in a wide-band range, where the bandwidth of the measuring system was set between 30 kHz and 30 MHz. The medium voltage rotating machine rated 6.6 kV and 240 to 2,270 kW under different service conditions, i.e., new stator winding, moisture contamination, dirt contamination as well as thermally and severely aged insulation, was studied. Besides, four case studies on measuring the PD in service rotating machines rated 11–15 kV, 7100 to 211,000 kW as well as the attenuation of the PD pulses were conducted and demonstrated. With several case studies, this paper introduces new dielectric parameters, the so-called charge ratio (QR) and charge difference gradient (QDG), to identify the dielectric mechanism occurring in the stator winding insulation caused by the polarization and conduction processes. It can be concluded that the proposed parameters are a valuable tool for assessing the aging condition. In the case of the PD measurement, it was found that the PD pulse is strongly attenuated in the slot section. This paper also introduces the combination of both the dielectric response and PD measurement results, which can be very useful for assessing a complete insulation condition in the rotating machine. Moreover, the criteria for insulation conditions are suggested in this paper to evaluate the integral and local conditions for the rotating machine insulation. The local discharge in the machine causes electromagnetic waves, which may get released from the non-perfect characteristics of the enclosure. This signal may interfere with the functioning of other nearby electronic devices, especially the communication equipment. Therefore, maintaining the excellent condition of the insulation system by the proposed technique detailed in this paper will support the highly effective operational efficiency of the communication system as well.
Keywords: Stator winding insulation, dielectric response measurement, partial discharge measurement, polarization and depolarization current, pulse attenuation.
1 Introduction
Medium voltage (MV) rotating machines are widely used in many applications in the industry sectors, such as in the power plants, in the chemical industries, in the oil and gas industries, in the metal industries, etc. The increasing conductivity in bulk and overhang insulation, insulation delamination, insulation abrasion and weak spots are responsible for insulation degradation that significantly reduces the life of the MV rotating machine [1, 2].
To extend the service life of the MV rotating machine, non-destructive testing techniques like the insulation resistance (IR) measurement, the polarization index (PI) measurement and the capacitance and power factor tip-up measurement are commonly performed to detect any insulation defects and to track the integral insulation condition [3–6]. Unfortunately, conventional parameters such as the PI and IR are estimated from a charging current measured, which is caused by the superposition of the polarization and the conduction currents in dielectric used, while the capacitance and power factor tip-up measurement provide vague information with reference to conductivity loss, polarization loss and ionization loss. Therefore, it is difficult to apply such non-destructive testing techniques for identifying the problems of the stator winding insulation. To overcome this deficiency, this paper introduces the very low frequency (VLF) dielectric response and high frequency (HF) partial discharge (PD) measurement technique. The dielectric response measurement results were analysed with the proposed dielectric parameters, i.e., charge ratio and charge difference gradient (QR and QDG, respectively) to separate conductivity loss from polarization loss. However, the PD measurement result provides precise estimation about ionization phenomena occurring at a weak spot.
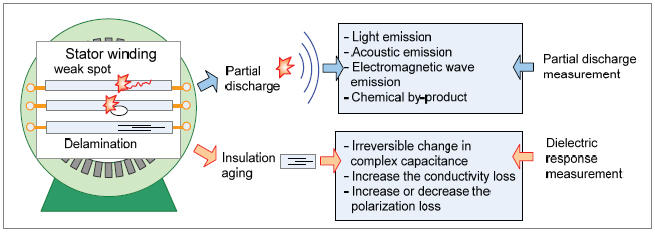
Figure 1 Overview of insulation diagnostics of rotating machine.
2 Dielectric Response Under an External Step Field
As shown in Figure 2 the two main responses exhibited by insulation material subjected to a step voltage U(t) are the conduction mechanism (which causes the conduction current) and the polarization mechanism (which causes the polarization current) [7–11].
2.1 Electrical conduction mechanism
As described by equation (1), the electrical conduction mechanism is caused by the step electric field E(t) which excites the current density Jσ(t) of the insulation material within the cross-sectional area Ageo with conductivity σ determined by the number of charge carriers and the mobility of these charges. The conductivity response of the dielectric material is much stronger in the lower frequency ranges, while at higher frequencies, the conductivity response tends to be much smaller and sometimes insignificant:
| (1) |
2.2 Polarization mechanism
As described by equation (2), the polarization mechanism is caused by a stress E-field, which is not strong enough to cause significant damage to the insulation material. Under the step electric field E(t), the polarization P0(t) is a linear function with the E-field. The polarization phenomena increase the charge density at the electrodes expressed in equation (2):
| (2) |
In this research work, the two polarization processes under consideration are quick polarization Pquick and slow polarization Pslow (interfacial polarization, Pi). The dielectric response test results using the PDC analysis in the experiment shows that the rise time Tr of the step field E(t) is of much longer duration than the relaxation time τd due to the quick polarization which is caused by internal impedance of the voltage source of the PDC analyser. Therefore, electric susceptibility due to rapid polarization χquick is determined to be a constant value as in equations (3a)–(3c). During relatively slow polarization, the electric susceptibility due to the slow polarization χslow is exponentially tending towards χi(∞) as shown in equations (4a)–(4d):
| (3a) | |
| (3b) | |
| (3c) |
where Pel(t), Pio(t) and Pd(t) are electronic, ionic and dipolar polarizations, respectively. Nel, Nio and Nd are the number of dipoles per unit volume of electronic, ionic and dipolar polarizations, respectively. Further, αe, αio and αd are polarizability of electronic, ionic and dipolar polarizations, respectively:
| (4a) | |
| (4b) | |
| (4c) | |
| (4d) |
where Pi(t) is the interfacial polarization, χi(∞) is the steady state end value of the electric susceptibility due to slow polarization and fi(t) is the dielectric response function.
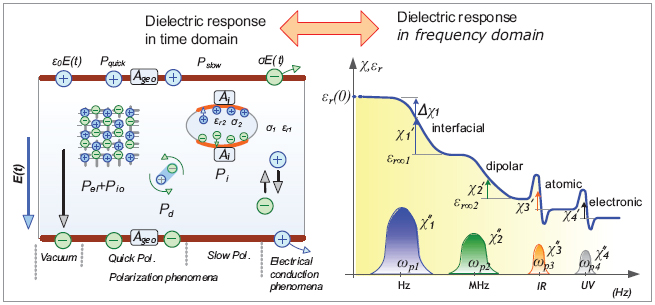
Figure 2 Dielectric behaviours for insulating material in time and frequency domains.
The equations describing the time dependency of electric susceptibility under the step field E(t) are shown in Figure 2.
The step response P0(t) in time domain due to all polarization processes is shown in equations (5a) and (5b):
| (5a) | |
| (5b) |
3 Dielectric Mechanisms in Stator Winding Insulation
Dielectric mechanisms occurring in the stator winding insulation under a step field depend on the insulation materials and the structure of the insulation system. The construction of stator coils used for the MV machine typically as a form-wound winding is comprised of copper strands, turn insulations (enamelled wires and fibres), ground wall insulations (mica tapes or glasses) and semiconducting layers. To form the insulation system of the MV machines, the insulations at the bottom of the stator slots, the insulations between two coils in the same stator slot and the insulations under a slot wedge are needed. The air gaps and spacers are used as well to insulate coils from each other in the overhang portion.
3.1 Conduction mechanisms in stator winding insulation
Figure 3(a) depicts an example of electrical conduction mechanisms occurring in/on the MV form-wound winding insulation. Considering the modern MV machine insulation system, a well-bonded polyester and epoxy-mica insulation are utilized by which free charge carriers (1) that pass through the bulk insulation are essentially zero unless the insulation is partially or fully saturated with the moisture from the atmosphere. However, degradation of the epoxy-mica insulation that has undergone thermal aging may increase the free charge carriers resulting in the increase of electrical conductivity. For conduction mechanism occurring in/on the overhang insulation of the end-winding turns (2)–(4) and in the spacers separating the coils between the different phases (5) and (6), the surface leakage current depends on the electric field distribution on the resistive potential grading used, type and amount of the conductive contamination, moisture and temperature also.
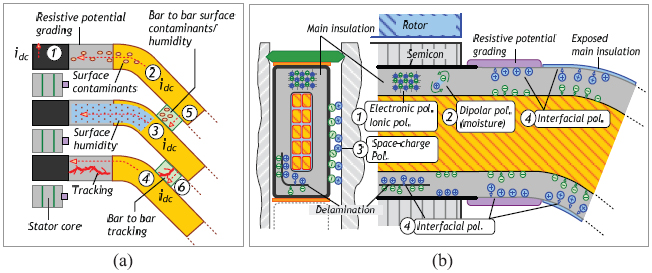
Figure 3 Example of dielectric mechanisms in the stator winding insulation (a) conduction mechanisms (b) polarization mechanisms.
3.2 Polarization mechanisms in stator winding insulation
Figure 3(b) illustrates an example of the polarization mechanisms in the MV form-wound winding insulation. When the winding insulation is under a step field, such insulation contributes to several polarization mechanisms. It induces charges on the electrode surface to compensate for the external applied electric field [11]. Electronic and atomic polarization (1) occurs due to neutral atoms that have displaced with quick relaxation times (optical frequencies). However, if the mica insulation is saturated with moisture from the atmosphere, dipolar polarization (2) might also be evident with short relaxation times (UHF to X-band frequencies). Interfacial polarization processes the accumulation of free charge carriers (3) in a region such as near the copper strand, stator core and the end-winding portion. Besides, the charge carriers (4) can migrate and accumulate at the interface in mica tape layers, as well as accumulate (contamination) on the surface of end winding.
4 PD in Rotating Machine
In stator windings rated 6 kV and above, the partial discharge inception and extinction voltage (PDIV and PDEV) for new machines are commonly below the rated line-to-ground operating voltage. This means that the mica in the main insulation is designed to resist the PD usually at a low-level in the range of 1000 pC for an exceptionally long time, which is non-hazardous to insulation. However, the stator winding insulation of a rotating machine undergoes aging due to the operating conditions. Thermal, electrical, vibrational, and thermo-mechanical stresses act on the stator insulation during the service of the machine. These stresses cause a weak spot in the insulation system. At the weak spot, the electric strength or breakdown strength at a defect site is significantly lower than the electrical stress, resulting in occurrence of the PD. Figure 4 shows the potential PD sources that can occurr in the stator winding of a rotating machine.
5 Dielectric Response Parameter Analysis
5.1 Charge difference analysis
From the dielectric response measurement, charge difference value (Qdiff) is calculated by equations (6)–(8). This parameter provides an amount of the non-stored charge passed through the insulation system under a step field. This paper introduces the dielectric parameter, the so-called charge difference gradient (QDG), to assess the conduction problem caused by free charge carriers (contaminants) in bulk insulation and on overhang insulation. The QDG is proportional to the conductivity of the insulation system equation (9):
| (6) |
| (7) |
| (8) |
| (9) |

Figure 4 Partial discharge sources in the stator winding of a rotating machine.
5.2 Charge ratio analysis
Another dielectric parameter introduced in this paper is the QR. The QR is the ratio of the accumulation of charge carriers (Qd) to the charge carrier (Qgeo). Further, the Qd originates from the interfacial polarization process recorded after 1 second by integration depolarization current, whereas the Qgeo is induced from dipolar polarization processes expressed as in equations (10)–(13):
| (10) |
| (11) |
| (12) |
| (13) |
Note: Partial resistance (Ri) and partial capacitance (Ci) are the dielectric parameters related to the relaxation time of the interfacial polarization process. Further, Ri and Ci can be estimated by using a curve-fitting technique applied to the depolarization current. Cgeo is the geometrical capacitance or high-frequency capacitance, explained in Ref. [11].
6 PD Parameter Analysis
6.1 PD magnitude
To assess the severity of the PD sources, both the discharge magnitude and the discharge frequency are important. The discharge magnitude or apparent charge is related to the size of a defect on stator insulation, and discharge frequency is associated with the erosion of insulating material. Therefore, the PD magnitude weighted, the so-called QIEC, is recommended and specified in IEC 60270. This means that the QIEC is involved in the discharge magnitude, discharge frequency and measuring bandwidth of a PD pulse. The process for determining the QIEC is shown in Figure 5.

Figure 5 The process for determining the PD magnitude weighted.
6.2 Attenuation factor of the PD pulse
To study the attenuation of the PD pulse travelling through the winding, this research introduces the attenuation factor, as shown in equation (14). After normalization of the PD measuring circuit with the PD detection capacitor connected at the phase terminals, QmT is measured by injecting a known standard charge, QA, with the PD calibrator at the phase terminal, whereas QmN is measured by injecting the QA at the neutral end:
| (14) |
6.3 Hysteresis analysis
For evaluating the PDIV and PDEV as well as the types of PD sources, the test voltage profile applied to insulation is carried out, as shown in Figure 6, and the PD amplitude is monitored via the hysteresis test. The PDIV, PDEV and PD sources can be investigated by applying the hysteresis curve. Both the PDIV and PDEV provide information about the aging rate of insulation. If the PDIV and PDEV remain constant over time, it reveals that there is little aging. However, if the PDEV and PDIV significantly decrease over time, it implies that the winding insulation is deteriorating due to one or more of the many degradation mechanisms.

Figure 6 Profile of the test voltage and hysteresis PD characteristics.
7 Dielectric Response Experiments
In this section, applications of the proposed dielectric parameters (QDG and QR) for insulation diagnosis of service motors are implemented to assess the insulation condition of MV motors, as listed in Table 1. These motors rated at 6.6 kV and 240 to 2,270 kW have been serviced under different conditions. The class F insulation manufactured under the Global Vacuum Pressure Impregnation technology is used as the insulation of the stator windings of these motors. The experiments are conducted to verify the effectiveness of the proposed diagnostic parameters in practice. The diagnostic parameters, QDG and QR, analysed from relaxation current, are presented for each case study.
7.1 Dielectric response measurement circuit
The measuring circuit diagram and test voltage profile used to investigate the dielectric response of the MV motors in case 1–case 6 at ambient temperature (stabilized temperature) are shown in Figure 7.
7.2 Dielectric response test procedure
To perform the dielectric response measurement, a three-step process is as follows [13]. In the first step, in this process, only the depolarization current is measured to ascertain the amount of remaining charge inside the stator winding insulation. In the second step, this process is conducted to confirm that there are no abnormalities in the measuring circuit. A step test voltage of 10–50 V is applied to the insulation system for measuring the polarization current. Then, the test object is short-circuited. In the third step, a step test voltage is applied to the insulation system for 1,000 seconds. Then, the test object is short-circuited for 1,000 seconds. The polarization current and depolarization current obtained from this process are recorded and used to analyse further the dielectric characteristics of the stator winding insulation under test.
Table 1 Rotating machine details for dielectric response measurement.
| Case studies | kW | kV | Insulation condition |
| Case 1 | 400 | 6.6 | New stator winding |
| Case 2 | 240 | 6.6 | Moisture contamination |
| Case 3 | 240 | 6.6 | After cleaning |
| Case 4 | 2270 | 6.6 | Dirt contamination |
| Case 5 | 600 | 6.6 | Thermally aged |
| Case 6 | 300 | 6.6 | Severely aged |

Figure 7 Test circuit diagram for dielectric response measurement
8 PD Experiments
The purpose of the PD measurement is to investigate the symptom of insulation degradation by detecting the pulse currents caused by charge transfer in the defect site, according to the IEC 60270. Case studies on measuring the PD activity and case studies on measuring the PD pulse attenuation in field rotating machines rated 11-15 kV and 7,100 to 211,000 kW are conducted and demonstrated, as listed in Tables 2 and 3, respectively.
8.1 PD measurement circuit
Figure 8 shows the PD measurement setups and the test voltage profile performed on the investigated rotating machine at on-site.
8.2 PD test procedure
The test procedure for performing the PD measurement of this experiment can be divided into the following steps. At first, the measuring circuit was set up, as depicted in Figure 8. Then, the measuring frequency range was adjusted, and the measuring circuit was normalized with a known standard charge (apparent charge) via the terminals of the test object. Next, the background noise was recorded. After that, a stepped voltage was applied to the individual stator winding with a dwell time on each step of at least 10 seconds, one phase energized, whereas the other two connected to ground, and the stepped voltage was increased to the rated line-to-ground voltage while monitoring the PD pulses on a computer screen. The winding was energized at rated voltage, and then the PD magnitudes were recorded. Then, the stepped voltage was decreased to the voltage at which the PD was no longer discernibly measured. Finally, the PDIV, PD at the rated voltage, PDEV and the PD pattern were recorded.
Table 2 Rotating machine details for PD activity measurement
| Case studies | kW | kV | Insulation condition |
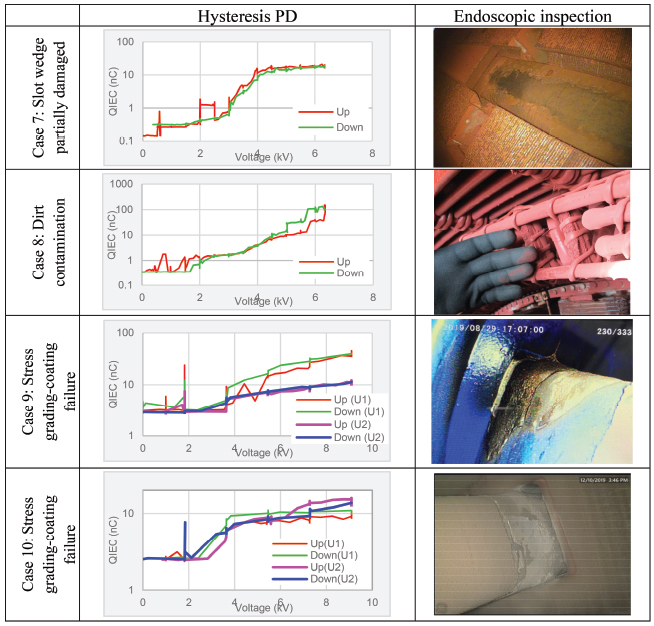
| Case 7 | 7,100 | 11.5 | Slot wedge partially damaged |
| Case 8 | 22,500 | 11.5 | Dirt contamination |
| Case 9 | 51,260 | 11.5 | Stress grading-coating failure |
| Case 10 | 211,500 | 15.7 | Stress grading-coating having problem |
Table 3 Rotating machine details for artificial PD pulse attenuation measurement
| Case studies | kW | kV | Configuration of phase terminal (PHT) and neutral end (NED) |
| Case 11 | 154,000 | 11.5 | PHT and NED positioned on the same side |
| Case 12 | 211,500 | 15.7 | PHT and NED positioned on the same side |
| Case 13 | 9,900 | 6.6 | PHT positioned on the opposite side of NED |
| Case 14 | 51,260 | 11.5 | PHT positioned on the opposite side of NED |

Figure 8 Test circuit diagram for partial discharge measurement.
9 Dielectric Response Measurement Results
The results of the dielectric response measurements for six case studies of various motors used with different service conditions are illustrated in Table 4, where the dielectric response measurement was performed with a 100 VDC step voltage. The polarization and depolarization currents were recorded for 1,000 seconds for each case study.
Table 4 Polarization and depolarization currents of the investigated motors

10 PD Measurement Results
Table 5 shows the PD measurement results as a function of test voltage (Ut) and time (t), and Table 6 shows the attenuation measurement results of the artificial PD pulses.
Table 5 PD measurement results of the investigated rotating machine
Table 6 Attenuation measurement results of the artificial PD pulse
| Case studies | Phase | QmT | QmS | %AF |
| Case 11: 154,000 kVA 11.5 kV PHT and NED positioned on the same side | U | 10nC | 5.3nC | 47% |
| V | 10nC | 7.4nC | 26% | |
| W | 10nC | 4.3nC | 57% | |
| Case 12: 211,000 kVA 15.7 kV PHT and NED positioned on the same side | U | 10nC | 3.8nC | 62% |
| V | 10nC | 3.2nC | 68% | |
| W | 10nC | 3.5nC | 65% | |
| Case 13: 9,900 kVA 6.6 kV PHT positioned on the opposite side of NED | U | 10nC | 0nC | 100% |
| V | 10nC | 0nC | 100% | |
| W | 10nC | 0nC | 100% | |
| Case 14: 511,260 kVA 11.5 kV PHT positioned on the opposite side of NED | U | 10nC | 0nC | 100% |
| V | 10nC | 0nC | 100% | |
| W | 10nC | 0nC | 100% |
11 Discussion
11.1 VLF dielectric response measurement
From the dielectric response measurement results in Table 4, the QDG and QR were evaluated and compared in Figure 9 using equations (9) and (13). Both the QDG and QR provide a reasonable estimate of the actual condition of the insulation for the rotating machines in this research.
The QDG is related to ionic activity inside stator insulation and or on the winding surface. The ionic activities inside stator insulation are caused by moisture owing to the ingress of water from the atmosphere and or by the oxidation process from the bonding of the oxygen with the broken end of the polymer chain due to thermal stress. Whereas, the ionic activities on the winding surface are caused by moisture or oil mixed with dirt, dust, salt, fly ash, chemicals, etc. The QR is associated with the free charge carriers trapped at mica tape that is debonded owing to the aging of insulation or trapped at any interface in the insulation system due to the mismatch between the dielectric properties of the material used.

Figure 9 (a) QDG curve of investigated motors (b) QR curve of investigated.
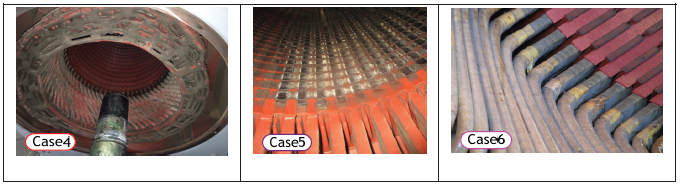
Figure 10 Thermographic image of investigated machines.
11.2 HF localized dielectric discharge measurement
From the PD measurement results in Table 5, the hysteresis PD curves were evaluated, as shown in Table 7. The hysteresis PD curves give useful information about the PDIV, PDEV and physical phenomena of the PD sources, which are used to compare the fingerprint in Figure 6. Further, the hysteresis PD curves provide the PD types better than the PRPD pattern, which sometimes provides imprecise or vague information for interpretation of the local insulation condition.
In the case of the attenuation measurement results of the artificial PD pulse, the %AF was evaluated and compared in Table 6 using equation (14). It seems that the PD measurement has a big issue regarding the intrinsic PD amplitude at a defect site due to the PD pulse being strongly attenuated when the PD pulse travels through the winding in the slot section. From the experiment, it was found that the PD activity at the defect site away from the PD sensor is not possible to detect. For this reason, the PD measurement should be performed both at the phase terminal and neutral ends.
11.3 Suggested criteria for condition assessment of MV motor
For the VLF dielectric response measurement, the proposed technique is a relatively new offline dielectric test of the rotating machine; therefore, it has no interpretation guide for assessing the aging condition. Based on the experimental and field measurement results of the authors, the suggested criteria for the aging condition are included in Table 8.
Table 7 Hysteresis PD analysis
For the HF localized dielectric discharge measurement, generally, the relevant IEEE and IEC standards do not propose a minimum value for the PD magnitude for the new or service machine. Therefore, the PD results are interpreted in comparison to one phase against another, one machine against other similar (in design and ratings) machines and interpreting the PD magnitude on the same phase over time. In case of no information about previous offline PD measurement, this paper introduces the suggested in-service criteria of the PD magnitude used to assess the insulation condition roughly, as illustrated in Table 9.
Table 8 Suggested criteria for condition assessment of medium voltage motor
| QDG value | Contamination/moisture | QR value | Degradation condition |
| <1E-9 | Low | <0.2 | Very dry |
| 1E-9–0.9E-8 | Moderate | 0.2–0.6 | Dry |
| 1E-8–0.9E-7 | High | 0.6–1.5 | Slightly wet |
| >1E-7 | Very high | >1.5 | Moisture aging |
Table 9 Suggested limit values of PD magnitude
| Suggests limit values of Qm (nC) |
Severity of PD sources | Insulation condition | |
| Slot section | End windings | ||
| <2 | <2 | Very low | Excellent |
| 2–5 | 2–5 | Low | Good |
| 5–10 | 5–15 | Medium | Acceptable |
| 10–15 | 15–20 | High | Poor |
| 15–20 | 20–50 | Very high | Inspection necessary |
| >20 | >50 | Hazardous | Potential problem |
The suggestion criteria will be useful for evaluation of the machine’s insulation. These criteria will help the operator to maintain the machine in a healthy condition by which the release of signals from the insulation defects can be avoided. Such criteria are beneficial for the maintenance planning of the machines used in industrial sectors, including machines that are used to support the communication systems.
12 Conclusion
From the experiments, it can be concluded that the proposed parameters are a valuable tool for assessing the aging condition. The QDG and the QR introduced in this paper have proved as the useful parameters applied for characterizing the insulation condition of the stator winding insulation. It is found that the proposed parameters can identify conductive contamination and/or insulation saturated with moisture and insulation degradation. The QDG provides information about the ionic activities on stator winding insulation. On the other hand, the QR gives crucial information regarding stored charge in the stator winding insulation at the mica tape layer or moisture aging. In the case of the PD measurement, the hysteresis PD curves give useful information about the PDIV, PDEV and physical phenomena of the PD source, which is used to compare the fingerprint, and it is found that the PD pulse is strongly attenuated in the slot section. Therefore, the PD measurement should be performed both at the phase terminal and neutral ends. This paper also introduces the combination of both the dielectric response and PD measurement results, which can be very useful for assessing a complete insulation condition in the rotating machine. Moreover, the criteria for insulation conditions are suggested in this paper to evaluate the integral and local conditions for insulation of the rotating machine. Applying the techniques presented in this paper will be very useful in maintaining the machine in a good condition, and thus can mitigate the PD problem with many radiated electromagnetic waves that may interfere with the operation of the nearby electronic devices, especially the electronics and communication equipment. Therefore, maintaining the excellent condition of the machine by the proposed technique will support the highly effective operational efficiency of the communication system as well.
Acknowledgements
This work was supported by the King Mongkut’s Institute of Technology Ladkrabang Research Fund [grant number KREF 206301]. The authors also gratefully acknowledge the support of the staff at the Dielectric Analytika Laboratory, KMITL.
References
[1] Michael Muhr and Christof Sumereder, “Condition Assessment of Electric Machines,” CMD, 2006, pp. 90-90.
[2] T.S. Ramu, Reliability and Life Estimation of Power Equipment. New Age International Publisher, 2009, Chapter 3.
[3] T. Tran, O. Gallot-Lavallée, P. Rain, and G. Tripot, “The Use of Dielectric Spectroscopy for Detection of Insulation Defects in End Turns of Medium Voltage Motors,” IEEE Transactions on Energy Conversion, vol. 27, no. 4, pp. 905-911, Dec. 2012.
[4] E. Obame, P. Rain, O.Gallot-Lavallée, and G. Tripot, “Detection of Artificial Insulation Defects in a Medium-Voltage Motor by Dielectric Spectroscopy Analysis,” IEEE Transactions on Energy Conversion, vol. 27, no. 2, pp. 270-276, June 2012.
[5] Supatra A. Bhumiwat, “On-site non-destructive dielectric response diagnosis of rotating machines,” IEEE Trans. Dielectr. Electr. Insul., vol. 17, no. 5, pp. 1453–1460, Oct. 2010.
[6] Greg C. Stone Ian Culbert Edward A. Boulter Hussein Dhirani, Electrical Insulation for Rotating Machines: Design, Evaluation, Aging, Testing, and Repair. The Institute of Electrical and Electronics Engineers, Inc. 2014, hapter 4.
[7] E. Kuffel, W.S. Zaengl, and J. Kuffel, High Voltage Engineering: Fundamentals. Butterworth-Heinemann, Second edition 2000, Chapter 7.
[8] Andrzej Ka Jonscher, Dielectric relaxation in solids. Chelsea Dielectrics Press, 1983, Chapter 2 and 7.
[9] Kwan Chi Kao, Dielectric phenomena in solids: with emphasis on physical concepts of electronic processes. Elsevier Academic Press, 2004, Chapter 2.
[10] Andreas Küchler, High Voltage Engineering: Fundamentals–Technology–Applications. Springer Berlin Heidelberg, 2017, Chapter 4.
[11] Walter S. Zaengl, “Application of Dielectric Spectroscopy in Time and Frequency Domain for HV power Equipment,” IEEE Electrical Insulation Magazine, vol. 19, no.6, pp. 9-22, Nov/Dec 2003.
[12] 43-2000 - IEEE Recommended Practice for Testing Insulation Resistance of Rotating Machinery
[13] J. Alff, V. Der Hauhanessian, W. S. Zaengl and A. J. Kachler, “A novel, compact instrument for the measurement and evaluation of relaxation currents conceived for on-site diagnosis of electrical power apparatus,” in IEEE international symposium on electrical insulation, Anaheim, CA, USA, 2-5 April 2003.
Biographies
P. Nimsanong received his B. Eng. and M. Eng. degrees in electrical engineering from the Faculty of Engineering, KMITL, Thailand in 2006 and 2012, respectively. Now, he is currently a Ph.D. student in electrical engineering, Faculty of Engineering, KMITL, Thailand. His major research interests are in high voltage equipment testing and diagnostics.

N. Pattanadech received his B.Eng and M.Eng degrees in electrical engineering from the King Mongkut’s Institute of Technology Ladkrabang in 1998 and Chulalongkom University, Thailand in 2002, respectively. He is also awarded his Ph.D. degree by the Institute of High Voltage Engineering and System Management, Graz University of Technology, Austria in 2013. Currently, he works as an associate professor at the King Mongkut’s Institute of Technology Ladkrabang, Bangkok, Thailand. His research activities have been mainly involved with partial discharge in insulating liquid, solid insulator characteristics, high-voltage testing and high voltage measurement techniques, high voltage equipment monitoring and diagnostics, lightning and grounding problems and electromagnetic compatibility in high-voltage field.
Journal of Mobile Multimedia, Vol. 16_1-2, 1–22.
doi: 10.13052/jmm1550-4646.16121
© 2020 River Publishers