Unimodal Touch Behaviour-Based User Authentication Using Deep Learning and Swarm Intelligence for Smartphones
Anjani Gupta1, Arunima Jaiswal1,* and Gaurav Indra2
1Department of Computer Science and Engineering, Indira Gandhi Delhi Technical University for Women, India
2Department of Information Technology, Indira Gandhi Delhi Technical University for Women, India
E-mail: anjani001phd22@igdtuw.ac.in; arunimajaiswal@igdtuw.ac.in; gauravindra@igdtuw.ac.in
*Corresponding Author
Received 06 May 2025; Accepted 03 May 2026
Abstract
Smartphones have become necessary in everyday life since they make communication, financial transactions, and data access easier. However, their broad use poses serious security risks, especially regarding ongoing user authentication. Traditional authentication techniques, including PINs, passwords, and patterns, only authenticate users at points of entry, leaving devices open to replay attacks, session hijacking, and spoofing. To overcome these constraints, the hybrid authentication approach proposed in this research uses multimodal touch behaviour for real-time identity verification. Using the Touchalytics dataset, this method combines motion sensor data from accelerometers, gyroscopes, and magnetometers with fine-grained touch attributes, including touch area, pressure, finger orientation, and typing dynamics. Convolutional Neural Networks (CNN) and Long Short-Term Memory (LSTM) networks are combined in the system’s deep learning (DL) architecture for sequential touch analysis, and optimization approaches are used to improve model performance. The model captures detailed touch behaviour and motion sensor data, with hyperparameter tuning applied using Particle Swarm Optimization (PSO), Cuckoo Search Optimization (CSO), and Sea-Horse Optimization (SHO). The CNN-LSTM + PSO model outperforms standalone DL models by achieving 99.86% accuracy with a False Acceptance Rate (FAR) of 0.0009, False Rejection Rate (FRR) of 0.0012, and Equal Error Rate (EER) of 0.001, according to extensive assessment on the Touchalytics dataset. For next-generation mobile security, this combination of Swarm Intelligence (SI) and DL provides a strong, flexible, and effective authentication architecture.
Keywords: Continuous authentication, touch biometrics, mobile security, deep learning, swarm intelligence.
1 Introduction
Smartphones and mobile technology have profoundly changed the way people interact with the world. According to the Statista report [1], over 7 billion people use mobile phones worldwide. Out of these, 4.8 billion use smartphones, and more than 75% use them to access banking applications [2, 3]. Smartphones have gradually replaced wallets and keys in the digital age, changing how people use technology and go about their daily lives. However, with the convenience and functionality offered by smartphones, security becomes a major challenge. Traditional biometric modalities used in modern smartphones, such as fingerprints, face scans, and iris scans [4], become obsolete as they are meant only for one-point authentication or single authentication, which verifies the user’s identity during login. By continuously verifying the identity of users based on their behaviour, the continuous authentication framework is a more secure and user-centric solution and thus offers a paradigm shift [5]. Using behavioural biometrics, this study previously examined the disadvantages of one-stop shopping and identified the advantages of continuous authentication. Touch authentication systems use patterns of touch behaviour in touch-enabled devices such as smartphones to identify users [6]. Among the methods used for behaviour-based authentication are pressure, area covered, touch gestures, fingerprint patterns, and others. Behavioural patterns are more resistant to tampering than more traditional methods such as passwords or PINs, because they are individual and pose a significant deterrent to tampering [7]. Transparency is a special feature of touch authentication, as it verifies user devices without their knowledge and is integrated seamlessly with their daily interaction with them [8]. Unlike traditional biometrics, which remain static or manual, the system can identify a person even if their touch pattern changes significantly, because their touch behaviour can be adapted to subtle changes over time. In addition, as it uses several sensors already built into mobile phones, including gyroscope, accelerometer and global positioning system (GPS), this authentication method is less costly than other biometric systems [9]. Recent advancements in mobile multimedia systems have explored data-driven intelligence and secure authentication frameworks for real-world applications [10, 11]. Vulnerabilities associated with traditional techniques such as replay attacks, session hijacking, and post-login breaches can be successfully mitigated by implementing continuous authentication of users.
Behavioural biometrics which include touch dynamics, writing patterns, and accelerometer and gyroscope data are used to identify deviations from the user’s normal behaviour that may indicate unauthorized access. In addition, continuous verification improves the user experience by reducing the frequency of re-authentication requests and ensuring smooth and uninterrupted device operation while maintaining robust security. The main aim of this research is to improve user experience by adding additional layers of security to smartphones to prevent unauthorized access to personal data and cyber-attacks. To achieve this, a new continuous authentication model is proposed, which will use deep learning (DL) algorithms for user authentication on a touch-sensitive level. This method has achieved an improved detection rate and a minimized error rate and offers an effective model for protecting user privacy in smartphones. The highlights and contributions of this are:
• A hybrid DL model combining convolutional neural networks (CNN) with long short-term memory (LSTM) to extract the features.
• Swarm intelligence (SI) techniques based on discriminative feature selection for improving user identification in smartphones.
• A robust continuous authentication model for mobile platforms by combining multimodal touch dynamics with DL.
• Multi-modal touch dynamics integrated with DL and optimization techniques to develop a robust continuous authentication system for mobile platforms.
• Performance evaluation metrics indicates that our model shows improvement in fraud detection rates and reduction in false positives, which enhances the model performance.
The structure of the paper is as follows. Section 2 introduces related work and discusses the current advancements in smartphone authentication. Section 3 represents the proposed methodology and contains detailed mathematical explanations. In section 4, we have given comparative analysis based on obtained results. Section 5 concludes the paper and outlines directions for future research.
2 Related Work
A literature survey found several related studies and investigated the current knowledge and advancements in the field of mobile security and continuous user authentication. Main focus is given on behavioural biometric authentication which is achieved through touch dynamics on mobile devices. Much research has been done on authentication. Various machine learning algorithms have been used for implementation; recent advancements have incorporated DL techniques. Bajaber et al. [12] used various DL models for touch dynamics authentication and proved that the CNN-GRU model performs the best. They emphasized the significance of conducting practical experiments to evaluate performance in different scenarios. Feng et al. [13] employed a CNN-LSTM approach, which achieved high training accuracy. However, they acknowledged the limited pertinency of their framework to various datasets. Gao et al. [14] demonstrated the efficiency of using touch gestures for continuous authentication, addressing privacy concerns related to touch gesture data collection and the importance of feature selection.
Li et al. [15] used the SVM approach for multimodal authentication using both hand and written data and achieved the same Equal Error Rate (EER) of 97.8%. Xu et al. [16] reported a genuine acceptance rate of 92.5% after integration of dynamic touch dynamics and handwriting patterns. The authors recognized the benefits of multimodal systems but also highlighted the problems of scalability in serving a large number of users. The study by Traore et al. [17] demonstrated an unsupervised learning approach to touch speed using software verification tools and called for further research on the integration of touch speed with other functions. Hassan et al. [18] showed that CNN-GRU models are better at verifying the accuracy of touch patterns and stressed the importance of interpretable models for interpreting these. Eesa et al. [19] examined the use of random forests for the analysis of pressure in the hands in continuous validation systems and identified ways of improving their resilience. DeRidder et al. [20] released a dataset featuring recordings of multi-finger touch interactions from 25 individuals engaged in mobile game activities.
Pelto et al. [21] investigated how touch dynamics could support continuous authentication using Neural Networks alongside Extreme Gradient Boosting and Support Vector Machines. Mobile gaming data, collected from 40 players, revealed that the Neural Networks gain higher accuracy rates, varying from 80% to 95%, than all other models tested. Pryor et al. [22] studied physiological and behavioural smartphone authentication and evaluate performance using different algorithms. Hybrid schemes that include DL features with machine learning classification can enhance the authentication performance. Zhang et al. [23] used XGBoost for touch dynamics and proposed several combinations with other algorithms to improve performance. Zheng et al. [24] proposed an attention-based CNN for touch biometrics and highlighted the need for research on explainable attention mechanisms.
These studies have demonstrated that touch-based behaviour biometrics improves smartphone authentication. Much research has been done on touch dynamics authentication methods, but little work has been done on multi-modality-based behavioural biometrics using meta-heuristic optimization algorithms. Optimizing these models for real-world applications is still a challenge. This paper attempts to fill the gap by using particle swarm optimization (PSO) for hyperparameter tuning and combining it with feature engineering techniques to improve the overall model performance. Table 1 gives an overview of the different sensors used for touch dynamics authentication, which improve continuous authentication systems by recording user interaction and pressure levels.
Table 1 Sensors used in smartphones for touch-dynamics [21]
| Sensor Name | Description |
| Accelerometer | Measures the acceleration of the device in three-dimensional space, capturing motion and orientation during touch interactions |
| Gyroscope | Detects the device’s rotational movements, helping to understand how the device is held and moved during touch gestures |
| Touchscreen Sensor | Captures touch input data including location (x-, y-coordinates), pressure, and finger orientation, which are crucial for analysing touch patterns and dynamics |
| Pressure Sensor | Measures the force or pressure applied during touch interactions, providing additional data on user behaviour and input style |
3 Proposed Methodology
This section introduces the proposed framework for continuous authentication and consists of five sequential steps as shown in Figure 1. The first step, Data Understanding and Preprocessing, includes normalization, resampling, and dimensionality reduction to prepare the data for analysis. The second step, DL Model Building, employs CNN layers to extract spatial features and LSTM layers to capture temporal patterns from the touch-based behavioural biometric data. The third step, Hyperparameter Optimization, utilizes swarm intelligence techniques, including PSO, Cuckoo Search Optimization (CSO), and Sea-Horse Optimization (SHO), to identify optimal hyperparameter settings and improve model performance. The fourth step, Train the DL Model, describes the features and organization of the Touchalytics dataset [25], which serves as the basis for training and evaluation. The fifth step, Model Evaluation, assesses the effectiveness of the proposed approach using performance metrics such as accuracy, precision, recall, and F1-score. Together, these five steps establish a robust and flexible framework for continuous authentication, significantly enhancing smartphone security.
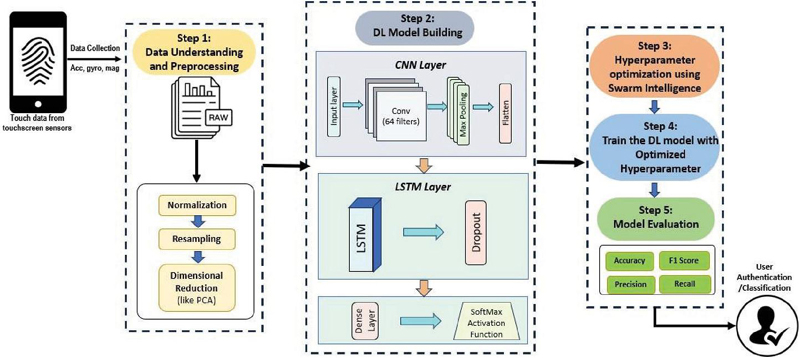
Figure 1 Architecture of the proposed methodology.
The architecture of the proposed model is shown in Figure 1. The first step is to transform the raw touch data which was originally in 3D form. We transform it into 4D tensor data which has four parts: number of samples, number of timesteps, number of features and number of touch actions. This transformation is required to make the data compatible with the 1D Convolution (Conv1D) layer, which competently performs convolutional operations. The Conv1D layer is used for learning spatial features from the raw input data and capturing important dependencies between them. The spatial features are fed into an LSTM network to learn the temporal features from the raw data, i.e., to identify long-term patterns in the data. A Max-Pooling layer is used after the convolutional layer to reduce the number of feature maps which, in turn, improves computational efficiency without sacrificing the relevant information. Hyperparameter optimization performs better for time series data. Hence, it has been applied with the CNN-LSTM model using Swarm optimization techniques [26]. This model is trained using Adam optimizer with learning rate of 0.001 and the loss function is categorical cross-entropy. To generalize the performance, k-fold cross-validation is used which takes the average from the above folds to ensure consistency. In k-fold cross validation, data is divided into k-folds for training and validation.
3.1 Dataset Description
The Touchalytics dataset [25] consists of raw touchscreen data in the form of swipe interactions from 41 Android smartphone users collected across multiple sessions. Participants involved in several tasks (article reading, image comparison) produced approximately 699,360 records. Each entry contains 11 attributes, including user and device identifiers, event timestamps, action types (touch down, touch up, move finger), device orientation (portrait/landscape, captured via accelerometer and gyroscope), and touch-specific features such as coordinates, applied pressure, contact area, and finger orientation. These interaction traces serve as distinctive behavioural signatures analogous to biometric identifiers. The Touchalytics dataset is a benchmark dataset for conducting experiments based on touch patterns. The dataset provides a high dimensional 3D view of user interaction by logging raw touch events and converting it into 4D information which includes spatial coordinates (x, y), timestamp of the action in milliseconds (ms), and touch type categorized as “Touch Down” (0), “Touch Up” (1), or “Move” (2). Other than these basic coordinates, it also captures physiological metrics like pressure, surface area covered by figure, and figure orientation with the help of various sensors. Detail on the size of the dataset, the number of users, and feature vectors is presented in Table 2.
Table 2 Touchalytics dataset description
| Property | Details |
| Total: 5 | |
| Phone IDs | Nexus 1, Experimenter E |
| Nexus S, Experimenter M | |
| Nexus 1, Experimenter R | |
| Samsung Galaxy S, Experimenter I | |
| Droid Incredible, Experimenter E | |
| Users | Total: 41 |
| Anonymous | |
| Total: 7 | |
| Documents | 1–3: Wikipedia articles |
| 4–5: Image comparison game | |
| 6: Wikipedia article (collected 7–14 days after sessions 1–5) | |
| 7: Image comparison game (collected 7–14 days after sessions 1–5) | |
| Phone Orientation | Sensor used: accelerometer, gyroscope. |
| Position: portrait, landscape orientation | |
| x-Coordinate | |
| y-Coordinate | |
| Touch Data | Pressure |
| Area Covered | |
| Finger Orientation | |
| Time [ms] | Captures the absolute time of the recorded action in milliseconds |
| Type | |
| Actions | 0: Touch Down |
| 1: Touch Up | |
| 2: Move |
The collected data allows in-depth analysis of touch interactions caused due to different factors like the device’s orientation and the force exerted during touch events. These interactions are recorded as users interact with a customized Android application, designed especially for browsing photos and reading articles.
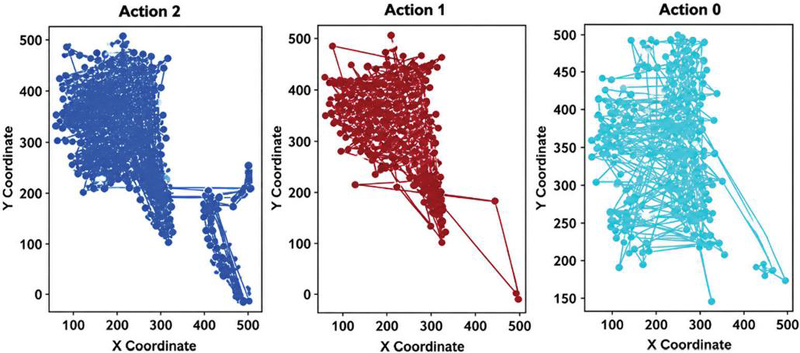
Figure 2 Spatial distributions for three distinct actions.
Figure 2 represents three scatter plots, which reflect the spatial distribution of three types of actions, based on touch data. Action 2 (left, dark blue) shows a dense and concentrated distribution of points along the diagonal line, implying the presence of a high correlation between X and Y axes. Action 1 (middle, brown) reflects a dispersed distribution of points with outliers connecting the centre cluster, which may be related to paths and trajectories. Action O (right, light blue) shows a dense distribution of points but no evident directional trend, reflecting a diverse spatial distribution.
Figure 3 highlights the paths of users’ movement in Actions 0, 1, and 2. User movement on X and Y axes is blue is for Action 0, green for Action 1, and red for Action 2. Actions 1 and 2 have higher localization within certain regions with thick clusters of red and green dots.
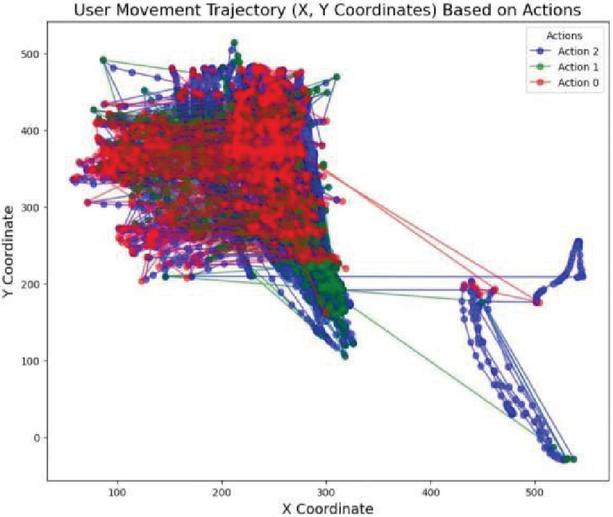
Figure 3 User movement trajectory in a coordinate system.
Since blue dots are more numerous than red or green dots, it implies that Action 0 happens less frequently but has wider area. Furthermore, the many lines going from the centre to the edge of the plot indicate the trajectories that each user follows when performing certain actions. The use of such an illustration is crucial for exploring the movement pattern of the user as well as the positioning of the implementation in the confined area. In the present study, version 1 of the Touchalytics database is utilized, which consists of the raw data on the touch, while version 2 consists of the 30 extracted properties.
3.2 Data Understanding and Preprocessing
The Touchalytics data set comprises numerous user sessions which includes time series data from sensors as well as touch screen interactions. To preprocess the dataset in preparation for machine learning algorithms, a detailed approach was adopted. Though LSTM is very efficient in handling time series data [27], this paper focuses on analysing the data using features derived from structured data. The inputs from the sensors such as the accelerometer and gyroscope data were combined with touch interactions to enable the recording of micro-movements of the phone during interactions.
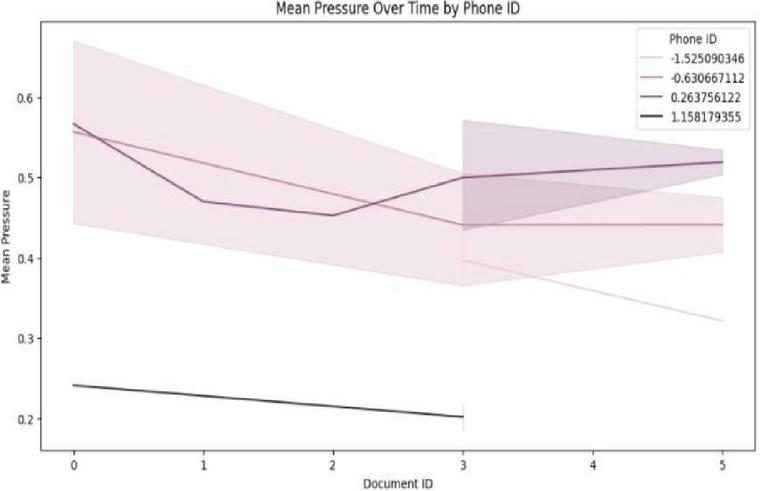
Figure 4 Mean pressure over time by phone ID.
3.2.1 Feature extraction
The Touchalytics data set used in our experiment includes a number of attributes such as “Phone ID”, “Document ID”, “Time [ms]”, “Action”, “Phone orientation”, “x-Coordinate”, “y-Coordinate”, “Pressure”, “Area”, and “Finger orientation”, where “User ID” is considered as the target attribute. Each touch interaction was treated as a vector (s x,y,z), which describes touch interaction properties. Time windows were defined based on recorded timestamp. It was important to apply such a strategy to extract features related to spatial and temporal aspects of touch interaction. Figure 4 demonstrates the mean pressure over time per each phone ID and shows the difference in mean pressure for various mobile phones and documents.
Here, y-axis shows the mean pressure values that range between 0 and 0.6, while x-axis refers to the document ID. Each differently coloured line represents a particular phone number, while the shaded area represents the standard deviation or confidence intervals. The above representation is an effective way of showing variation in mean pressure and offers important insights regarding the temporal dimensions of touch interaction.
3.2.2 Data normalization
Since the values of the attributes change considerably from one set of data to another, it is necessary to perform data normalisation for uniformity. This process of data standardisation assists us in reducing the bias introduced into the model as a result of differing scales, and in ensuring equal contribution from all the attributes in training and classification. We applied a technique for standard scaling where each attribute is adjusted such that its mean equals 0 and standard deviation is 1, which helps to make a comparison of data points easier. This can be mathematically written as:
| (1) |
were signifies the mean, and shows the standard deviation of the feature x. This step is important to avoid features with larger values from excessively affecting the learning of the model and enhancing the convergence rate during training.
3.2.3 Dimensionality reduction
In this study, principal component analysis (PCA) has been used to aid in feature selection and to emphasize the features that are important. This method retains the necessary variance in the dataset and eliminates unnecessary or irrelevant features; hence, it has become ideal for working with high-dimensional data. It reduces the complexity of the input data without losing any important information through the reduction of the number of features to a smaller number of uncorrelated features. In sequential models such as LSTM, where effective learning requires optimized data processing, the use of PCA works best. The application of PCA aims at the reduction in the dimensionality of the extracted feature set with retention of maximum variance. The original high-dimensional feature space is transformed into a lower-dimensional space by projecting the data onto principal components. Figure 5 shows a representation of the PCA algorithm.
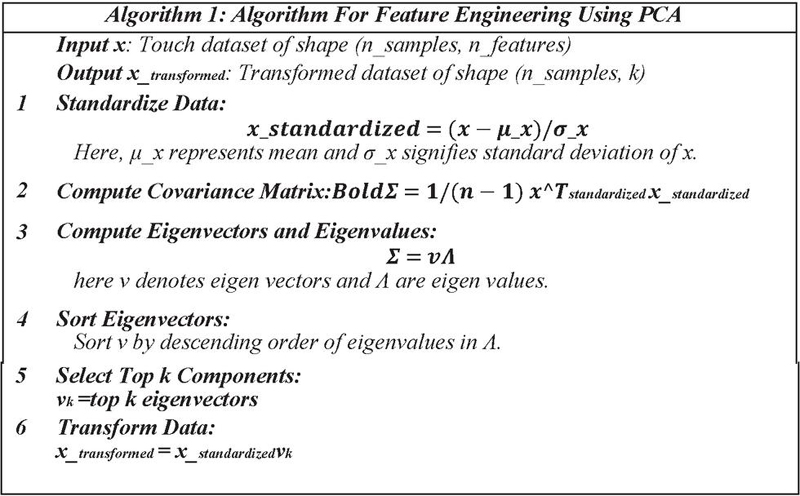
Figure 5 PCA algorithm for dimensionality reduction.
3.2.4 Feature reshaping for model compatibility
After the preprocessing of the dataset/feature set through normalization and PCA, the preprocessed dataset/feature set, x_transformed, is restructured to fit the requirements of an LSTM network. The data is organized in such a way that it can be represented in the form (samples, timesteps, features). This is done to enable the LSTM model to learn the temporal dependencies present in touch-based data. Also, the target variable, y, is transformed into categorical format using one-hot encoding.
3.3 DL Model Building
CNN-LSTM architectures have been proposed to implement continuous user authentication, where both spatial and temporal feature extractions take place on the dataset. Local spatial features such as touch coordinates, touch pressure, and finger direction have been obtained using Conv1D filters. Using Max-Pooling, dimensionality reduction takes place while retaining important information. Following the extraction process, the next step involves using LSTM layers that focus on long-term dependency in order to recognize behaviour patterns through time. To address the problem of overfitting and improve the performance of the system, a Dropout layer is included. Adaptive continuous authentication is provided by CNN-LSTM combination approach, and a mechanism to prevent fraudulent access to mobile devices has been provided.
3.3.1 Convolution neural networks
The next step in facilitating the Conv1D compatibility is the reshaping of the data to a 4D tensor in form (num_samples, num_timesteps, num_features, num_actions1) with additional channel dimension needed for the convolution operation. In CNN, the 1D time-distributed convolutional layer with 64 filters and kernel size 3 is used in order to detect local spatial features in terms of orientation of fingers, touch pressure, and change in coordinates in each step of user’s interaction with the touchscreen device. The output of the CNN is further downsampled by using a Max-Pooling layer that selects the maximal values from the sliding window [29].
3.3.2 Long short-term memory
The extracted spatial features are presented to an LSTM layer configured with 100 units to learn long-term dependencies within the sequential data. Through the process of processing the feature vectors, the LSTM layer captures the temporal information associated with touch behaviour patterns, including the order and sequence of contacts by the user. Continuous authentication involves validating a user according to their consistent interaction with the gadget, hence the need for learning the time-related behaviour patterns of the users. In addition, a dropout layer was included after the LSTM layer to enhance the robustness of the model and reduce overfitting issues. The function of the dropout layer is to deactivate some LSTM units in each training session randomly. Figure 6 displays the working model of the CNN-LSTM network.
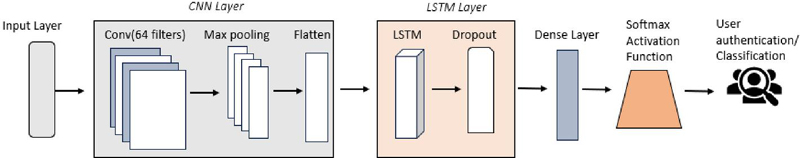
Figure 6 CNN-LSTM model for user authentication.
3.4 Hyperparameter Optimization
Several strategies were used for hyperparameter adjustment to attain the best possible performance in the CNN-LSTM model. The aim of this improvement was to enhance important architectural parameters, such as the number of convolutional filters, kernel size, LSTM units, learning rate, batch size, and dropout rate. Because these parameters have a substantial influence on the accuracy, rate of convergence, and capacity for generalization of the model, choosing the correct values is essential. SHO, CSO, and PSO were among the methods used to adjust the hyperparameters. PSO proved to be the most successful approach, outperforming CSO and SHO in terms of the optimization performance. Therefore, PSO was selected as the main method for hyperparameter optimization in this research.
3.4.1 Particle swarm optimization
PSO will be integrated to optimize the hyperparameters of the CNN-LSTM model in order to enhance its efficiency. By drawing inspiration from the group intelligence exhibited by biological organisms like schools of fish and flocks of birds, PSO can successfully navigate the solution search space to find the best possible solutions [30]. Unlike traditional methods such as the grid search and random search techniques, which are usually very costly in terms of computing, PSO is a dynamic technique that optimizes the hyperparameters of the model by combining both exploitation and exploration. Initially, PSO involves the random initialization of a swarm of particles [31]. This means that a particle represents a specific state of the model’s hyperparameters. Here, the CNN-LSTM model, which consists of Conv1D layers, pooling layers, LSTM layers, and dropout layers, represents a hybrid DL algorithm aimed at extracting spatial temporal features. During optimization, the location of the particles is adjusted using two major components:
• Personal Best (pBest) best hyperparameter configuration a particle has seen up until this point.
• Global Best (gBest) optimum hyperparameter setting found by any particle in the swarm as a whole.
Following several iterations, the particles converge to a solution that is close to optimal through experience gained both individually and collectively. This leads to the discovery of appropriate hyperparameters, improving the accuracy and efficiency of the model in performing the validation tasks. By optimizing hyperparameters such as learning rate, batch size, activation function, and architecture of the neural network, PSO optimizes the ability of the model to detect complicated patterns in multimodal touch signals. This makes the detection more accurate, secure, and performs efficiently in verifying transactions by the vigilant. Figure 7(a) demonstrates how the PSO begins with initialization of swarm and then fitness evaluations of individual particles are made.
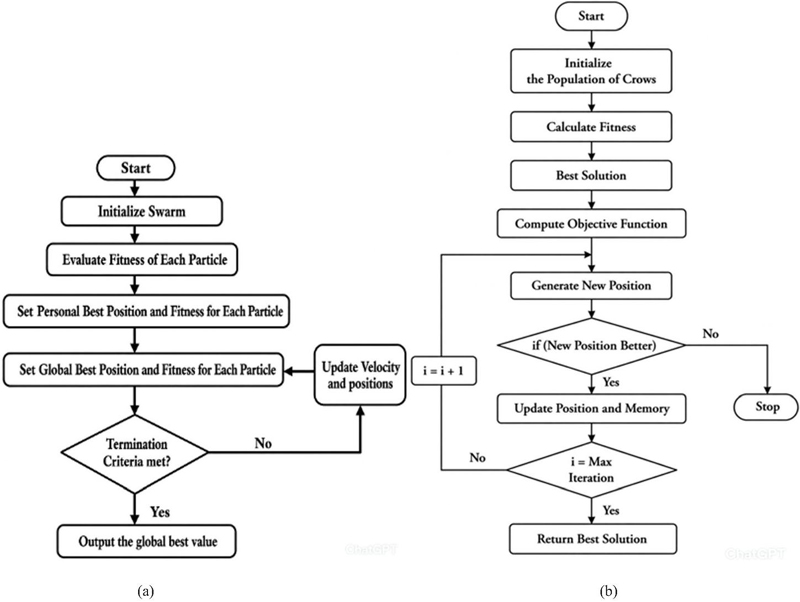

Figure 7 (a) PSO flowchart, (b) CSO flowchart, (c) SHO flowchart.
3.4.2 Cuckoo search optimization
The hyperparameters of the CNN-LSTM model have been carefully optimized by CSO, which considered parameters like size of the convolutional filter, kernel size, LSTM units, and decay rate. Due to its global search ability and fast convergence, CSO has been employed to optimize these hyperparameters prior to training to enhance the performance of the LSTM [32]. The pre-processing step included normalizing the features and encoding the target variables to maintain uniformity throughout the dataset. The processed data were split into training and test sets and converted into time-lapse sequences that can be used for sequential learning [33]. The CSO algorithm as shown in Figure 7(b) searches varying hyperparameter settings within specified boundaries to enhance the model’s performance by optimizing accuracy as its objective function. The last CNN-LSTM model was designed with Conv1D, MaxPooling1D, LSTM, Dense, and Dropout layers with the best parameters set by the CSO. The model was tested for accuracy, precision, recall, and F1 score, which validated its performance in the classification tasks [28]. While CSO has shown excellent optimization performance, PSO has shown a better convergence rate and hyperparameter fine-tuning efficiency and is hence the choice of optimization for CNN-LSTM.
3.4.3 Sea-horse optimization
The research also explains SHO, a bio-inspired meta-heuristic optimisation algorithm that replicates the movement of sea horses to optimise hyperparameters in the CNN-LTM. The SHO algorithm represented in Figure 7(c), iteratively tweaks essential parameters of the model such as the number of convolutional filters , the kernel size (k), the LSTM units (l), and the decay rate (d) for better performance. The aim function was to reduce classification errors and enhance the accuracy of the model. The data set, which includes features such as phone ID, document ID, time stamps, type of action, phone orientation, x- and y-coordinates, pressure of the touch, area covered, and finger orientation, has been standardized and redesigned to ensure its compatibility with the CNN-LSTM architecture. During optimization, the marine animals dynamically updated their position using adaptive search strategies, balancing exploration and exploitation. Equation (2) was used to update the location of the sentient sea horses during the optimization process [34].
| (2) |
Here, the coefficients for exploration and use are shown by the values of and , while the best value of best(t) indicates the best position at iteration t. The SHO algorithm efficiently optimizes the hyperparameters, resulting in model accuracy of 98.78% and error of 0.0022. It also demonstrated a significant improvement in the security metrics, achieving a False Acceptance Rate (FAR) of 0.0014, a False Rejection Rate (FRR) of 0.0016 and an EER of 0.0015. Although PSO ultimately won, this study highlights the potential of bio-inspired optimization techniques to enhance neural network architectures for continuous authentication.
4 Experiment and Results
This section presents the evaluation of the proposed approach and elaborates on the resulting findings. It begins with dataset visualization and feature selection results, followed by model training and hyperparameter optimization, an overview of the performance metrics, a comparison of baseline models, and an analysis of the results obtained.
4.1 Data Visualization and Feature Selection
The Touchalytics dataset comprises features such as phone ID, document ID, time (ms), action, phone orientation, x-coordinate, y-coordinate, pressure, area covered, and finger orientation. The target variable is “user ID.” The dataset was pre-processed by standardizing the features and applying categorical encoding to the target variable.
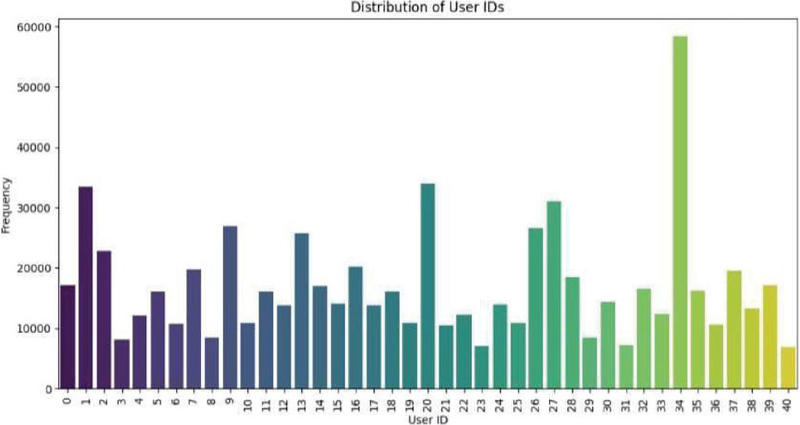
Figure 8 Distribution of user ID’s in Touchalytics dataset.
Figure 8 illustrates the distribution of user IDs within the dataset. Every bar in the bar graph shows the frequency with which the particular User ID occurs, where the x-axis has been marked as “User ID” and its value ranges from 0 to 40 and the y-axis has been marked as “Frequency” with values ranging from 0 to 60000. Out of all the User IDs, User ID number 30 stands out since it occurs at about 60,000 times which makes it an outlier among other user IDs. The imbalances among the data set are clearly evident from this graph and must be accounted for while developing any model.

Figure 9 Transformation from unstructured data to distinct clusters using principal component analysis.
Figure 9 explains the data flow of the “Principal Component Analysis” PCA approach. The first plot labelled “Data Visualization before PCA,” has no identifiable structure or cluster which suggests these data points have not yet been processed. The second scatter plot, “3D Scatter Plot” has data points representing information before implementation of PCA. The points are color-coded based on the range of pressure values from 0 to 40 as given on the legend. The plot exhibits a dense clustering of points forming a mound with the value of pressure on the y-axis, increasing towards the top. This representation enables a broad understanding of the relationships and dependencies between different spatial measurements and pressure. The third plot, “3D PCA Scatter Plot,” is a three-dimensional scatter plot where data points are further separated into clusters based on temperature ranges. The visualization above underscores the significance of PCA in data preprocessing and feature extraction, which enhances the accuracy and richness of the analysis.
4.2 Model Training and Hyperparameter Optimization
To test the efficacy of the proposed continuous authentication model, an experiment was carried out using different DL models and optimization techniques. The baseline models including LSTM, CNN, CNN-GRU, and CNN-LSTM were selected owing to their efficiency in capturing both sequential and spatial temporal features. Three different meta-optimization algorithms, namely, CSO, PSO, and SHO, were used to improve the baseline models. This was done through optimizing the important parameters such as number of convolution filters, filter size, LSTM units, dropout, and learning rate, which are critical in improving the efficiency of the proposed model. The effects of hyperparameter tuning were measured in terms of the performance metrics including accuracy, error rate, FAR, FRR, and EER. The results as shown in Table 3 and illustrate the benefits associated with hyperparameter tuning.
Table 3 Comparison with baseline models
| Model | Accuracy | Error Rate | FAR | FRR | EER |
| LSTM | 0.9631 | 0.0369 | 0.021 | 0.034 | 0.027 |
| CNN | 0.9642 | 0.0358 | 0.02 | 0.033 | 0.026 |
| CNN-GRU | 0.9605 | 0.0395 | 0.025 | 0.031 | 0.028 |
| CNN-LSTM | 0.957 | 0.0378 | 0.03 | 0.038 | 0.034 |
| CNN-LSTM with CSO | 0.9865 | 0.0035 | 0.0021 | 0.003 | 0.0025 |
| CNN-LSTM with PSO | 0.9986 | 0.0014 | 0.0009 | 0.0012 | 0.001 |
| CNN-LSTM with SHO | 0.9878 | 0.0022 | 0.0014 | 0.0016 | 0.0015 |
The CNN-LTM model optimized by the PSO method gave the highest accuracy of 99.86% with the lowest values of FAR (0.0014), FRR (0.0012), and ERF (0.001). Moreover, the CNN-LSTM model optimized by CSO and SHO exhibited substantial improvements in accuracy relative to the baseline methods, where accuracy values were 98.65% and 98.78%, respectively. The study shows the great influence of hyperparameters on improving authentication accuracy while reducing false positive and rejection errors.
4.3 Performance Analysis
A performance evaluation was conducted to assess the efficiency of the proposed CNN-LSTM model and its PSO, CSO, and SHO optimized models. This part of the evaluation will consider quantitative measures along with graphs that depict the influence of hyperparameter tuning on the performance of the proposed model for the purpose of authentication and learning. The accuracy and loss trends for the CNN-LSTM model were analysed for 20 training epochs, and both the training and validation performances were evaluated. As can be seen from Figure 10, there is an increase in the trend of accuracy along with a decrease in the loss, which demonstrates continuous improvement in memory. The model achieves training accuracy of 99.5% after training and maintains validation accuracy of 98.5%, indicating excellent generalizability of the model. Training and validation losses approach minimum values, implying that overfitting can be successfully avoided by optimizing the model.

Figure 10 Training and validation accuracy and loss graphs.
From the graphs of accuracy and loss, it is evident that the model which was designed through optimization by PSO has achieved convergence more effectively than the other two models optimized using CSO and SHO. The efficiency of the PSO optimizer in optimizing models is therefore shown. The confusion matrix in Figure 11(a) offers an accurate representation of classification performance in terms of accuracy, true positives, and false positives.
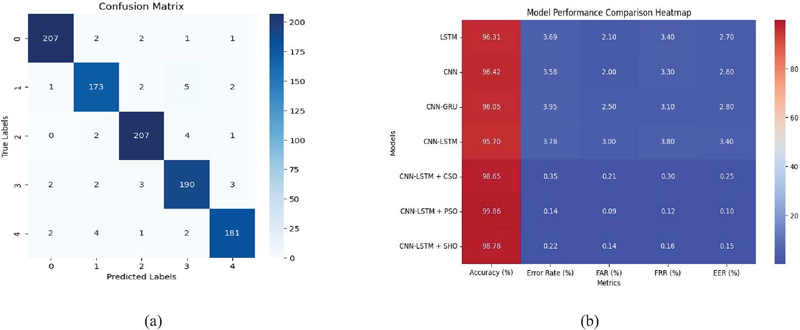
Figure 11 Model performance comparison with DL models: (a) confusion matrix and (b) heatmap visualization.
Figure 11(b) shows heatmap visualization, where red is indicative of high values while blue denotes low values and hence facilitates easy comparisons of the performance of models in terms of various metrics. It can be seen from the heatmap visualization and tabulation that hyperparameter optimization plays an important role in improving the efficiency of models. The proposed CNN-LSTM model using PSO algorithm was found to be the best model with respect to accuracy (99.86%) and low error rate (0.0014). Also, it converged quickly in comparison to other models. Consequently, PSO played a vital role in hyperparameter optimization, resulting in high accuracy and precision. Thus, integration of PSO helped in improving the efficiency and robustness of the proposed framework for continuous authentication by leveraging touch dynamics. Therefore, it can be concluded that the PSO technique is very useful in DL and contributed to improvements in accuracy, error rate, FAR, FRR, and EER.
5 Conclusion and Future Work
This research proposes a new approach for continuous user authentication through the development of a hybrid DL algorithm based on CNN and LSTM, which has been fine-tuned using PSO to increase the security of smartphones. By applying multiple dynamic modalities of touch dynamics and employing PCA for feature extraction, this hybrid DL algorithm is capable of recognizing the space-time dynamics of the touch screen users. Hyperparameters of the model have been fine-tuned using PSO, resulting in better performance compared to other DL models for user authentication.
There are several reservations about the feasibility of the model. There could be an impact of the complexity of the model on power consumption and latency in the process of user authentication. This aspect requires further investigation. Although the model has achieved promising results in the existing database, it should also be validated using a variety of databases containing a broader set of users and devices. In spite of that, the model overcomes some of the limitations of physiological biometric-based user authentication.
For future research, other forms of metaheuristic optimization methods and data set creation will be considered in order to enhance the generalizability and applicability of the findings. The use of various types of biometric verification, such as gait analysis and voice recognition, will ensure high security levels. In addition, the introduction of adaptive learning techniques will allow the model to be capable of self-learning and adaptation to dynamic changes in patterns of users’ actions. The second phase of the research will include the implementation of the Dual Layered Adaptive Biometric Authentication Network, where the use of SI optimization along with speech and touch behavioural patterns will take place.
References
[1] Statista, “Number of Smartphone Users Worldwide According to 2025 Report.” [Online] Available: https://www.statista.com/outlook/cmo/consumer-electronics/telephony/smartphones/worldwide.
[2] GSMA, “The Mobile Industry Impact Report: Sustainable Development Goals Executive Summary 2024.” [Online] Available: https://www.gsma.com/solutions-and-impact/connectivity-for-good/mobile-economy/wp-content/uploads/2024/02/260224-The-Mobile-Economy-2024.pdf.
[3] Juniper, “Digital Banking Users to Reach 2 Billion This Year, Representing Nearly 40% of the Global Adult Population.” [Online] Available: https://www.juniperresearch.com/press/digital-banking-users-reach-nearly-3-billion-2021.
[4] A Bajaber, MA Fadel and LA Elrefaei (2022) “Evaluation of Deep Learning Models for Person Authentication Based on Touch Gesture.” Comput. Syst. Sci. Eng., 42(2), 465–481.
[5] Hassan et al. (2022) “Continuous User Authentication Using Touch Biometrics And Machine Learning: A Survey.” Journal of Network and Computer Applications, 203, 103314.
[6] Alyahya et al. (2020) “Continuous Authentication Using Ensemble Learning For Mobile Touch Biometrics.” Sensors, 20(8), 2298.
[7] Jiang et al. (2022) “Touch Dynamics-Based Continuous Authentication With User-Adaptive Threshold.” Sensors, 22(3), 820.
[8] KK Verma, BM Singh and A Dixit (2022) “A Review Of Supervised And Unsupervised Machine Learning Techniques For Suspicious Behaviour Recognition In Intelligent Surveillance Systems.” Int. J. Inf. Tecnol., 14, 397–410.
[9] Y Gao, Y Jia and Y Zhao (2019) “A Privacy-Preserving Continuous Authentication System Using Touch Biometrics.” IEEE Transactions on Information Forensics and Security, 14(12), 3324-3337.
[10] HT Nguyen, TT Nguyen and HT Nguyen (2022) “Mobile Crowd-Sourced Data Fusion And Urban Traffic Estimation.” Journal of Mobile Multimedia, 18(3–4), 455–472.
[11] M Gayathri and C Malathy (2022) “A Deep Learning Framework For Intrusion Detection And Multimodal Biometric Image Authentication.” Journal of Mobile Multimedia, 18(2), 393–420.
[12] S Bajaber, I Khalil and M Khreich (2021) “A Comparative Study Of Deep Learning Architectures For Continuous Authentication Using Touch Dynamics.” Security and Communication Networks, 2021, 1–12.
[13] H Feng, J Zhao, J Yan, Y Zhou and X Li (2018) “Continuous Mobile Authentication Using Touchscreen Biometrics: A Deep Learning Approach.” ACM Transactions on Information Systems (TOIS), 36(3), 1–20.
[14] Y Gao, J Zhao, X Li and X Yuan (2016) “Continuous Authentication Using Touchscreen Gestures On Mobile Devices.” IEEE Transactions on Mobile Computing, 15(12), 3052–3065.
[15] S Li, X Lin, Y Sun and X Deng (2018) “Continuous Authentication For Mobile Devices Using Multi-Modal Touch Dynamics.” Computers & Security, 77, 828–842.
[16] Y Xu, X Chen, J Zhao, X Li and D Kong (2015) “Unsupervised Continuous Authentication Using Touch Biometrics.” IEEE Transactions on Information Forensics and Security, 10(9), 1871–1883.
[17] B Traore, SU Hassan, AH Abdullah and F Saeed (2018) “Continuous Authentication Using Touch Velocity On Mobile Devices.” 2018 International Conference on Computing and Artificial Intelligence (ICCAI), 1–6.
[18] SU Hassan, B Traore, AH Abdullah and F Saeed (2020) “A Convolutional Neural Network-Based Approach For Continuous Authentication Of Mobile Users Using Touch Patterns.” 2020 IEEE 17th International Conference on Smart Communities (SC), 1–7.
[19] AS Eesa, B Traore and AH Abdullah (2019) “Continuous Authentication Of Mobile Users Using Touch Pressure.” Journal of Physics: Conference Series, 1144(1), 012022.
[20] Z DeRidder, N Siddiqui, T Reither, R Dave, B Pelto, N Seliya and M Vanamala (2022) “Continuous User Authentication Using Machine Learning and Multi-Finger Mobile Touch Dynamics with a Novel Dataset.” 2022 9th International Conference on Soft Computing & Machine Intelligence (ISCMI), Toronto, ON, Canada, 42–46.
[21] B Pelto, M Vanamala and R Dave (2023) “Your Identity is Your Behaviour—Continuous User Authentication Based on Machine Learning and Touch Dynamics.” 2023 3rd International Conference on Electrical, Computer, Communications and Mechatronics Engineering (ICECCME), Tenerife, Canary Islands, Spain, 1–6.
[22] L Pryor, R Dave and N Seliya (2022) “Deep Learning and Machine Learning, Better Together Than Apart: A Comprehensive Review on Mobile Authentication.” Journal of Cybersecurity and Privacy, 3(2), 331–354.
[23] X Zhang, S Li and K Zhao (2020) “A Bezier Curve-Based Feature Extraction Method For Touch Biometrics.” Sensors, 20(17), 4823. https://www.mdpi.com/1424-8220/20/17/4823.
[24] Zheng et al. (2019) “An Attention-Based Deep Learning Approach For Continuous Authentication Using Touch Biometrics.” IEEE Transactions on Information Forensics and Security, 14(1), 184–195. http://ieeexplore.ieee.org/document/9121981.
[25] M Frank (n.d.) “Touchalytics: Touch-Based Authentication On Mobile Devices.” [Online] Available: https://www.mariofrank.net/touchalytics/.
[26] Y Kim, S Eum and J Choo (2020) “Continuous Authentication On Touchscreens Using Time-Dependent Features.” Sensors, 20(17), 4888.
[27] W Li, R Wang and B Xu (2019) “Enhancing Security And Privacy In Touch Biometric Authentication.” Sensors, 19(17), 3847.
[28] O Akintunde, A Adetunji, O Fenwa, J Oguntoye, D Olayiwola and A Adeleke (2025) “Comparative Analysis Of Score Level Fusion Techniques In Multi-Biometric System.” LAUTECH Journal of Engineering and Technology, 19(1), 128–141.
[29] A Gupta, P Singh, D Jain, AK Pandey, A Jain and G Sharma (2022, January) “Real-Time Exhaustion Detection by Image Classification Using Deep Convolution Neural Network.” International Conference on Electrical and Electronics Engineering (pp. 482–491), Springer Singapore.
[30] J Hu (2025) “Online Criminal Behaviour Recognition Based on CNNH and MCNN-LSTM.” Informatica, 49(12).
[31] A Mullai and K Mani (2021) “Enhancing The Security In RSA And Elliptic Curve Cryptography Based On Addition Chain Using Simplified Swarm Optimization And Particle Swarm Optimization For Mobile Devices.” Int. J. Inf. Tecnol., 13, 551–564. https://doi.org/10.1007/s41870-019-00413-8.
[32] D Wang, D Tan and L Liu (2018) “Particle Swarm Optimization Algorithm: An Overview.” Soft Computing, 22, 387–408.
[33] AS Joshi, O Kulkarni, GM Kakandikar and VM Nandedkar (2017) “Cuckoo Search Optimization Review.” Materials for Today: Proceedings, 4(8), 7262–7269.
[34] EH Houssein, MR Saad, E Çelik, G Hu, AA Ali and H Shaban (2024) “An Enhanced Sea-Horse Optimizer For Solving Global Problems And Cluster Head Selection In Wireless Sensor Networks.” Cluster Computing, 27(6), 7775–7802.
Biographies

Anjani Gupta is currently pursuing her Ph.D. in Computer Science and Engineering from Indira Gandhi Delhi Technical University for Women (IGDTUW), New Delhi, India. She completed her M.Tech. and B.Tech. degrees from Himachal Pradesh University (HPU), Shimla. Her research interests include artificial intelligence, deep learning, machine learning, blockchain, Internet of Things (IoT), and data-driven intelligent systems, with a particular focus on cybersecurity, behavioural biometrics, and smart applications. She has authored and co-authored several research papers published in reputed national and international journals and conferences, including SCI and Scopus-indexed publications. Her recent research contributions involve optimization algorithms, generative AI models, and advanced deep learning techniques for secure and intelligent computing systems.

Arunima Jaiswal has a Ph.D. in Computer Science & Engineering from Delhi Technological University (DTU), Delhi, India. She has received her M.Tech. (Master of Technology) degree from Delhi Technological University (DTU) and B.Tech. (Bachelor of Technology) from University School of Information Technology, (USIT) Guru Gobind Singh Indraprastha University (GGSIPU), Delhi. Currently, she is working as an Assistant Professor in Department of Computer Science & Engineering at the Indira Gandhi Delhi Technical University for Women (IGDTUW). She has many publications to her credit in various journals with high impact factor and international conferences. Her research interests are sentiment analysis, social media analytics, soft computing, machine learning, deep learning, social & semantic web.

Gaurav Indra received his B.Tech. (Computer Science & Engineering) degree from Guru Gobind Singh Indraprastha University, Delhi, India, in 2009, the M.Tech. (Software Engineering) degree from Delhi Technological University, in 2011, and earned his Ph.D. from University of Delhi in February 2022. Since 2018, he is working as an Assistant Professor in the Department of Information Technology at Indira Gandhi Delhi Technical University For Women. His specializations include network security, post quantum cryptography, mutual authentication in cognitive radio based IoT, secure communication in cognitive radio networks, and stochastic game theory. He is a member of the IEEE, ACM, IACR, and AAAI.
Journal of Mobile Multimedia, Vol. 22_2, 249–274.
doi: 10.13052/jmm1550-4646.2224
© 2026 River Publishers