An Integrated TOE–Institutional–Sustainability Conceptual Model for Digital Supply Chain Finance Adoption in Emerging Economies
Visakorn Kirivan, CFA and Adisorn Leelasantitham*
Technology of Information System Management Division, Faculty of Engineering, Mahidol University, NakhonPathom, Thailand
E-mail: Grefizoni@gmail.com; adisorn.lee@mahidol.ac.th
*Corresponding Author
Received 30 May 2025; Accepted 18 August 2025
Abstract
The digitization and complexity of supply chains in the Industry 4.0 era call for companies to take sustainable, flexible, open finance management under serious thought. This study intends to build and test a conceptual model of the adoption of a digital supply chain finance platform (DSCF) by using the technology–organization–environment (TOE) framework, together with sustainability ideas and institutional pressure theory. A questionnaire was used to collect data from 323 organizations with trade finance policymakers in Thailand. The data were analyzed using PLS-SEM structural equation modelling and hierarchical multiple regression. The results of the analysis revealed that technology readiness, platform credibility, innovation leader commitment, and organizational sustainability capability had a significant positive effect on DSCF adoption intention. In addition, external pressures, including regulations, imitation, and social norms, also played an important role in organizational adoption behavior. The regression model results also indicated that internal organizational capabilities could mitigate the impact of external pressures in some cases. This research contributes to the proposal of a TOE model that systematically integrates sustainability dimensions and contextual mechanisms. It also provides theoretical and policy guidelines for organizations that want to drive financial innovation in line with ESG goals and long-term competitiveness.
Keywords: Technology-organization-environment, institutional theory, sustainability, digital supply chain finance adoption.
1 Introduction
Particularly the rise of Financial Technology (FinTech), which includes new services such as mobile payments, peer-to-peer lending, blockchain technology, and digital currencies, which enable transaction flexibility and lower the operational costs of traditional financial systems [1, 2]. The global financial system has evolved noticeably throughout the last decade. Particularly in the banking industry, which aims to increase efficiency in risk management, decision-making, and sustainable operations [1], FinTech has grown to be a major mechanism driving the competitiveness and sustainability of financial companies. Digital Supply Chain Finance (DSCF) [3] is one instance of financial innovation that has started to be used in the corporate sector to help create operational efficiency and transparency, lower the cost of accessing funds and promote sustainability by means of technology and innovation, so enabling businesses to manage the flow of funds within the supply chain more flexibly by combining the use of technology and innovation to reduce funding and properly control credit risks among trading partners, which improves organization closer to Industry 4.0 (I4.0) [4]. Surprisingly, the survey by the Digital Economy Agency in 2020 (DEPA) of Thailand, found that the use of technology adoption under the concept of I4.0 accounted for only 0.4 percent [5] reflecting that there are some obstacles for innovation and technology adoption in Thailand.
Although financial innovation clearly benefits many other sectors, attempts to use such innovation in businesses still face several main challenges. The 1st challenge is lack of trust in digital platforms and preparedness of technological infrastructure and complexity of altering legacy systems have slowed down the adoption of innovation at the organizational level [2]. The 2nd challenge is obstacles to access technology due to resource and SMEs constraints [6]. In addition, although the application of financial innovations has created clear benefits, but in practice, organizations still struggle transition to sustainable financial innovations in the digital economy era [1, 7]. The last but not least challenge is the lack of comprehensive theory focus on sustainable technology adoption for organizations perspective rather than focus on technology feature solely.
This research focuses on studying the factors affecting technology adoption to enhance potential and sustainable competitiveness through the perspective of organizations in developing countries under external pressure combined with organizational potential and leaders’ drive for sustainability, in order to answer the following research questions:
RQ1: What technological, organizational, and environmental factors from a sustainable operations perspective affect organizations’ adoption of DSCF?
RQ2: What should organizations prioritize in promoting sustainable DSCF adoption?
The expected results of this research may help create knowledge and conceptual models to answer the question of how organizations in developing countries will accept sustainable technologies through the application of the Technology-Organization-Environment (TOE) model combined with the role of organizational leaders towards sustainability. The conceptual model presented by the researchers in this study may help expand the findings beyond the past literature, as shown in Figure 1.
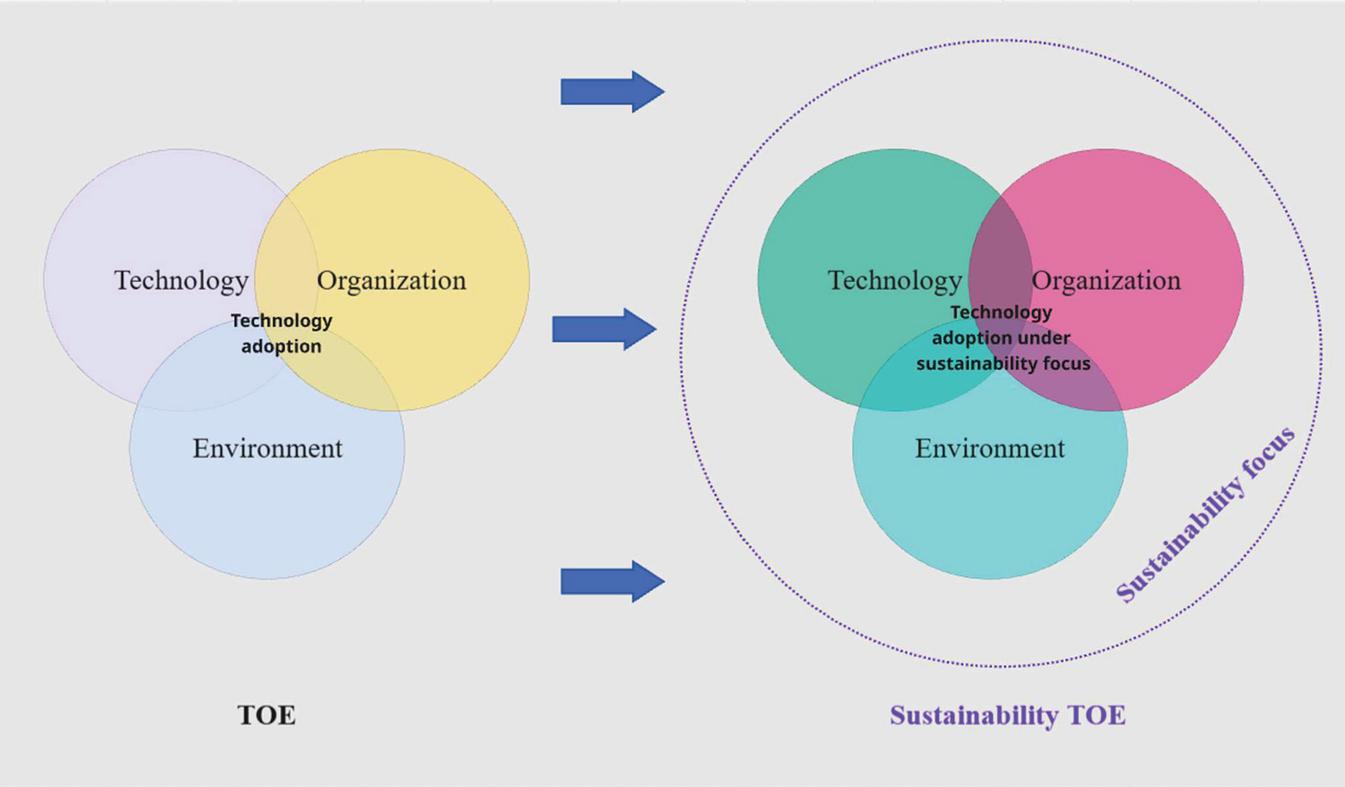
Figure 1 Conceptual model in this study and past work.
Source: From Author’s literature review.
2 Literature Review and Related Concepts
This study was developed from a comprehensive literature review divided into 3 parts: 1. Digital supply chain finance: DSCF, 2. Technology-Organization-Environment: TOE and 3. Institution Theory: IT. The researcher used all 3 concepts to develop a conceptual model to create acceptance of DSCF in the context of organizations in developing countries.
2.1 Digital Supply Chain Finance and Sustainability
Digital Supply Chain Finance (DSCF) is a financial innovation in the operation system that we receive from digital technology. Sometimes organizations manage to manage in the management, which reduces the frequency and expands to the source that can access the executives in the system as usual. Small and medium-sized enterprises [8]. Under traditional Supply Chain Finance (SCF) features can still be a lot of documents and delayed credit approval. DSCF Technologies such as Blockchain, Cloud Computing, and Big Data Analytics help analyze, review and approve automatically efficiently and proceed [8] (Table 1). From Li, et al. [3] study, it was found that DSCF enhances the aspects of Supply Chain Resilience, improve the system’s performance through the introduction of the Green Innovation Check, which directly affects the trial immediately.
With such features, organization with DSCF usage learns to monitor and manage working capital. It enables businesses to perform in various areas under ESG goals effectively and efficiently through channels that increase the intensity of working capital and continue to SMEs in efficiency [8].
Therefore, it can be said that DSCF not only enhances efficiency and flexibility in the supply chain but also plays an important role in supporting the organization’s sustainability goals [8]. The concept of sustainability means development that meets the needs of the current generation without affecting the ability to meet the needs of future generations [9]. Therefore, organizations must adjust their operations to be consistent with this principle by taking into account the environmental, social, and governance (ESG) dimensions to reduce negative impacts on natural resources, promote social justice, and create a transparent governance system. The results from previous [8, 10] studies indicate that the use of DSCF in conjunction with the Green Procurement approach can help reduce environmental impacts. And support tangible ESG (Environmental, Social, and Governance) goals. The E-Procurement system helps reduce paper use, reduce carbon emissions from approval and procurement processes, and promote transparency in supply chain management. In addition, the drive for DSCF should consider the design of financial processes in line with the principles of the Circular Economy [11] through the use of IoT and other digital technologies to support efficient resource circulation, reduce waste and waste in the supply chain, and increase opportunities for resource reuse. In summary, driving sustainability through DSCF not only strengthening financial and logistics processes but also an important tool for organizations to achieve ESG goals and create sustainable value in the supply chain.
However, DSCF has many advantages, but most organizations still struggle to implement it, especially in emerging countries, which may be due to the organizations’ lack of digital knowledge and skills, including the high cost of investment in new technologies that are common. Wang, et al. [7] indicate that the primary barrier for DSCF implementation is that management cannot take into account the overall market and competition, technological regulations are blurred, and there is a lack of resources and knowledge and infrastructure [4].
Table 1 Comparison of DSCF and traditional SCF
| Comparison | Digital Supply Chain | Traditional Supply Chain |
| Criteria | Finance (DSCF) | Finance (SCF) |
| Operational Model | Utilizes digital technologies such as Blockchain, IoT, Big Data, Cloud Systems | Relies on traditional processes and numerous physical documents |
| Credit Approval Process | Conducted through automated and digital platforms | Involves manual processes and is time-consuming |
| Data Transparency | Transparent and real-time via digital platforms | Data is not transparent, relies on documents and audits |
| Beneficiary Groups | Expands access to SMEs and small businesses | Focuses on large corporations and major clients |
| Financing Costs | Lower, due to reduced procedural steps and technology-driven risk assessments | Higher, due to manual assessments and inability to manage risk effectively |
| Sustainability | Supports ESG goals through efficient resource use and improved performance | Limited, often constrained by lack of integrated sustainability data |
| Analytical Capability | Leverages Big Data and AI to analyze risk and identify financing opportunities | Limited, relies on historical financial data and lacks advanced analytical tools |
| Source: From Author’s literature review. | ||
2.2 TOE Framework
Among the conceptual frameworks and models used to study the acceptance and use of technology in organizations, such as the Technology Acceptance Model (TAM), Unified Theory of Acceptance and Use of Technology (UTAUT), and Diffusion of Innovation (DOI), they all play an important role in explaining individual technology adoption behaviour.
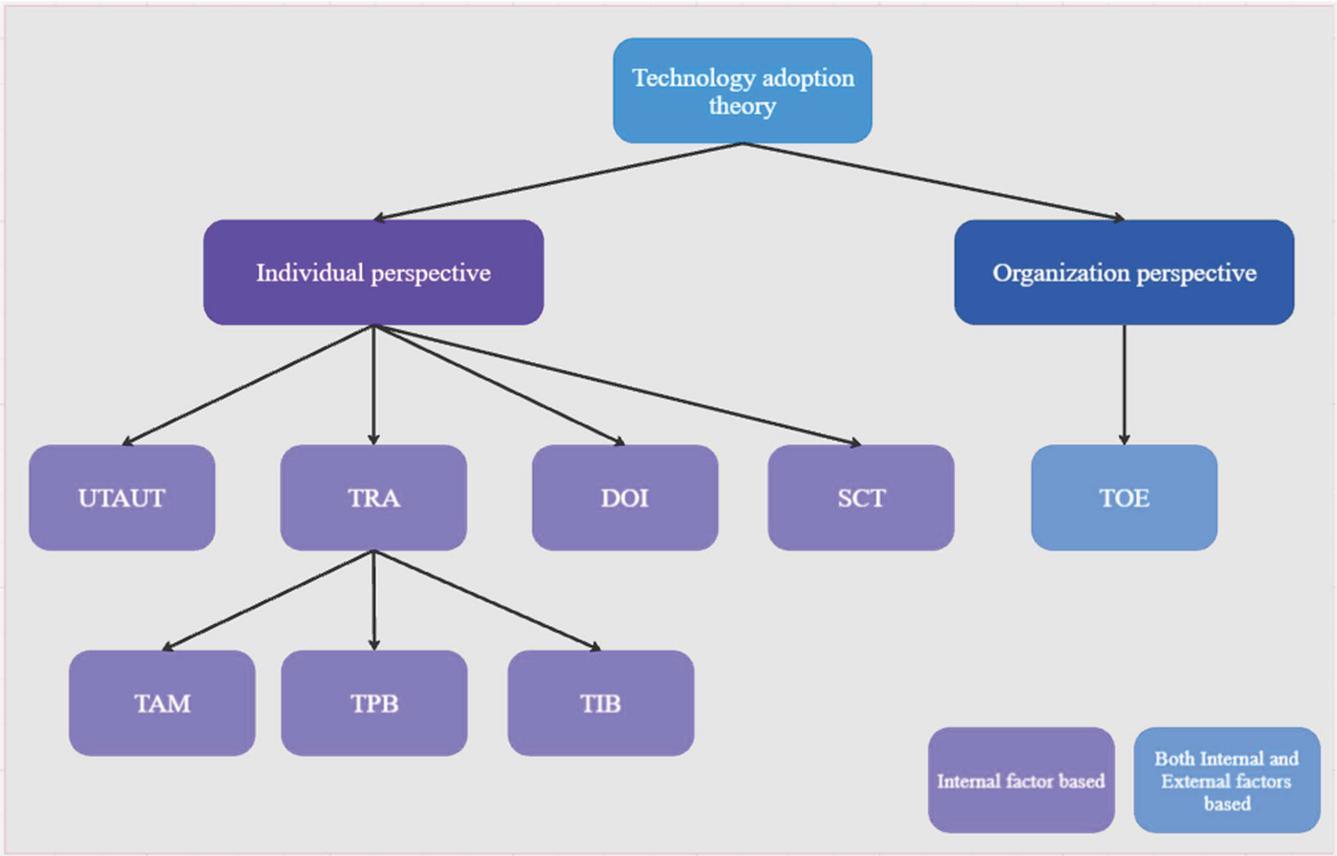
Figure 2 Concept of technology acceptance theory.
Source: From Author’s literature review.
Note: TRA theory of reasoned action , TPB theory of planned behavior, TIB theory of Interpersonal Behavior, SCT Social cognitive theory.
From literature review, the studies are divided into 2 main dimensions: the acceptance of technology in the individual dimension and the organizational dimension (Figure 2). From the study of Ramesh Sharda [12], it was found that the main technology acceptance models such as TAM, UTAUT, DOI, and TOE all have strengths in explaining the factors affecting the adoption of new technologies. The concept related to behavioral technology acceptance in the individual dimension, such as the Technology Acceptance Model (TAM), uses user behavioral variables through the variables Perceived Usefulness and Perceived Ease of Use, which have been proven to be able to indicate usage intentions. This reflects the study framework that focuses only on individual factors [13]. This model was further developed into the Unified Theory of Acceptance and Use of Technology (UTAUT), an extension of TAM by adding social variables and acceptance conditions such as Social Influence and Facilitating Conditions to explain external factors affecting users. However, like TAM, this concept still focuses on individuals, which does not cover the coordination process between departments within the organization and the adjustment of the support system [14] (Table 2). Since the above conceptual framework is a study of individual factors’ perspectives, it cannot fully reflect the organizational structural factor such as work culture, resources, or external pressures that influence the organization’s strategic decision-making in accepting technology. Therefore, there is a conceptual framework of technology acceptance for organizations. The theory that is often developed further comes from the concept of Diffusion of Innovation (DOI), which is a theoretical framework used to explain the diffusion of innovation in society through important characteristics of innovation such as Relative Advantage and Complexity variables. Although DOI can be applied to both individuals and organizations, it is not designed to analyze the internal organizational mechanisms or the “reinvention” process that often occurs when organizations actually adopt complex technologies [15]. It is more suitable for studying after the innovation has begun to be accepted and used (Acceptance and Adoption).
Therefore, TOE Framework, is developed. This concept organizes variables into three dimensions: Technological, Organizational, and Environmental Context, which provides a more organizational overview than other models. However, according to the study of Tornatzky, et al. [16], TOE is only a taxonomy of variables. Therefore, it is necessary to adjust the sub-variables and define additional structures according to the specific context of the organization to be studied. This makes TOE a conceptual framework that can be adjusted to fit the study of technology acceptance in the organizational dimension. The study results of Oliveira and Martins [17] also suggest that adding organizational strategic variables as well as the role of leadership will allow TOE to explain the financial innovation adoption process in more detail and comprehensively. Given these capabilities, the Technology-Organization-Environment (TOE) framework is well-suited for studying technology adoption in conjunction with the dimension of sustainability which is the key driver to pushing organizations forward to industry 4.0.
According to Chaudhuri, et al. [18], modern industries, including manufacturing and supply chains, need to integrate environmental and social goals into business strategies to enhance competitiveness and reduce risks from external environmental and regulatory pressures. Integrating sustainability is more than just a strategic adjustment, but is also an important factor that allows organizations to create long-term value, reduce costs from environmental risks, and meet stakeholder expectations in an era where the market is increasingly emphasizing ESG (Environmental, Social, and Governance) Nguyen, et al. [19].
Table 2 Comparison of technology acceptance concepts
| Dimension | DOI (Diffusion of Innovation) | TOE (Technology–Organization–Environment) | TAM (Technology Acceptance Model) | UTAUT (Unified Theory of Acceptance and Use of Technology) |
| Author | Everett Rogers, 1962 (Edited 1983, 1995) | Tornatzky & Fleischer, 1990 | Fred Davis, 1989 | Venkatesh, Thong, & Xu, 2012 |
| Developed from | Sociology, Communication Theory | Diffusion of Innovation + Organization Theory | Theory of Reasoned Action (Ajzen & Fishbein, 1980) | UTAUT (Unified Theory of Acceptance and Use of Technology, 2003) + TAM + DOI |
| Level of study | Individual/ Organization | Organization | Individual | Individual |
| Main component | Relative Advantage, Compatibility, Complexity, Trialability, Observability | Technology, Organization, Environment | Perceived Usefulness, Perceived Ease of Use | Performance Expectancy, Effort Expectancy, Social Influence, Facilitating Conditions, Hedonic Motivation, Price Value, Habit |
| Core concept | Diffusion of innovation in society through decision-making processes | The adoption of technology in an organization depends on the readiness of each context. | Individual acceptance depends on perceived usefulness and ease. | Integrates multiple models to comprehensively describe consumer technology usage. |
| Focus | Rate and pattern of diffusion | Organizational readiness to use technology | Intention to use technology systems | Technology use behavior and influencing factors |
| Usage | Study adoption, product diffusion | Assessing the organization’s strategic readiness | Study the behavior of IT system users | Explains the adoption of technology in the consumer and commercial sectors. |
| Benefit | Understand innovation dynamics in broad terms | Can be analyzed at multiple contextual levels | Simple model, widely used | Covers multiple usage contexts, supporting modern consumers |
| Constraint | Does not cover organizational structure or resources | Does not delve into individual psychological factors | Does not cover organizational or environmental factors | Complex models with many variables require large samples and advanced techniques. |
| Source: From Author’s literature review. |
Table 3 The TOE framework still has low sustainability studies
| TOE Factor | TOE Factor with Sustainability Integration | ||||||||
| Output Focus | Related Research | Sustainability Relevance | Sustainability Focus | Technology | Organization | Environment | Technology | Organization | Environment |
| Adoption | Katebi, et al. [21] | ||||||||
| Ofosu-Ampong and Acheampong [22] | |||||||||
| Hwang, et al. [20] | |||||||||
| Chaudhuri, et al. [18] | |||||||||
| Katebi and Tehrani [23] | |||||||||
| Lin [24] | |||||||||
| Akter, et al. [25] | |||||||||
| Nguyen, et al. [26] | |||||||||
| Chuah, et al. [27] | |||||||||
| Abed [28] | |||||||||
| Cruz-Jesus, et al. [29] | |||||||||
| Lu, et al. [30] | |||||||||
| Gupta, et al. [31] | |||||||||
| Ahmadi, et al. [32] | |||||||||
| Alsetoohy, et al. [33] | |||||||||
| Abdurrahman [34] | |||||||||
| Performance | Alnoor, et al. [35] | ||||||||
| Assaye, et al. [36] | |||||||||
| Huynh, et al. [37] | |||||||||
| N’Dri and Su [38] | |||||||||
| Ng, et al. [39] | |||||||||
| Nguyen, et al. [19] | |||||||||
| wael Al-khatib [40] | |||||||||
| Salah and Ayyash [41] | |||||||||
| Zhang, et al. [42] | |||||||||
| Wael et al.,2023 | |||||||||
| Salah et al.,2024 | |||||||||
| Source: From Author’s literature review. | |||||||||
From above, it is necessary to apply the TOE Framework in line with the context of the modern business world that emphasizes sustainability. The scope of the conceptual framework must be expanded to cover environmental factors and social responsibility more concretely, especially in the dimensions of organizations and the environment, which should add variables related to sustainability such as the ability to develop green, having a policy and strategy for sustainability within the organization, and the ability to adapt to environmental and social pressures. (Organizational Resilience for Sustainability) [18]. In the environmental dimension, it should be complemented with variables related to stakeholder environmental pressure and government support in terms of environmental policy, which will help companies realize their role in lowering their environmental impacts and properly react to ESG (Environmental, Social, and Governance) expectations [19]. In addition, in the technology dimension, importance should be given to the assessment of technologies that support sustainable development, such as green technology, technologies that reduce carbon footprints, and the introduction of digital technologies to enhance the efficient environmental management process [20].
The author’s literature review and screening research paper, which focuses solely on technology adoption and sustainability for TOE (Table 3) which provide insights into this topic, it was found that research that applied the TOE concept will have 2 forms: 1. Focus on the adoption of technology or innovation and 2. Focus on the benefit of using technology to enhance organizational effectiveness. When we analyzed the content of the research and the questionnaire, we found that research that mentioned sustainability relevance will mostly be in the group of research that focuses on the adoption of technology and innovation. When the author conducted an in-depth analysis and comparison to sustainability relevance studies, the research in the Technology and Innovation Acceptance group used sustainability concepts more than the Performance focus group. However, such studies only applied sustainability in the context of the environment variables rather than integrating sustainability concepts with all dimensions of variables in the TOE Framework. The addition of sustainability components will help make the TOE Framework more complete in the context of Industry 4.0 and the transition to a digital economy that emphasizes sustainability, allowing organizations to develop proactive strategies to drive their business along with the adoption of technology while taking care of society and the environment sustainably.
2.3 Institutional Theory
Institutional Theory (IT) is a conceptual framework that explains organizational behavior through the perspective of external environmental pressures, consisting of coercive pressures such as legal regulations, mimetic pressures such as developments in the industry or competition in business, and normative pressures that are like social values, such as some countries ban the consumption of certain types of meat, causing businesses to be directly exposed to such pressures [43]. Organizations do not decide to conduct activities or choose to use various innovations only for reasons of efficiency or economic returns, but also take into account legitimacy and acceptance from society and stakeholders [44]. Therefore, organizations often choose to use technology to show modernity and compliance with standards or practices that are accepted at the industry level, even though the use of that technology may not have a clear effect on efficiency [45]. In terms of the strengths of institutional theory, it can clearly explain organizational changes in terms of society, culture, and institutional environment. It also significantly explains the adoption and implementation behavior of new practices to maintain image and legitimacy in the eyes of society [46]. However, this theory has limitations in clearly explaining economic motivations and tends to give more weight to reactive behavior than proactive behavior [47]. In addition, the application of the theory in the context of technology adoption also found that it tends to focus on explaining the situation that has already occurred (post-hoc explanation) rather than predicting or planning future strategies [48].
Studies of how institutional theory influences technology adoption decisions have revealed that corporations often accept and apply new technologies under institutional forces instead of financial ones. For example, the 2009 passage of the HITECH Act has evolved into a coercive weapon in the US healthcare sector that accelerates the broad acceptance of electronic health records (EHRs) [49]. Simultaneously, mimetic pressures are crucial in driving companies in different sectors to embrace digital technologies to keep their competitiveness, such Industry 4.0 technologies in manufacturing processes to assist the circular economy concept [50]. In addition, normative pressures have also influenced the adoption of sustainability and environmental standards, such as the adoption of ISO 14001 and ESG (Environmental, Social, and Governance) practices in organizations, in order to meet the expectations of society and investors [51]. Often in the form of environmental variables, institutional theory plays a part in studies on technology and acceptance of innovation. (Environment) and external pressures (External Pressure) such the results of the study of Katebi, et al. [21, 23], which investigated the adoption of civic innovation using the TOE framework combined with institutional theory in the role of competitive pressure mixed with institutional theory. Furthermore demonstrating the importance of institutional ideas in addressing the adoption of new technologies and innovations of companies is the related research such Lu, et al. [30], which investigated the adoption of blockchain innovation using the same competitive pressure variable. In general, institutional theory is crucial in clarifying the decision-making process of companies in an era when social, economic, and technological environments are fast changing, especially in terms of developing legitimacy and acceptance from stakeholders, which are fundamental elements influencing the sustainability and competitiveness of organizations in the long run. In summary, institutional theory plays an important role in explaining the decision-making process of organizations in an era where social, economic, and technological contexts are rapidly changing, especially in terms of building legitimacy and acceptance from stakeholders, which are important factors affecting the sustainability and competitiveness of organizations in the long run. However, the application of this theory should take into account the limitations in explaining economic returns and should be combined with other theories such as the Dynamic Capability View or TOE Framework to obtain a comprehensive perspective and lead to more effective strategic decisions.
Table 4 Summarizes the differences of this study used in creating the conceptual model
| TOE Factor | |||||||||||
| Technology | Organization | Environment | |||||||||
| Output Focus | Related Research | Sustainability Focus | Complexity | Compatibility | Reliability in Platform | Strategic Digital Competence | Leader Commitment | Organization Sustainability Capacity | Coercive Pressure | Normative Pressure | Mimetic Pressure |
| Adoption | Proposed Model | ||||||||||
| Katebi, et al. [21] | |||||||||||
| Ofosu-Ampong and Acheampong [22] | |||||||||||
| Hwang, et al. [20] | |||||||||||
| Chaudhuri, et al. [18] | |||||||||||
| Katebi and Tehrani [23] | |||||||||||
| Lin [24] | |||||||||||
| Akter, et al. [25] | |||||||||||
| Nguyen, et al. [26] | |||||||||||
| Chuah, et al. [27] | |||||||||||
| Abed [28] | |||||||||||
| Cruz-Jesus, et al. [29] | |||||||||||
| Lu, et al. [30] | |||||||||||
| Gupta, et al. [31] | |||||||||||
| Ahmadi, et al. [32] | |||||||||||
| Alsetoohy, et al. [33] | |||||||||||
| Abdurrahman [34] | |||||||||||
| Performance | Alnoor, et al. [35] | ||||||||||
| Assaye, et al. [36] | |||||||||||
| Huynh, et al. [37] | |||||||||||
| N’Dri and Su [38] | |||||||||||
| Ng, et al. [39] | |||||||||||
| Nguyen, et al. [19] | |||||||||||
| wael Al-khatib [40] | |||||||||||
| Salah and Ayyash [41] | |||||||||||
| Zhang, et al. [42] | |||||||||||
| Source: From Author’s literature review. |
The reviewed literature highlights that prior studies on traditional SCF adoption have primarily emphasized financial efficiency, cost reduction, and operational improvements, with limited attention to broader strategic goals such as sustainability and Industry 4.0 transformation. Research on DSCF adoption remains fragmented, often isolating either technological aspects or economic benefits from adoption and lacking a holistic organizational perspective. These conceptual and contextual gaps are synthesized in Table 4 (Section 3), which contrasts our proposed model with existing studies and clarifies its theoretical and practical novelty. Building on this synthesis, the proposed model integrates the TOE framework to systematically capture technological readiness, organizational capabilities, and environmental pressures, while institutional theory enriches the understanding of external influences on adoption decisions. The sustainability perspective ensures that adoption is evaluated not only for economic benefits but also for its contribution to long-term sustainability value. This integrated approach addresses the literature gap by offering a comprehensive explanation of DSCF adoption in emerging economies and linking it directly to Industry 4.0 and sustainability objectives.
3 Research Model and Hypotheses
The researcher synthesized the research gaps and presented a conceptualize model after reviewing the literature in Part 2. It was found that studies on technology adoption still have some gaps. It was found that studies using the TOE concept often do not study all the pressures defined by institutional theory and tend to focus only on government pressure and competitive pressure because most studies focus mainly on economic efficiency. Secondly, it was found that the use of the TOE concept often neglects to consider organizational motivations beyond the direct effectiveness of technology use, such as the sustainability of the organization’s competition (Table 4). Therefore, to design a new conceptual framework based on basic theory and find research gaps [52], the researcher created a conceptual model using the TOE framework, which is the main conceptual framework used in studying technology adoption in the organizational context. The researcher integrated this concept with the concept of sustainability and institutional theory together to make the conceptual model take into account the acceptance of technology that considers sustainability factors to be consistent with the context of the economy in the Industry 4.0 era. In order for the development of the conceptual model based on TOE to be able to study the acceptance of technology of organizations with consideration of sustainability as shown in Figure 3.
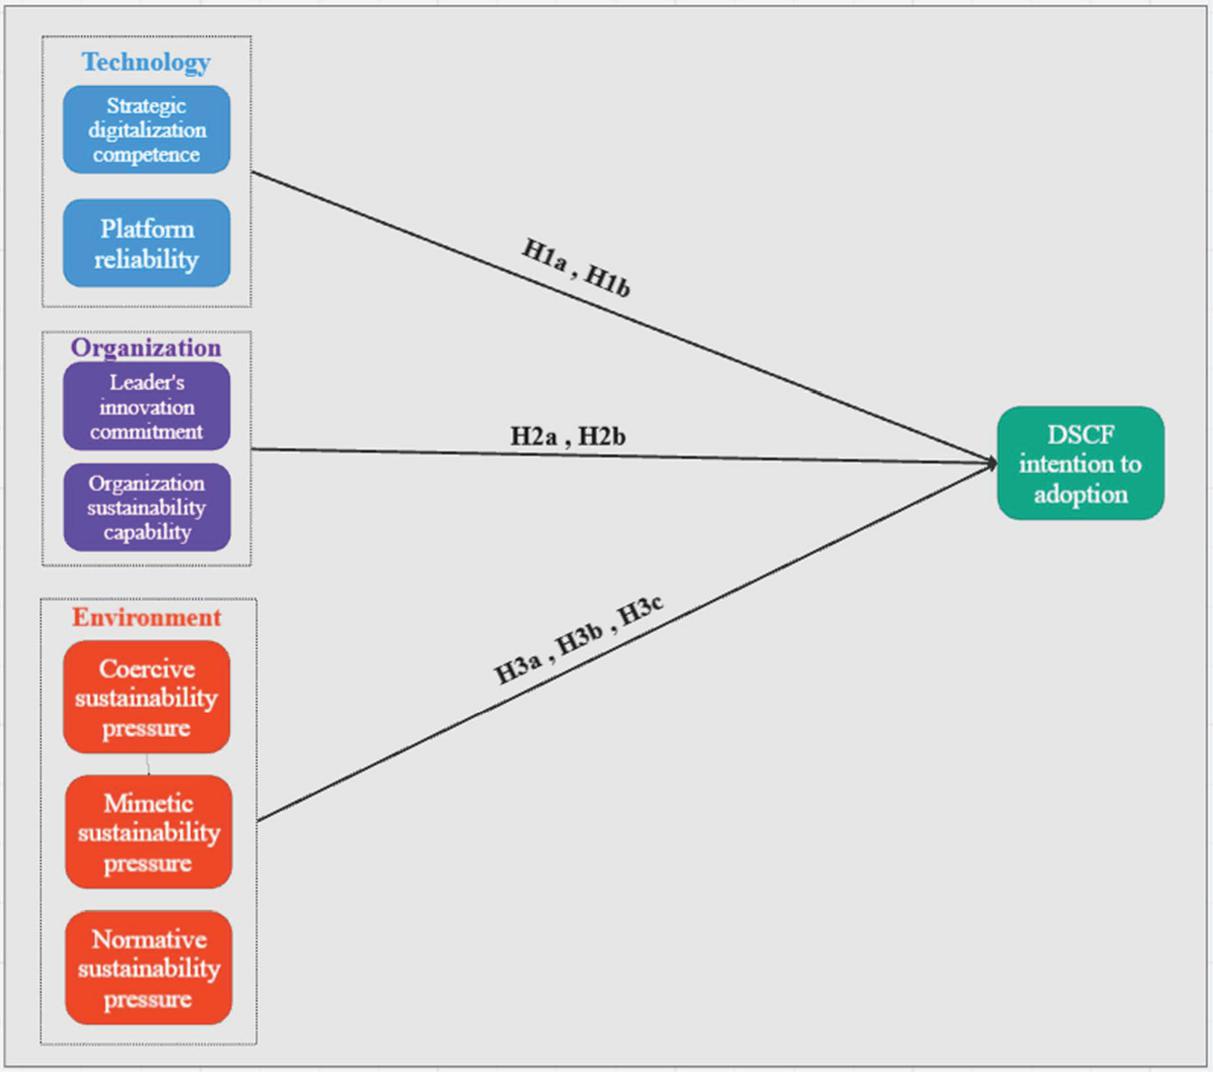
Figure 3 Research model and hypotheses.
Source: Author.
Table 5 Definition of variables in the research model
| Name | Definition | References |
| Reliability in Platform (RP) | Reliability in DSCF platform that supplier and purchasing organization intend to using for transaction | adapt from [53–55] due to nature of DSCF platform is not rely on complexity and advantage but trust and transparency |
| DSCF Intention to adoption (DFIN) | Intention to adoption Digital supply chain finance (DSCF) platform | adapt from [56, 57] |
| Coercive sustainability pressure (CSP) | Pressure from regulatory for sustainability purpose | adapt from [50, 58–60] |
| Normative sustainability pressure (NSP) | Pressure from society for sustainability purpose | adapt from [50, 58, 59] |
| Mimetic sustainability pressure (MSP) | Pressure from competitor and industry for sustainability purpose | adapt from [23, 50, 58, 59] |
| Organization sustainability capability (OSC) | Organization sustainability sensing , seizing and reconfiguring capability | adapt from [18, 59, 61] |
| Leader’s innovation commitment (LIC) | Top management and leader commitment to innovation and sustainability | adapt from [26, 62] |
| Strategic digitalization competence (SDC) | Strategic plan for organization digital transformation | adapt from [39, 63, 64] |
| Source: Author. | ||
3.1 Modelling and Hypothesis
In terms of defining the variables in this study, the researcher has referenced research that is consistent with the researcher’s study objectives. From the literature review, it was found that past research was not very consistent with the research objectives. Therefore, the researcher had to refer to the design of the conceptual model in many studies to be consistent with the design of the variables and hypotheses in the study in order to develop the conceptual model using TOE as the main concept and adding institutional and sustainability theories as shown in Table 5.
3.1.1 Hypothesis of technology factors
The hypotheses were constructed, and adaptation under the TOE Framework proposed by Tornatzky, et al. [16] in the context of the adoption of the Digital Supply Chain Finance (DSCF) platform. Therefore, the author assessed that the factors affecting the acceptance of the DSCF Platform are whether the use of the platform is consistent with the organization’s digital strategic readiness (Strategic digitalization competence: SDC) and how secure and reliable the platform is (Reliability in platform: RP). From the results of the studies by Lu, et al. [64] and Caliskan, et al. [55], it was found that trust in the platform is an important factor affecting the decision to accept this type of technology. Therefore, in this study, the researcher set the following hypotheses regarding technological variables:
Hypothesis Group of Technology Factors Affecting DSCF Platform Acceptance
H1a: Digital Strategy Plan has a positive relationship with DSCF Acceptance
H1b: Digital Trade Finance Platform Trustworthiness has a positive relationship with DSCF Acceptance
3.1.2 Organizational factor hypothesis
In the organizational context, in order to study the strategic role of organizations and their ability to drive innovation in the context of digital transformation and sustainability, the author adapts the study from Nguyen, et al. [26] and Cruz-Jesus, et al. [29], which illuminate the importance of the organizational leader’s role in setting strategic visions, supporting decisions to invest in new technologies, and driving innovation adoption within the organization. Combined with sustainability and an ESG perspective, making Organizational Sustainability Capability is an important element that allows organizations to adopt new technologies to reduce environmental impacts and increase their competitiveness sustainably [19]. Therefore, in this study, adding the variables “Leadership’s innovation commitment” (LIC) and “Organizational Sustainability Capability” (OSC) to the conceptual model is critical because they can reflect the organization’s ability to respond to global sustainability trends and rapid technological changes. Committed leaders can effectively direct and allocate resources. At the same time, sustainability capabilities help organizations to have a business approach that balances profits with social and environmental responsibilities, which are important factors for long-term survival and growth. Therefore, in this study, the researcher hypothesizes the following organizational variables:
Group of hypotheses on organizational factors affecting the adoption of the DSCF Platform
H2a: The commitment of leaders/executives to adopt innovations/technology has a positive relationship with the adoption of DSCF
H2b: The organization’s potential in sustainability has a positive relationship with the adoption of DSCF
3.1.3 Environmental factor hypothesis
Environmental contexts play an important role in technology adoption because they are variables that stimulate organizations to be aware of the need to adapt to a rapidly changing business environment, such as pressure from competitors causing organizations to accelerate the adoption of technology to maintain a competitive advantage. In this study the author applied institutional theory to study the external pressure to organization. However, past research has limitations in considering environmental factors in the sustainability context, especially in the current era where environmental and social issues have a significant impact on business practices [19]. Therefore, this research needs to expand the scope of environmental factors in the TOE Framework by adding new variables that reflect sustainability pressures from both the government, industry, and society. This is to be able to explain technology adoption behavior in the context of the current increasing importance of sustainability more accurately and completely. This will enable organizations to use digital technologies such as the Digital Supply Chain Finance (DSCF) platform to support sustainability goals and increase their long-term competitiveness effectively. Therefore, in this study, the researchers hypothesize the following organizational variables:
Hypothesis Group of Environmental Factors Affecting the Acceptance of DSCF Platform
H3a: Sustainability pressure from the government has a positive relationship with the acceptance of DSCF
H3b: Sustainability pressure from the industry and the market has a positive relationship with the acceptance of DSCF
H3c: Sustainability pressure from society has a positive relationship with the acceptance of DSCF
4 Research Methodology
This research was designed to identify the research problem, define the research objectives, review the literature and present the research model along with the hypotheses, which are presented in Sections 1–3. The author developed a conceptual model of technology acceptance by combining the theoretical concept of TOE with institutional theories under sustainability perspective. The model combined the original theoretical concepts and was revised according to the literature review to keep up with the times. In addition to the integration of theory in this study, the researcher also integrated the study process. While PLS-SEM was used to examine the latent structure and hypothesised paths of the TOE framework, hierarchical regression on composite scores was employed to test the incremental explanatory power of variable blocks, probe interaction effects, and assess the robustness of the PLS-SEM findings [65].
4.1 Research Synthesis Process
The research process included problem identification, research objectives, and a comprehensive literature review in Sections 1–2. In Section 3, the hypotheses and the conceptual model, and All over the methodology for this research are presented as Figure 4.
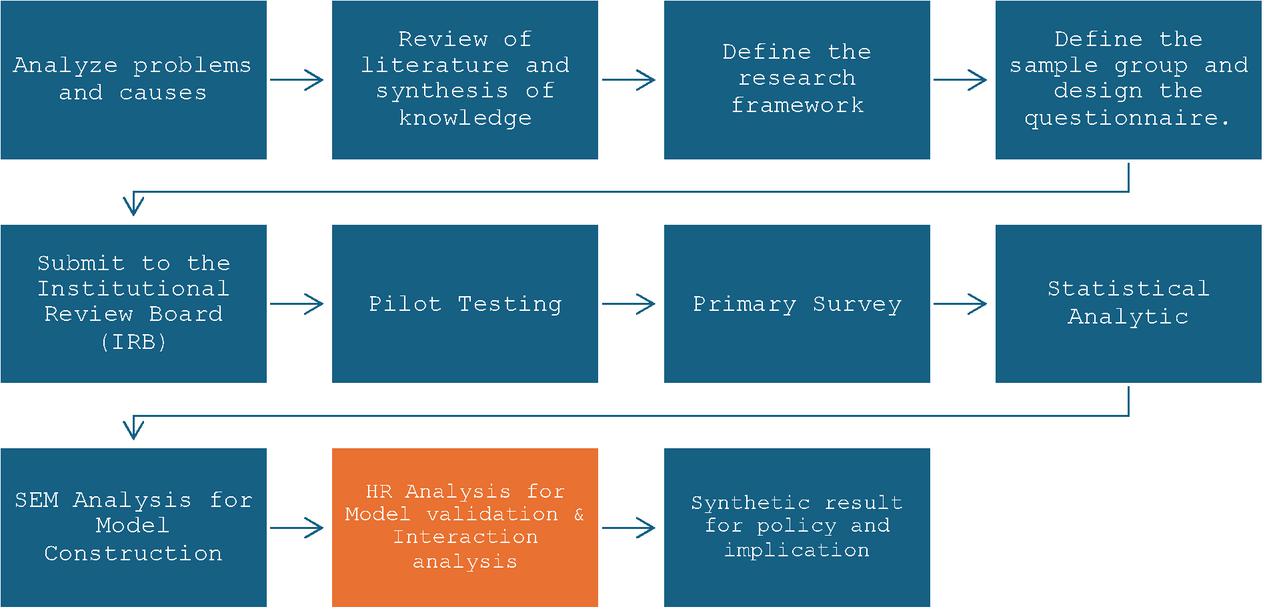
Figure 4 Research process steps and adding new steps in this study.
Source: Author.
Orange: New process in TOE conceptualize model paper.
4.2 Sample Group and Questionnaire Collection Channels
The target group for the survey in this research focuses on the private business sector in Thailand. The survey was conducted online under the SurveyMonkey website. For the convenience of answering the questionnaire, the researcher distributed the questionnaire through online channels on social media platforms such as Facebook, LinkedIn, Line, as well as direct contact through the authorized units in each department via E-mail. The sampling method was randomly selected, with the survey being conducted during November 2024 – January 2025. The respondent group must belong to a department that has the authority to approve, select, decide, present, or work on selecting suppliers, payment terms, and digital supply chain finance platforms. The sample group will belong to the purchasing department, as well as business owners or executives who have the authority to determine the channels and methods of using trade credit in different industries. This is to reflect the perspectives of those familiar with supply chain finance and the overall relationship between organizations in Thailand.
Table 6 General information of the sample group (N 310)
| Items | Details | Frequency | Percentage |
| Gender | Male | 183 | 59.00 |
| Female | 121 | 39.00 | |
| Non-Binary | 6 | 1.90 | |
| Education level | Bachelor’s Degree or equivalent | 128 | 41.30 |
| Master’s Degree | 173 | 55.80 | |
| Doctorate Degree or higher | 9 | 2.90 | |
| Age | 18–24 | 6 | 1.90 |
| 25–34 | 100 | 32.30 | |
| 35–44 | 116 | 37.40 | |
| 45–54 | 39 | 12.60 | |
| 55–64 | 29 | 9.40 | |
| 65 | 20 | 9.50 | |
| Income | 15,000 THB | 4 | 1.30 |
| 15,000 – 30,000 THB | 34 | 11.00 | |
| 30,001 – 50,000 THB | 58 | 18.70 | |
| 50,001 – 70,000 THB | 59 | 19.00 | |
| 70,001 – 150,000 THB | 68 | 21.90 | |
| 150,001 – 300,000 THB | 58 | 18.70 | |
| 300,001 THB | 29 | 9.40 | |
| Job Position | Staff/Associate : Entry level | 23 | 7.40 |
| Specialist/Senior/Coordinator level : Intermediate or experienced | 31 | 10.00 | |
| Manager-Supervisor Level : First-level management | 68 | 21.90 | |
| Director Level : Middle management | 56 | 18.10 | |
| C-Level : Executive or senior management | 64 | 20.60 | |
| Others | 68 | 21.90 | |
| Company | 1 – 5 Persons | 29 | 9.40 |
| Size | 6 – 50 Persons | 66 | 21.30 |
| (Employees) | 51 – 200 Persons | 35 | 11.30 |
| 201 – 300 Persons | 35 | 11.30 | |
| 301 – 500 Persons | 35 | 11.30 | |
| 500 Persons | 110 | 35.50 | |
| Sector | Agro & Food Industry | 1 | 0.30 |
| Consumer Products | 18 | 5.80 | |
| Financials | 37 | 11.90 | |
| Industrials | 88 | 28.40 | |
| Property & Construction | 37 | 11.90 | |
| Resources | 39 | 12.60 | |
| Services | 35 | 11.30 | |
| Technology | 34 | 11.00 | |
| Other | 21 | 6.80 | |
| Note: all of the statistical value are rounded into 2 decimal digits. |
4.3 Questionnaire Design
For the design of the questionnaire to test the conceptual model and hypotheses The questionnaire was designed for the quantitative study purpose through literature review and adjusted to fit the context of the group (Table 6). The researcher designed the questionnaire in 2 main parts: 1. General information (Table 7) and 2. Information on technology, organization, and leadership roles and sustainability (Table 8). The questionnaire in Part 2 was answered using a Likert scale, ranging from 1 (least agree) to 5 (most agree).
4.4 Data Collection and Research Ethics Committee in the Central Group
Data were collected from private sector experts who belong to the departments that have the authority to approve, select, decide, present or work on selecting suppliers, payment terms and digital supply chain finance platforms to reflect the perspectives of those familiar with supply chain finance and inter-organizational relationships through an online questionnaire. The research procedures and processes, as well as the research instruments, were approved by the ethics review committee to ensure compliance with ethical standards. The questionnaire used in this study was approved by the Mahidol University Institutional Review Board and received the approval number COE No. MU-CIRB 2024/079.2905.
4.5 Pilot Testing
The survey was divided into 2 steps. The first round of survey was a pilot testing survey, which aimed to check the accuracy of the questionnaire. The target group was 30 people who were consistent with the sample group. The survey took 14 days. Since the pilot testers belonged to the business sector and were specific departments, and it was the end of the year with many holidays, the pilot test took about 2 weeks. After the pilot test was completed, the researcher randomly selected the testers to comment on any unclear or misunderstood questions in order to improve the main survey.
Table 7 Questionnaire structure, reliability and validity
| Outer | Cronbach’s | |||||
| Loadings | Alpha | CR | AVE | VIF | ||
| Abbr. | Measurement Items | (0.7) | (0.7) | a (0.7) | (0.5) | (5) |
| Reliability in Platform (RP) | The digital trade finance platform your company regularly uses is trusted for reliable operations at all times. | 0.883 | 0.892 | 0.911 | 0.822 | 2.584 |
| The digital trade finance platform your company uses is transparent and trustworthy. | 0.91 | 2.486 | ||||
| Your company has more confidence in the digital trade finance platform it uses regularly than in other systems. | 0.926 | 3.506 | ||||
| DSCF Intention to adoption (DFIN) | The digital trade finance platform you use has a network driven by digital systems within the supply chain to support communication both within and across organizational boundaries. | 0.925 | 0.915 | 0.916 | 0.855 | 3.154 |
| The digital trade finance platform you use connects suppliers, customers, and other partners, providing on-demand access to supply chain data and promoting real-time communication. | 0.921 | 3.186 | ||||
| The digital trade finance platform you use maintains an integrated database and access methods to facilitate information sharing. | 0.927 | 3.232 | ||||
| Coercive sustainability pressure (CSP) | Companies in your industry recognize fines and penalties associated with irresponsible transparency practices. | 0.784 | 0.703 | 0.703 | 0.627 | 1.321 |
| Environmental violations by companies in your industry may result in brand value loss and negative market or stakeholder evaluations. | 0.795 | 1.411 | ||||
| Companies failing to comply with federal, state, or municipal human rights regulations face negative impacts. | 0.797 | 1.395 | ||||
| Normative sustainability pressure (ISP) | Your industry expects all companies to prioritize sustainable business practices over short-term profit. | 0.797 | 0.724 | 0.725 | 0.644 | 1.447 |
| Social responsibility is a requirement for companies wishing to be part of your industry. | 0.815 | 1.419 | ||||
| Complying with transparency requirements for stakeholders in Thailand is a fundamental necessity for your company. | 0.795 | 1.401 | ||||
| Mimetic sustainability pressure (MSP) | Leading companies in your industry are exemplary in social responsibility. | 0.855 | 0.859 | 0.859 | 0.78 | 1.862 |
| Leading companies in your industry have a reputation for promoting good governance practices. | 0.892 | 2.399 | ||||
| Leading companies in your industry conduct business with environmental considerations. | 0.903 | 2.562 | ||||
| Organization sustainability capability (OSC) | Your company allocates sufficient financial support for implementing carbon neutrality management projects. | 0.875 | 0.897 | 0.911 | 0.829 | 2.438 |
| Your company regularly evaluates environmental technology expertise and maintains a professional approach. | 0.94 | 3.569 | ||||
| Your company shares environmental management knowledge with other partners. | 0.915 | 2.822 | ||||
| Leader’s innovation commitment (LIC) | Your leaders view digital trade finance as critical to Industry 5.0. | 0.903 | 0.913 | 0.913 | 0.852 | 2.656 |
| Your organization’s leaders are seriously exploring opportunities to enhance digital trade finance capabilities. | 0.943 | 4.108 | ||||
| Your senior leaders recognize the involvement of partners in digital trade finance platforms. | 0.924 | 3.431 | ||||
| Strategic digitalization competence (SDC) | Creating a shared vision about the role of digital technology in business strategy is essential for your company. | 0.773 | 0.793 | 0.827 | 0.705 | 1.553 |
| Your company regularly plans together on how digital technology will support business strategy. | 0.883 | 1.773 | ||||
| Your company has regular discussions before making strategic decisions. | 0.859 | 1.772 | ||||
| Note: all of the statistical value are rounded into 2 decimal digits. | ||||||
4.6 Primary Survey
After the questionnaire was adjusted according to the suggestions from the pilot survey, the next step was the primary survey. The questionnaires were purposive sampling distributed to the target sample group through online surveys on the SurveyMonkey website and distributed through social media platforms such as Facebook, LinkedIn, Line, as well as direct contact through the responsible units in each department via E-mail, totaling 400 sets, and 323 sets were responded, representing a response rate of approximately 80.75%. However, some of the questionnaires could not be used for further study. Therefore, the researcher cut some of the questionnaires, leaving only 310 sets that could be used. The data was analyzed using SPSS version 18 for preliminary statistical data, as well as questionnaire inspection and SmartPLS 4.1.0.9 to examine hypotheses and the conceptual model structure. Table 6 shows the sample group’s demographic data in terms of job positions and industries. Table 7 shows the reliability and validity results of the questionnaire indexes, including Loading, Cronbach’s alpha, CR, AVE, and variance expansion factor (VIF).
4.7 Common Method Bias
Before the researcher started collecting data, the researcher used the process of Chang, et al. [66] to design the survey and collect the questionnaires. To prevent bias from a single source, such as designing clear questions, maintaining the anonymity of the respondents, and separating the questions of each variable, etc., after collecting data according to steps 4.5 – 4.6, the researcher checked the Common Method Bias with SPSS version 18 by analyzing with Harman’s Single-Factor Test [67] and analyzing with the Partial Correlation Procedure using the job position level as a mediator variable (Marker Variable) [68]. The result of the Eigenvalue analysis with the highest value was found to be 43.524%, which is lower than the recommended value of 50% – 60% [69]. And the analysis with the Partial Correlation Procedure did not find that the Tenure variable was significantly related to other variables, reflecting that the impact of Common Method bias was low.
4.8 Statistical Data Analysis
The data obtained from the questionnaires and all 310 usable sets will be cleaned, formatted, and analyzed using the SmartPLS 4.1.0.9 program to assess the relationship of variables in the conceptual model, the structural model, and the appropriateness of the model, as well as to test the research hypotheses. The steps in interpreting the research results will be in Section 5. Discussion and policy recommendations will be in Section 6. This research will assess the factors influencing DSCF that enhance organization sustainability by surveying a group of people with experience in the private sector supply chain. The independent variables used in the study will consist of variables that are grouped in the TOE theoretical framework, which integrates other theories into the conceptual model, including institutional and sustainability theories, which affect the acceptance of DSCF platforms to study the perspectives of organizations’ acceptance of new technologies under the consideration of sustainability.
In this study, in addition to using the Structural Equation Model (SEM) to study and design a conceptual model, it also studied the importance of each variable and the interaction effect between variables through the Hierarchical Regression model to create and determine policies from the results of this study. For SEM, the researcher chose to use the PLS-SEM technique to analyze the data because it can be analyzed in both reflective and formative forms in the same model [70], along with the ability to manage complex models, and can maximize the variance of the dependent variables used in the study [71]. In addition, this study did not have an assumption of the distribution of the data groups [72]. This research aims to develop a new theory and focus on prediction through the integration of TOE theory, Institutional Theory, and sustainability, which are composite models. (Composite-based Model) Therefore, the analysis with PLS-SEM is more appropriate than the use of CB-SEM, which is suitable for models that focus on studying each factor (Factor-based Model) [73]. While the analysis with Hierarchical Regression (HR), the author will using HR tests whether these relationships remain robust when predictors are entered sequentially – first controls, then TOE–Institutional–Sustainability blocks, and finally interaction terms. This allows the study to explicitly evaluate the additional contribution of moderating effects and to verify that the structural relationships identified in SEM hold when examined with a different statistical lens, thereby strengthening the validity and robustness of the conclusions. To be used in synthesizing policy guidelines and recommendations.
5 Research Results
This research used SmartPLS version 4.1.0.9 to analyze the survey results and verify the conceptual modeling. By using the Structural Equation Modeling (SEM) method to help analyze the model by measuring and verifying the conceptual model simultaneously. The evaluation process began with measuring the model to assess the validity and reliability of the questionnaire structure and various variables. Then, the structural model was used to test the hypothesized relationship. For the Hierarchical Regression analysis, the researcher used SPSS version 29.0.2.0 (20) to analyze the explanatory capability of the model when adding interaction effect variables between endogenous variables, as well as to examine various statistical problems such as Multicollinearity, Serial correlation, and heteroskedasticity.
Table 8 Fornell-Larcker criterion
| Construct Name | SDC | DFIN | CSP | MSP | NSP | LIC | OSC | RP |
| SDC | 0.84 | |||||||
| DFIN | 0.73 | 0.92 | ||||||
| CSP | 0.46 | 0.49 | 0.79 | |||||
| MSP | 0.62 | 0.69 | 0.54 | 0.88 | ||||
| NSP | 0.45 | 0.45 | 0.47 | 0.56 | 0.80 | |||
| LIC | 0.37 | 0.56 | 0.28 | 0.52 | 0.24 | 0.92 | ||
| OSC | 0.57 | 0.68 | 0.44 | 0.73 | 0.44 | 0.63 | 0.91 | |
| RP | 0.55 | 0.64 | 0.24 | 0.46 | 0.14 | 0.33 | 0.35 | 0.91 |
| Note: all of the statistical value are rounded into 2 decimal digits. | ||||||||
5.1 Measurement Model Analysis
For the evaluation of the relevant indicators and the path coefficient using the SmartPLS program version 4.1.0.9 using the Bootstrapping method according to the study of Henseler, et al. [74] and Hair Jr, et al. [71], the analysis was conducted with 5,000 sub-samples. It was found that the indicators had weight values (range from 0.77 to 0.94), Cronbach’s alpha values (range from 0.70 to 0.91), CR (range from 0.70 to 0.92) and AVE (range from 0.63 to 0.85), all of which exceeded the 0.7 level and exceeded 0.5 for the AVE, reflecting that the measurement model was reliable and valid. According to the conditions of Hair Jr, et al. [71], there were 24 questions in total, 3 groups of variables, as shown in Table 7.
For the test of the possibility of a linear relationship between variables (Multicollinearity test) for the structural model study, the researcher used the Variance Inflation Factor (VIF) in Table 7, which was found to be between 1.321 and 4.108, which is at an acceptable level or lower than 5 [75], reflecting that the study results are stable enough. The researcher performed additional analysis with Fornell-Larcker to assess the validity of the model. From Table 8, when considering the values obtained along the diagonal, which is the square root of AVE, and the criteria for accepting that the model is valid, it is considered that the value must be greater than or equal to 0.7, reflecting that the researcher’s model complies with the Fornell-Larcker criteria that are acceptable. Finally, the researcher evaluated Heterotrait-Monotrait ratio (HTMT) which is used to measure the similarity of variables and indicates that the variables do not overlap or overlap too much. As shown in Table 9, all HTMT values are lower than 0.85, which is considered an acceptable level for the study [74].
Table 9 Heterotrait-Monotrait ratio (HTMT)
| Construct Name | SDC | DFIN | CSP | MSP | NSP | LIC | OSC | RP |
| SDC | ||||||||
| DFIN | 0.83 | |||||||
| CSP | 0.59 | 0.61 | ||||||
| MSP | 0.73 | 0.78 | 0.70 | |||||
| NSP | 0.57 | 0.55 | 0.66 | 0.71 | ||||
| LIC | 0.41 | 0.61 | 0.35 | 0.59 | 0.30 | |||
| OSC | 0.64 | 0.75 | 0.56 | 0.83 | 0.55 | 0.70 | ||
| RP | 0.65 | 0.69 | 0.29 | 0.52 | 0.22 | 0.36 | 0.37 | |
| Note: All of the statistical value are rounded into 2 decimal digits. | ||||||||
5.2 Structural Model
The structural model was tested for hypothesis using survey data collected and processed as detailed in Section 4.8 through the use of SmartPLS version 4.1.0.9 program with the purpose of proving the hypothesis from the conceptual model of the research as detailed in Section 3 with a total of 310 data and 5000 bootstrapping for the sub-samples [71, 74] and the significance level for considering the path coefficient (Path coefficient: ) at the level of 99, 95 and 90 percent, respectively (Significant at: p 0.01; t 2.576, **Significant at: p 0.05; t 1.96 *Significant at: p 0.1; t 1.645).
From the above conditions The researcher therefore conducted a path coefficient () analysis according to the hypothesis presented in Section 3.1 using the SmartPLS 4.1.0.9 program to perform statistical analysis and consider statistical significance. It was found that the model had t-values and p-values that met the specified conditions. It was found that the hypotheses H1a, H1b, H2a, H2b, H3a, and H3c were statistically significant. Only H3b was not statistically significant, as shown in Figure 5.
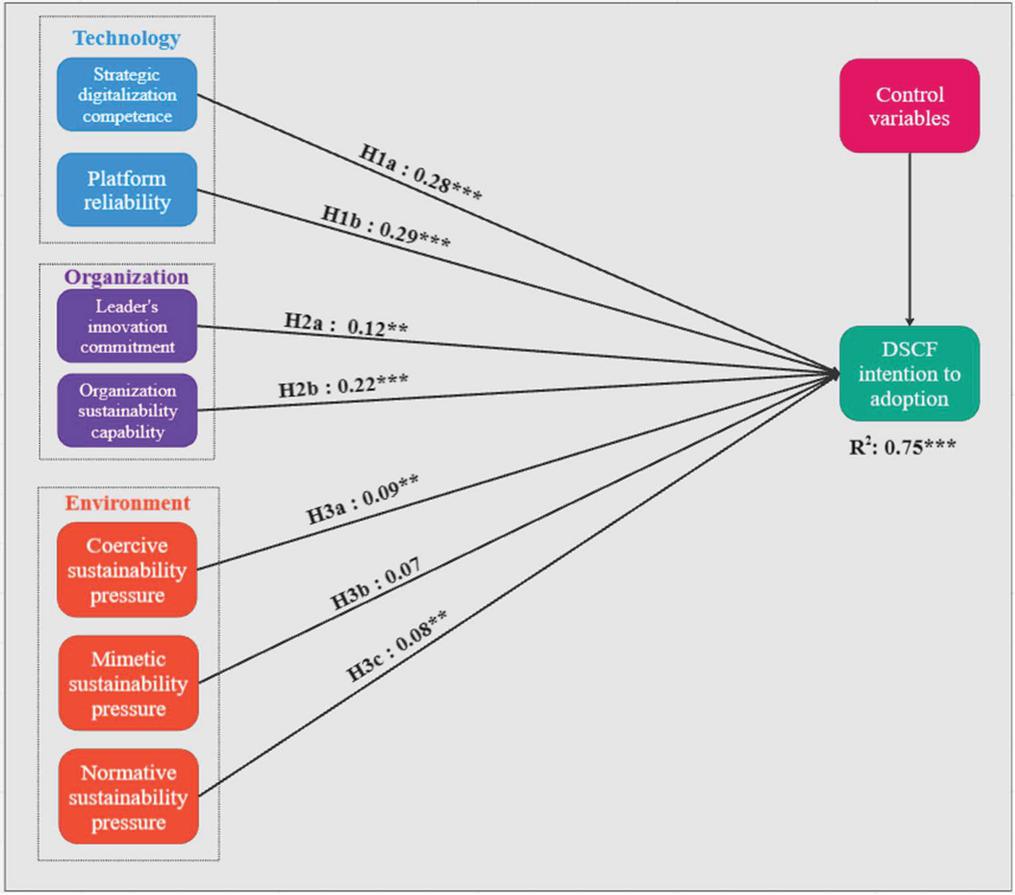
Figure 5 Summary of the results of the structural model and hypotheses.
Source: From Author’s literature review.
Note: ***Significant at: p 0.01; t 2.576, **Significant at: p 0.05; t 1.96 *Significant at: p 0.1; t 1.645, all of the statistical value are rounded into 2 decimal digits.
Table 10 Summary of research hypotheses
| Path | Inner VIF | |||||
| Hypotheses | Relationship | Coefficients | t-value | P-values | (5.00) | Decision |
| H1a | SDC DFIN | 0.28 | 4.48 | 0.00 | 1.59 | Supported*** |
| H1b | RP DFIN | 0.29 | 5.69 | 0.00 | 2.15 | Supported*** |
| H2a | LIC DFIN | 0.12 | 2.33 | 0.02 | 1.74 | Supported** |
| H2b | OSC DFIN | 0.22 | 3.42 | 0.00 | 2.80 | Supported*** |
| H3a | CSP DFIN | 0.09 | 2.17 | 0.03 | 1.54 | Supported** |
| H3b | MSP DFIN | 0.07 | 1.09 | 0.28 | 3.09 | Not Supported |
| H3c | NSP DFIN | 0.08 | 2.01 | 0.04 | 1.65 | Supported** |
| Note: ***Significant at : p 0.01; t 2.576, **Significant at: p 0.05; t 1.96 *Significant at: p 0.1; t 1.645, all of the statistical value are rounded into 2 decimal digits. | ||||||
Hypothesis Group of Technology Factors Affecting DSCF Platform Adoption
H1a: Digital Strategy Plan has a positive relationship with DSCF adoption
(SDC positively correlated to DFIN intention to adoption)
(, t-value 4.48, p-value 0.00, Inner VIF 1.59)
H1b: Digital Trade Finance Platform Trust has a positive relationship with DSCF adoption
(RP positively correlated to DSCF intention to adoption)
( 0.29, t-value 5.69, p-value 0.00, Inner VIF 2.14)
Hypothesis Group of Organizational Factors Affecting DSCF Platform Adoption
H2a: Commitment of Leaders/Organization Executives to Adopt Innovation/Technology has a positive relationship with DSCF adoption
(LIC positively correlated to DFIN intention to adoption)
( 0.12, t-value 2.33, p-value 0.02, Inner VIF 1.74)
H2b: Organizational sustainability potential has a positive relationship with DSCF adoption
(OSC positively correlated to DFIN intention to adoption)
( 0.22, t-value 3.42, p-value 0.00, Inner VIF 2.80)
Hypothesis group of environmental factors affecting the adoption of DSCF Platform
H3a: Sustainability pressure from the government sector It has a positive relationship with DSCF adoption
(CSP positively correlated to DFIN intention to adoption)
( 0.09, t-value 2.17, p-value 0.03, Inner VIF 1.54)
H3b: Sustainability pressure from industry and market has a positive relationship with DSCF adoption
(MSP positively correlated to DFIN intention to adoption)
( 0.07, t-value 1.09, p-value 0.28, Inner VIF 3.10)
H3c: Sustainability pressure from society has a positive relationship with DSCF adoption
(NSP positively correlated to DFIN intention to adoption)
( 0.08, t-value 2.01, p-value 0.04, Inner VIF 1.65)
The results of the structural model analysis are summarized in Table 10. The conceptual model is divided into 3 dimensions Technology-Organization-Environment as the initial variables to study the factors affecting the intention to use the digital trade finance platform under the organizational perspective. In the technology context dimension, the study found that Strategic Digitalization Competence (SDC) and Platform Reliability (RP) have a positive and highly statistically significant influence on the intention to adopt the DSCF system (H1a 0.28*** and H1b 0.29***, respectively). This is consistent with the hypothesis that the technological readiness of the organization is a fundamental factor facilitating the acceptance and application of advanced digital systems in the organizational context. The study results show that leaders’ innovation commitment has a significant positive effect (H2a 0.12**) and organizational sustainability capability. (Organizational Sustainability Capability) has a higher influence (H2b 0.22***), indicating that organizations with leaders who support innovation and have a management structure that emphasizes sustainability are more likely to accept and implement a digital supply chain system. For the environmental context dimension, it was found that coercive or regulatory pressure (Coercive Sustainability Pressure: H3a 0.09**) and normative pressure (Normative Sustainability Pressure: H3c 0.091**) have a positive impact on the intention to adopt DSCF with statistical significance. While mimetic or competitive pressure in the industry (Mimetic Sustainability Pressure: H3b 0.07), despite the positive direction, was not statistically significant. This can be interpreted that organizations emphasize the push from policies, government agency requirements, and industry norms more than imitating the sustainability behavior of other organizations in the same business sector.
5.3 Model Fit
After examining and criticizing the results of the conceptual model in Section 5.2, for the next step to examine the model fit, the researcher examined it through the SmartPLS program, using a total of 3 steps of measurement, starting with measuring the coefficient of determination (R), measuring the accuracy of the model prediction (Cross-validated redundancy measure: Q), and model consistency (Standardize Root Mean Squared Residual: SRMR). Finally, the average variance extraction (AVE) will be calculated together with R to measure the goodness-of-fit (GoF) of the model for examining the model fit [76].
Table 11 Goodness-of-Fit (GoF) measurement
| Latent Variable | AVE | R Square | Q | GoF |
| SDC | 0.70 | |||
| RP | 0.82 | |||
| LIC | 0.85 | |||
| OSC | 0.83 | |||
| CSP | 0.63 | |||
| MSP | 0.78 | |||
| NSP | 0.64 | |||
| DFIN | 0.85 | 0.75 | 0.72 | |
| Average | 0.76 | 0.75 | 0.72 | 0.76 |
| Note: All of the statistical value are rounded into 2 decimal digits. | ||||
From the results of the structural model in Figure 6, it is reliable and satisfactory for the study. The researcher also needs to measure the coefficient of determination (R) which is used to measure the variance explained by the independent variables. Chin and Marcoulides [77] stated that the R value that is lower than 0.19 – 0.33 is considered low, 0.33 – 0.67 has a medium level of predictive ability, and higher than 0.67 is considered high. The calculated R value is as follows: DFIN 0.75 according to Table 11. For the analysis of the measurement of the accuracy of the path model prediction (Cross-validated redundancy measure : Q) found that if the Q value is higher than 0, it is considered to have a small level of forecasting ability, a value higher than 0.25 is at a moderate level, and higher than 0.5 reflects a high level of forecasting ability. It was found that the Q value for the Manifest variable from the analysis had an average value at 0.61 and a minimum value at 0.56. In terms of Q for the Latent variable, it was at 0.72, which is higher than the criterion of Henseler, et al. [78], it is considered to have a high level of forecasting ability. Meanwhile, the standardized root mean square value of the model (SRMR) was at 0.06, which was lower than the recommended criterion of 0.08, indicating that the model was appropriate. This assessment followed the guidelines proposed by Henseler, et al. [79], which suggested that an SRMR value lower than 0.08 reflects an acceptable estimate of model fit in PLS-SEM, and the final analysis, the Goodness of Fit (GoF) analysis, found a value of 0.76, which is higher than 0.36, indicating that the model is valid and acceptable [75], as calculated in Equation (1) and Table 11.
| (1) |
The results of the above study demonstrate the empirical results by testing the hypotheses of the conceptual model. The researcher presented a conceptual model under the TOE theory, which has the initial factors (Input Factors) as variables of technology, organization and environment through the design of new variables that are different from the original. This study focuses on integrating sustainability into the study, which is an additional part for this study. It was found that from the results of the structural model study using the TOE concept as the main concept, combined with institutional and sustainability theories, it is capable of predicting the intention to accept the digital trade credit platform for sustainability at a high level. Next, the researcher will use the data to study with a hierarchical regression model (HR) for robustness and interaction effect validation.
5.4 Examination of Statistical Problems and Reliability of the Hierarchical Regression Model
The analysis began with examining the correlation matrix to consider the relationship between the independent variables and the dependent variables. The researcher conducted the analysis in the form of a full model (model 9), and found that most of the correlation values were at a suitable level (lower than 0.8), ranging from 0.59 to 0.73 from Table 12, which reduced the risk of multicollinearity problems as recommended by Hair, et al. [80]. In addition, the collinearity index was examined through the Variance Inflation Factor (VIF), and it was found that the VIF of all variables was between 1.25 and 3.91, as shown in Figure 6, which is at an acceptable level or lower than 5, indicating that there was no problem of high complex relationships [75]. The Durbin-Watson index was equal to 1.817, which is in the acceptable range (1.5–2.5), indicating that there was little independence of the residuals and therefore no problem of autocorrelation according to Field [81] criteria as shown in Table 13.
| SDC | LIC | OSC | RP | |||||||||||||||||||
| x | x | x | x | |||||||||||||||||||
| Size | Size | Size | Size | |||||||||||||||||||
| Pearson | Size | LIC | LIC | LIC | of | of | of | of | ||||||||||||||
| Correla- | Education | SCF | Job | of | x | x | x | Busi- | Busi- | Busi- | Busi- | |||||||||||
| tion | Construct | Age | Level | Income | Usage | Sector | Position | Business | SDC | CSP | MSP | NSP | LIC | OSC | RP | OSC | SDC | RP | ness | ness | ness | ness |
| Control | Age | 1.00 | 0.10 | 0.47 | 0.09 | 0.21 | 0.37 | -0.12 | -0.02 | 0.03 | 0.12 | 0.07 | -0.06 | 0.04 | -0.10 | -0.04 | -0.11 | 0.06 | -0.03 | 0.04 | 0.04 | -0.17 |
| Vari- | Education level | 0.10 | 1.00 | 0.34 | -0.26 | 0.24 | 0.02 | 0.26 | -0.04 | 0.04 | 0.05 | 0.14 | -0.09 | -0.10 | 0.01 | -0.02 | -0.05 | 0.04 | -0.01 | 0.01 | 0.03 | 0.08 |
| ables | Income | 0.47 | 0.34 | 1.00 | 0.15 | 0.16 | 0.44 | 0.22 | 0.03 | 0.06 | 0.13 | 0.14 | -0.03 | -0.01 | -0.09 | -0.11 | -0.13 | -0.06 | 0.12 | 0.08 | 0.16 | 0.04 |
| SCF usage | 0.09 | -0.26 | 0.15 | 1.00 | -0.22 | 0.34 | -0.34 | -0.04 | -0.15 | -0.20 | -0.19 | -0.12 | -0.08 | -0.19 | 0.06 | -0.02 | -0.06 | -0.04 | -0.17 | -0.07 | -0.12 | |
| Sector | 0.21 | 0.24 | 0.16 | -0.22 | 1.00 | 0.05 | 0.09 | 0.07 | 0.07 | 0.08 | 0.12 | -0.02 | 0.04 | -0.02 | -0.08 | -0.06 | -0.05 | -0.07 | 0.05 | 0.07 | 0.04 | |
| Job position | 0.37 | 0.02 | 0.44 | 0.34 | 0.05 | 1.00 | -0.05 | 0.01 | 0.04 | 0.00 | 0.10 | -0.08 | 0.02 | -0.07 | -0.09 | -0.18 | -0.16 | 0.12 | -0.01 | 0.09 | 0.05 | |
| Size of business | -0.12 | 0.26 | 0.22 | -0.34 | 0.09 | -0.05 | 1.00 | 0.03 | 0.10 | 0.16 | 0.13 | -0.08 | 0.04 | 0.00 | 0.09 | 0.02 | 0.17 | 0.02 | 0.00 | 0.00 | 0.05 | |
| Inde- | SDC | -0.02 | -0.04 | 0.03 | -0.04 | 0.07 | 0.01 | 0.03 | 1.00 | 0.46 | 0.62 | 0.45 | 0.38 | 0.57 | 0.55 | 0.02 | -0.11 | 0.19 | 0.06 | 0.02 | -0.05 | -0.02 |
| pend- | CSP | 0.03 | 0.04 | 0.06 | -0.15 | 0.07 | 0.04 | 0.10 | 0.46 | 1.00 | 0.54 | 0.47 | 0.28 | 0.45 | 0.24 | -0.11 | -0.07 | 0.01 | -0.04 | 0.06 | -0.06 | 0.04 |
| ent | MSP | 0.12 | 0.05 | 0.13 | -0.20 | 0.08 | 0.00 | 0.16 | 0.62 | 0.54 | 1.00 | 0.56 | 0.52 | 0.73 | 0.46 | 0.01 | -0.06 | 0.12 | -0.01 | 0.09 | -0.03 | 0.06 |
| Vari- | NSP | 0.07 | 0.14 | 0.14 | -0.19 | 0.12 | 0.10 | 0.13 | 0.45 | 0.47 | 0.56 | 1.00 | 0.24 | 0.44 | 0.14 | -0.18 | -0.26 | -0.01 | 0.00 | -0.01 | -0.06 | 0.09 |
| ables | LIC | -0.06 | -0.09 | -0.03 | -0.12 | -0.02 | -0.08 | -0.08 | 0.38 | 0.28 | 0.52 | 0.24 | 1.00 | 0.64 | 0.33 | -0.12 | 0.05 | -0.26 | 0.02 | 0.20 | 0.08 | 0.21 |
| OSC | 0.04 | -0.10 | -0.01 | -0.08 | 0.04 | 0.02 | 0.04 | 0.57 | 0.45 | 0.73 | 0.44 | 0.64 | 1.00 | 0.35 | -0.07 | 0.01 | 0.01 | -0.05 | 0.08 | -0.09 | 0.09 | |
| RP | -0.10 | 0.01 | -0.09 | -0.19 | -0.02 | -0.07 | 0.00 | 0.55 | 0.24 | 0.46 | 0.14 | 0.33 | 0.35 | 1.00 | 0.02 | 0.23 | -0.04 | -0.02 | 0.22 | 0.10 | 0.13 | |
| Inter- | LIC x OSC | -0.04 | -0.02 | -0.11 | 0.06 | -0.08 | -0.09 | 0.09 | 0.02 | -0.11 | 0.01 | -0.18 | -0.12 | -0.07 | 0.02 | 1.00 | 0.41 | 0.46 | -0.31 | -0.31 | -0.25 | -0.42 |
| action | LIC x SDC | -0.11 | -0.05 | -0.13 | -0.02 | -0.06 | -0.18 | 0.02 | -0.11 | -0.07 | -0.06 | -0.26 | 0.05 | 0.01 | 0.23 | 0.41 | 1.00 | 0.16 | -0.48 | -0.06 | -0.26 | -0.25 |
| LIC x RP | 0.06 | 0.04 | -0.06 | -0.06 | -0.05 | -0.16 | 0.17 | 0.19 | 0.01 | 0.12 | -0.01 | -0.26 | 0.01 | -0.04 | 0.46 | 0.16 | 1.00 | -0.22 | -0.37 | -0.31 | -0.59 | |
| SDC x Size of business | -0.03 | -0.01 | 0.12 | -0.04 | -0.07 | 0.12 | 0.02 | 0.06 | -0.04 | -0.01 | 0.00 | 0.02 | -0.05 | -0.02 | -0.31 | -0.48 | -0.22 | 1.00 | 0.46 | 0.66 | 0.61 | |
| Vari- | LIC x Size of business | 0.04 | 0.01 | 0.08 | -0.17 | 0.05 | -0.01 | 0.00 | 0.02 | 0.06 | 0.09 | -0.01 | 0.20 | 0.08 | 0.22 | -0.31 | -0.06 | -0.37 | 0.46 | 1.00 | 0.69 | 0.45 |
| ables | OSC x Size of business | 0.04 | 0.03 | 0.16 | -0.07 | 0.07 | 0.09 | 0.00 | -0.05 | -0.06 | -0.03 | -0.06 | 0.08 | -0.09 | 0.10 | -0.25 | -0.26 | -0.31 | 0.66 | 0.69 | 1.00 | 0.46 |
| RP x Size of business | -0.17 | 0.08 | 0.04 | -0.12 | 0.04 | 0.05 | 0.05 | -0.02 | 0.04 | 0.06 | 0.09 | 0.21 | 0.09 | 0.13 | -0.42 | -0.25 | -0.59 | 0.61 | 0.45 | 0.46 | 1.00 | |
| Note: All of the statistical value are rounded into 2 decimal digits. | ||||||||||||||||||||||
5.5 Hierarchical Regression Analysis (HR)
Hierarchical regression analysis showed a significant improvement in the variance explanation (R) of the dependent variable, “DSCF Platform Intention (DFIN).” In the basic model (Model 1), which consists of control variables such as organization size, position level, income, and respondent age, R was found to be 0.03, reflecting a low level of explanatory power. However, when adding independent variables from the dimensions of the TOE conceptual framework (Model 2), namely SDC, RP, LIC, OSC, CSP, NSP, and MSP which use the same set of variables as SEM for the conceptual model in Sections 5.1–5.3, the researchers found that the results of the hierarchical regression model gave consistent results, with R increasing to 0.75 and being statistically significant (p 0.00), and answered the 1st purpose of using HR by indicating that the model robustly explains the intention behavior to adopt a DSCF platform in an organization under the consideration of the sustainability context.
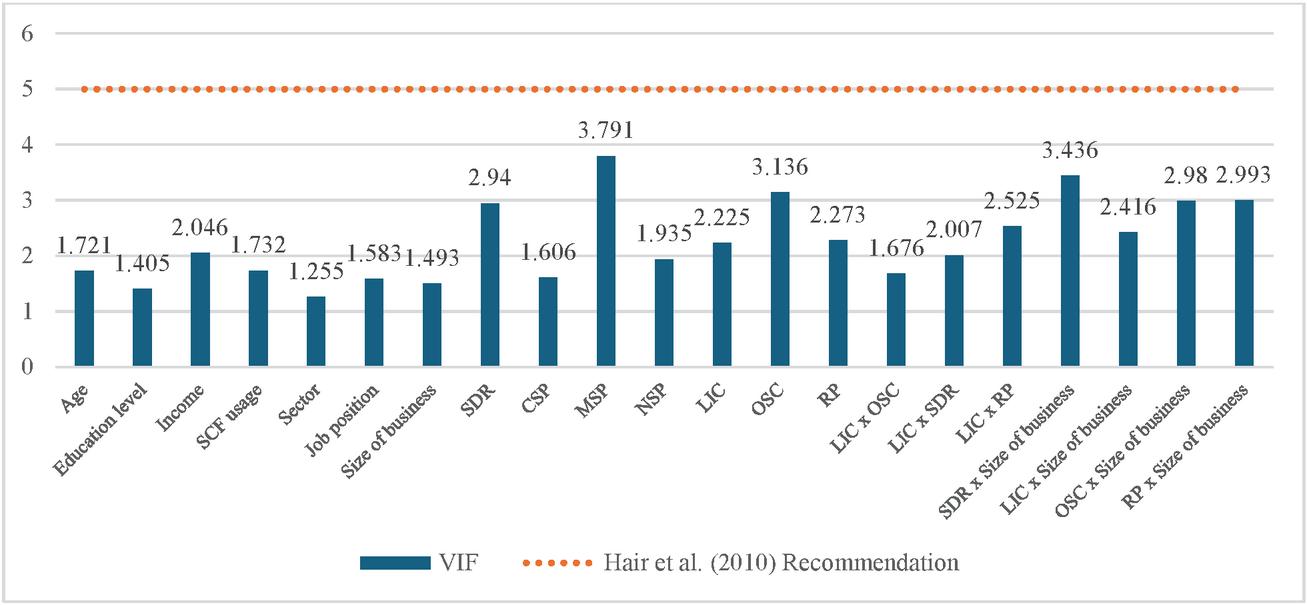
Figure 6 VIF according to the conditions of Hair et al., (2010).
5.6 Interaction Effect Analysis of Variables of the Hierarchical Regression Model
The main purpose of using hierarchical regression in this further study is to enhance the confidence in the results of the SEM analysis in Section 5.2 through stepwise testing to clearly demonstrate the contribution of each group of variables, confirming the appropriateness and robustness of the variables. It shows that the technology, organization, and environment variables from the TOE framework under the new variables such as RP, SDC, LIC, OSC, CSP, NSP and MSP, which are variables that combine sustainability and traditional concepts, have a significant effect even after controlling for the basic variables (Table 13 Model 2). Next, the interaction terms between variables in 2 dimensions are tested, consisting of the interaction of variables within the group of organizational and technology variables (Technology and organizational context), focusing on the variable of leaders’ innovation commitment (LIC) and business size (Size of business) to confirm the effect of the mechanism of one group of variables over the other, which reinforces the concept of “moderated effect” in the context of technology adoption behavior, which helps reveal The underlying mechanisms show that the main effect of technological, organizational, and environmental factors on DSCF adoption behavior is not always linear but may depend on contextual conditions.
Table 13 Summary of results of the nine hierarchical regression models
| Change Statistics | |||||||||||
| Adjusted | Std. | ||||||||||
| Model | R | R Square | Error of the | R Square | Sig. F | Durbin- | |||||
| Construction | Model | R | Square | (3 Decimal Digits) | Estimate | Change | F Change | df1 | df2 | Change | Watson |
| Control Model | 1 | .18 | 0.03 | 0.009 | 0.99 | 0.03 | 1.41 | 7 | 302 | 0.20 | |
| Original Model | 2 | .87 | 0.75 | 0.739 | 0.51 | 0.72 | 121.64 | 7 | 295 | 0.000 | |
| Interaction effect | 3 | .87 | 0.75 | 0.740 | 0.51 | 0.00 | 1.89 | 1 | 294 | 0.18 | |
| 4 | .88 | 0.77 | 0.761 | 0.490 | 0.021 | 26.809 | 1 | 293 | 0.00 | ||
| 5 | .88 | 0.77 | 0.764 | 0.49 | 0.004 | 5.19 | 1 | 292 | 0.02 | ||
| 6 | .88 | 0.78 | 0.768 | 0.48 | 0.004 | 5.48 | 1 | 291 | 0.02 | ||
| 7 | .88 | 0.78 | 0.768 | 0.48 | 0.001 | 0.80 | 1 | 290 | 0.37 | ||
| 8 | .88 | 0.78 | 0.767 | 0.48 | 0.000 | 0.41 | 1 | 289 | 0.52 | ||
| 9 | .88 | 0.78 | 0.766 | 0.48 | 0.000 | 0.15 | 1 | 288 | 0.70 | 1.82 | |
| a. Predictors: (Constant), size of business, Job position, Sector, Education level, Age, SCF usage, Income b. Predictors: (Constant), Model 1 with SDC, LIC, CSP, NSP, RP, OSC, MSP c. Predictors: (Constant), Model 2 with LIC x OSC d. Predictors: (Constant), Model 3 with LIC x SDC e. Predictors: (Constant), Model 4 with LIC x RP f. Predictors: (Constant), Model 5 with SDC x size of business g. Predictors: (Constant), Model 6 with LIC x size of business h. Predictors: (Constant), Model 7 with OSC x size of business i. Predictors: (Constant), Model 8 with RP x size of business j. Dependent Variable: DFINNote: All of the statistical value are rounded into 2 decimal digits except R adj. |
|||||||||||
From Table 13, it was found that the increase in the R adj. with 3 decimal digits value occurred continuously from Model 1 to Model 2 (Original model). This result is consistent with the structural model (SEM) in Section 5.2, which answers the first question of using Hierarchical Regression to study the consistency of the model and variables between the two study methods. For the ability to explain the model by studying the Interaction effect, it was found that Model 2 had an R adj. of 0.74. After adding the Interaction effect variable, Model 6 had an R adj. value that increased to 0.77, which is statistically significant, supporting evidence that the synergy between organizational and technological dimensions will significantly promote the intention to use digital systems for sustainability. However, the Interaction effect yield no benefit to R adj in Models 7–9, although it slightly increased the R adj, was not statistically significant, reflecting that the additional variables did not help the model to explain the additional dependent variables.
Table 14 Compares the significance levels of each model for the Interaction effects analysis
| Model | Standardized Coefficients Beta & t-stat | |||||||||
| Type | Construct | 1 | 2 | 3 | 4 | 5 | 6 | 7 | 8 | 9 |
| Control | Age | 0.05 (0.77) | 0.01 (0.16) | 0.00 (0.10) | 0.00 (0.04) | 0.01 (0.33) | 0.00 (0.08) | 0.00 (0.02) | 0 (0.01) | 0.00 (0.06) |
| Education level | 0.07 (1.03) | 0.02 (0.64) | 0.02 (0.70) | 0.03 (0.88) | 0.03 (1.03) | 0.03 (0.90) | 0.03 (0.94) | 0.031 (0.95) | 0.03 (0.99) | |
| Income | 0.08 (0.98) | 0.00 (0.18) | 0 (0.00) | 0.01 (0.30) | 0.02 (0.50) | 0.01 (0.23) | 0.01 (0.26) | 0.01 (0.33) | 0.01 (0.35) | |
| SCF Usage | 0.19** (2.79) | 0.00 (0.11) | 0.00 (0.03) | 0.01 (0.16) | 0.01 (0.35) | 0.02 (0.69) | 0.02 (0.61) | 0.02 (0.64) | 0.02 (0.63) | |
| Sector | 0.07 (1.11) | 0.09** (2.86) | 0.09*** (2.93) | 0.09*** (3.23) | 0.10*** (3.54) | 0.12*** (3.85) | 0.12*** (3.90) | 0.12*** (3.94) | 0.12*** (3.88) | |
| Job position | 0.00 (0.05) | 0.04 (1.16) | 0.04 (1.22) | 0.02 (0.52) | 0.03 (0.84) | 0.02 (0.66) | 0.02 (0.57) | 0.02 (0.58) | 0.02 (0.59) | |
| Size of business | 0.05 (0.74) | 0.02 (0.72) | 0.02 (0.55) | 0.02 (0.69) | 0.02 (0.49) | 0.02 (0.47) | 0.02 (0.48) | 0.02 (0.47) | 0.01 (0.43) | |
| Original | SDC | 0.28*** (6.40) | 0.28*** (6.51) | 0.35*** (7.98) | 0.39*** (8.33) | 0.40*** (8.59) | 0.40*** (8.63) | 0.40*** (8.64) | 0.40*** (8.52) | |
| CSP | 0.091** (2.52) | 0.09** (2.39) | 0.07** (2.01) | 0.06* (1.86) | 0.06* (1.66) | 0.06 (1.60) | 0.06 (1.60) | 0.05 (1.60) | ||
| MSP | 0.07 (1.36) | 0.09 (1.57) | 0.13** (2.41) | 0.15*** (2.74) | 0.15*** (2.86) | 0.15*** (2.84) | 0.15*** (2.86) | 0.15*** (2.87) | ||
| NSP | 0.08** (2.09) | 0.07* (1.80) | 0.09** (2.40) | 0.08** (2.18) | 0.07* (1.76) | 0.07* (1.79) | 0.07* (1.78) | 0.07* (1.80) | ||
| LIC | 0.12*** (3.14) | 0.12*** (2.98) | 0.11*** (2.83) | 0.07* (1.80) | 0.07* (1.78) | 0.07* (1.75) | 0.07* (1.67) | 0.07* (1.66) | ||
| OSC | 0.22*** (4.42) | 0.22*** (4.33) | 0.17*** (3.52) | 0.18*** (3.65) | 0.17*** (3.59) | 0.17*** (3.53) | 0.17*** (3.63) | 0.18*** (3.64) | ||
| RP | 0.29*** (7.71) | 0.29*** (7.66) | 0.22*** (5.53) | 0.19*** (4.79) | 0.20*** (4.87) | 0.19*** (4.65) | 0.19*** (4.52) | 0.19** (4.53) | ||
| Inter- | LIC x OSC | 0.04 (1.36) | 0.12*** (3.52) | 0.09** (2.56) | 0.10*** (2.80) | 0.09*** (2.65) | 0.10*** (2.70) | 0.10*** (2.73) | ||
| action | LIC x SDC | 0.18*** (5.18) | 0.19*** (5.46) | 0.15*** (4.1) | 0.15*** (3.85) | 0.15*** (3.90) | 0.15*** (3.90) | |||
| Effect | LIC x RP | 0.08** (2.28) | 0.09** (2.56) | 0.09** (2.32) | 0.09** (2.32) | 0.10** (2.21) | ||||
| SDC x size of business | 0.08** (2.34) | 0.09** (2.49) | 0.11** (2.50) | 0.10* (1.89) | ||||||
| LIC x size of business | 0.03 (0.89) | 0.02 (0.40) | 0.02 (0.42) | |||||||
| OSC x size of business | 0.03 (0.64) | 0.03 (0.61) | ||||||||
| RP x size of business | 0.02 (0.39) | |||||||||
| Sig. F Change | 0.20 | 0*** | 0.18 | 0*** | 0.02** | 0.02** | 0.37 | 0.52 | 0.70 | |
| Observation | 310 | 310 | 310 | 310 | 310 | 310 | 310 | 310 | 310 | |
| Note: ***Significant at: p 0.01; t 2.576, **Significant at: p 0.05; t 1.96 *Significant at: p 0.1; t 1.645, all of the statistical value are rounded into 2 decimal digits. | ||||||||||
| a. Dependent Variable: DFIN. | ||||||||||
For the analysis of interaction variables by hierarchical regression under the TOE framework, the objective was to examine whether the relationship between each independent variable and the intention to adopt the sustainable DSCF platform (DFIN) was influenced by other factors. By examining the mechanism in the form of moderation that may occur between variables in different dimensions, it is necessary to delve deeper into the explanatory ability of the models when the interaction term was added. From Table 13, the model that performed the best statistically was Model 6, which was the model that added the interaction variable of leadership role and business size, which yielded the results as shown in Table 14, giving the highest Adjusted R value of 0.77 and a statistically significant Sig. F Change (p 0.05), indicating that the addition of this interaction variable significantly improved the model’s ability to explain the respondent’s behavior. From the results in Model 6, the researchers were able to summarize the results of the study on the interaction of variables into 2 dimensions: 1. Dimension of the role of innovation leadership The interaction between leadership and other organizational and technology variables, although significantly enhances the explanatory power of Model 6, is negatively correlated. The regression coefficient of LIC x OSC (Leadership Innovation Commitment Organizational Sustainability Capability) for the role of innovation leadership is (p 0.00), indicating a “moderated buffering effect” mechanism. Namely, when an organization has high sustainability capability, the impact of leadership commitment on sustainability is reduced, indicating a substitutable role between the two structural components within an organization. This is consistent with the role of innovation leadership and trust in the digital trade finance platform or LIC x RP (Leadership Innovation Commitment Reliability in Platform), with the direction of the regression coefficient of the LIC x RP variable being (p 0.05). On the other hand, the interaction effect of innovation leadership and organization’s digital readiness or LIC x SDC (Leadership Commitment Strategic Digitalization Readiness) gives a statistically significant regression coefficient of LIC x SDC (, p 0.001) and is positively correlated. This result reflects that the role of leadership in DSCF platform adoption will be more effective if the organization focuses on strategic digital readiness. While the factors of trust on the platform and the role of innovation leadership do not significantly drive the adoption of DSCF platforms. In terms of sustainability potential and the role of organization’s innovation leadership do not support the adoption of digital trade finance platforms as there may be other tools. To increase organizational sustainability more than accepting DSCF platforms alone, in the second dimension, the interaction of business size and organization’s digital readiness, from Model 6, it was found that Size of Business x SDC has a negative relationship and a statistically significant regression coefficient of Size x SDC (, ), reflecting a lower intention to accept a DSCF platform if the organization’s size is large despite having a high level of organization’s digital readiness. Although other interaction terms in Models 7–9 are significant in some variables, they are not significant at the statistical significance level (Sig. F Change) (p 0.10). As a result, it cannot be concluded that the overall model is significantly improved by adding such interaction terms. Therefore, in terms of selection, Model 6 is still the most appropriate. In summary, the results of the interaction effect analysis indicate that the relationship between the variables in the TOE framework and the intention to use the DSCF system is not linear. However, the nature of the relationship is conditional, reflecting a clear moderation mechanism, particularly in the case of innovation leadership and digital readiness of organizations that influence the adoption of digital trade finance platforms. Identifying these key interacting factors has implications for formulating appropriate strategic policies for organizations aiming to drive sustainable transformation with digital technologies.
6 Discussion and Policy Recommendations
6.1 Discussion
The results of this research are based on the analysis using Structural Equation Modeling (SEM) under the TOE framework, which has been developed to be consistent with the context of the application of digital technology adoption for sustainability. This concept of sustainability is systematically integrated into each element of the TOE framework, such as the design of organizational variables that emphasize the organization’s sustainability concern and the commitment of leaders to driving innovation that is socially and environmentally responsible. This is consistent with the proposal of Ramesh Sharda [12] who proposed that the TOE framework can be expanded to cover contemporary strategic factors such as sustainability, resilience, and organizational learning. It is also consistent with Hsu, et al. [82] who proposed that technology decisions in organizations must consider the impact of external environmental factors and internal structures that have specific characteristics.
The results of this study from the whole construction of PLS-SEM with TOE integrating with sustainability can explain DFIN in organizational intention to adoption considered high. When we deep-dive into the result closely, the technology aspect, which uses the different types of variables by changing from the original of TOE framework into SDC and RP both exhibit the highest positive impact to DFIN around 0.28 – 0.29, illuminating that the importance of strategic digitalization competence is important and technology adoption should match with organization’s goal in the long run [83] because digital transformation does not happen in one night, but it took a time to build up both capital and man-hours like the previous study [17]. Additionally, platform reliability still plays an important part in hinting at organizational decisions to make the platform easier to use, which means security and trust in the platform need to be prioritized first when considering technology adoption [4, 7]. While the 2nd high influence to DFIN comes from organization context by OSC and LIC which reflects the motivation of organizational intention to use the DSCF platform involved with organizational sustainability capability also. Because digital transformation by using technology directly reduces waste and paper usage [27]. While LIC or leader’s innovation commitment, also takes a crucial role for pushing the organization forward to accept the innovation and new technology due to the authority power to create a favorable environment, guidance, participation encouragement, and especially resource allocation [31]. The last and least influential context in this study is environment, which integrates institutional theory with the sustainability context. CSP, or coercive sustainability pressure show a slightly positive impact on DFIN because Thailand’s regulator start to implement some of the rules and laws with a sustainability perspective, like green bonds, ESG scoring, and green finance, rather than enforcing the use of technology for sustainability, while normative sustainability pressure, or NSP reflect norm of society’s perspective on organization sustainability, also shows a slightly positive impact to DFIN which consistency with CSP for the same reason, because currently regulator enforce strategy “positive covenant” to reward organization with sustainability in different way like lower financing cost, easy to funding to secondary capital market and etc. The one and only variable not impacting DFIN is MSP or mimetic sustainability pressure, due to the nature of DFIN as a supportive platform to enhance capacity in both economic and sustainability ways. However, in terms of competitive advantage, it might be insignificant due to DFIN only supporting tools for organizations in many ways to improve their competitive advantage in Thailand.
To close the TOE conceptual model with SEM analysis, the author conducts hierarchical regression to validate the robustness of the model and interaction effect. Practically speaking, an organization’s digital transformation could manifest as a “synergy” between two factors, rather than occurring individually. This part of the discussion, we will be using the result from the 6th model from the HR result because it provides the highest adjusted R-squared. The synergy we extract from the result is LIC x SDC or the synergy between the leader’s innovation commitment and strategic digitalization competence. This synergy indicates the important role of the leader’s innovation commitment with the strategy for digitalization positively reinforcing the intention to adopt the DSCF platform due to innovative leadership being the core of a system that facilitates knowledge development and sustainable change [84] and the ability of leaders to establish strategic innovation directions is crucial for the long-term survival of the organization [85]. This highlights that adopting technology from an organizational perspective serves not only to gain technological advantages but also to address sustainability concerns, while internal factors, such as leadership and the organization’s capacity for sustainability, are key to accelerating digital transformation.
Table 15 Comparison with previous literatures
| References | |||||
| with | |||||
| Path | References with | Negative | |||
| Hypotheses | Relationship | Decision | Coef. | Positive Coef. | Coef. |
| H1a | SDC DFIN | Supported*** | + | [28–30, 39] | |
| H1b | RP DFIN | Supported*** | + | [27, 29, 30, 32–34, 39] | [28] |
| H2a | LIC DFIN | Supported** | + | [24, 27–31, 41] | |
| H2b | OSC DFIN | Supported*** | + | [27, 30] | |
| H3a | CSP DFIN | Supported** | + | [21, 27, 31, 41] | |
| H3b | MSP DFIN | Not Supported | + | [21, 23, 24, 31, 32] | [29, 41] |
| H3c | NSP DFIN | Supported** | + | [28, 30] | |
| Source: Author literature review. | |||||
6.2 Comparison with Prior Literatures
In conclusion, the adoption of technology for sustainability is not driven by technological factors alone, but by a holistic interplay of technical, organizational, and environmental contexts. The research identifies strategic digitalization competence and platform reliability as the most critical technological drivers. Internally, leader’s innovation commitment and the organization’s sustainability concern are highly influential. Crucially, the study reveals a powerful “synergy” between a leader’s commitment to innovation and the organization’s strategic digitalization competence, indicating that digital transformation is most successful when visionary leadership and a robust digital strategy work in tandem to drive the organization toward both economic and sustainability goals.
Most of this study’s results are consistent with the previous study in the past for both statistical significance and direction of coefficients, which we have already mentioned in Section 6.1. However, some of the literature provides different directions of coefficients from this research and is worth discussing. The first difference, H1b, arises from a study referenced as [28], which examines social commerce acceptance among SMEs in Saudi Arabia. The author analyzes the difference in the technology variable context in RP to the variable from the previous study, which found that the questionnaire asked about the concern of legal and law on using the platform rather than focusing on security and reliability in the platform, and 2/3 of respondents had already adopted social commerce platforms, while in this study, most of the respondents had still not adopted DSCF platforms. Another difference is that H3b provides positive coefficient direction even though it’s insignificant, which is different from the previous studies [29, 41]. The differences can be attributed to two main factors. 1st the previous studies questionnaire in term of mimetic pressure focus only competitive environment while the author’s MSP concentrated on sustainability, 2nd come from the different of technology use case for study, prior study focus on CRM and E-commerce adoption which impact all over organization while this research scope only DSCF Platform which involve with procurement, management and logistic department.
6.3 Theoretical Recommendations
This research presents a new conceptual framework that is further developed from the TOE framework. It is outstanding in its integration of the “sustainability” dimension into all elements of the model, including technology, organization, and environment, which is an approach that is still rare in current literature. Although TOE is a flexible framework that has been widely applied, most of them still focus on studying only performance factors or acceptance of technology dimensions, neglecting the sustainability context that influences organizational decision-making in the ESG (Environmental, Social, Governance) economy era [18, 19].
This study supports the traditional belief that the benefit of technology adoption should be prioritized. However, from integrating sustainability and adapting variables to matching nature of DSCF platform, we’ve found that not only relative advantage for study technology adoption in organization using TOE theory is not enough but reliability of technology is also important due to financial technology is all about creating trust between user (credit risk) and platform (security risk) [55] which improve the intention to adoption financial technology, consistent with previous research [27] which initiating trust in the platforms and among strangers is a critical issue for the technology adoption while the another factor should prioritize is digital strategy for organization also, especially sustainable technology adoption.
The other clues for this study provide additional insight into the leadership role and organizational sustainability capability, which fall under the organizational aspect in TOE. The leader innovation commitment is to explicitly push the organization forward to accept innovation consistent with a previous study [84], while leader innovation could work really effectively by synchronizing with the strategic digitalized competence of the long-term organization and also leveraging the pace of sustainable technology adoption as well as the work of [85]. The Organizational Sustainability Capability emphasizing adaptation of projects can lead to beneficial financial outcomes. Furthermore, this capability enhances a firm’s competitive potential, which further improves business performance. Ultimately, by investing in sustainability, companies can improve their long-term success and secure a legitimate position in the minds of stakeholders, which is consistent with the previous study [59, 61].
The last but not least, environmental context for TOE theory is an important external factor that pushes organizations to accept innovation. Therefore, the author also integrates sustainability into external pressure from institutional theory, which results in not being consistent with the previous study, especially in mimetic pressure as mentioned in Section 6.2 [29, 60]. However, the rest of the pressure still supports the intention to adopt the platform because the Thai regulator started promoting sustainability practices with a “positive covenant” and let organizations comply in the last couple of years, which is a result consistent with the previous study [50]. This meant legal and law play an important role in forcing organizations to adapt and accept sustainability practices into their strategic roadmap [59, 61], while in terms of normative pressure driven by stakeholders, it is obviously important as well as coercive pressure to push organizations to accept sustainable technology adoption. This paper focuses on stakeholders such as employees, customers, counterparties, and society to reflect the concept of industry 4.0, which in turn indicates that the consideration of technology acceptance reveals a broader range of pressures from sustainability perspectives to achieve not only economic goals but also stakeholder goals.
Overall, this research contributes three theoretical insights to the academic community: (1) it proposes a TOE model with sustainability dimensions embedded in the structural level of variables; (2) it provides a mechanistic understanding of how external pressures and internal organizational capabilities interact to promote technology adoption; and (3) it extends the scope of TOE to be appropriate for the Industry 4.0 era, which emphasizes the balance between innovation and sustainability, which is a valuable approach for studying technology in developing countries.
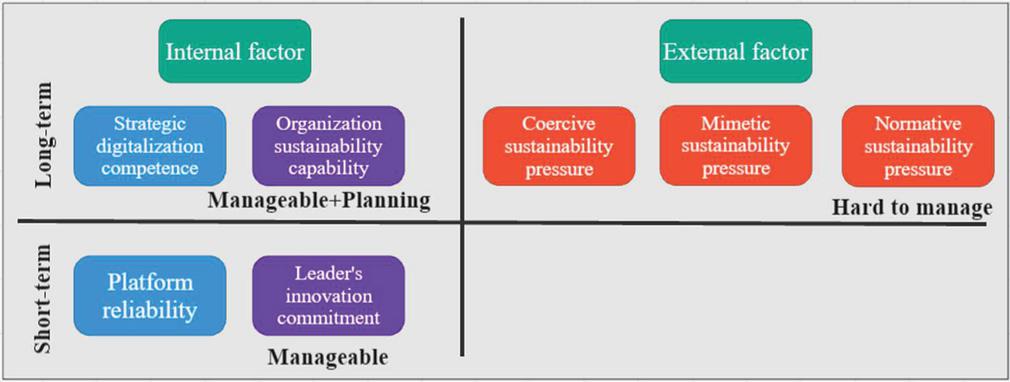
Figure 7 Prioritization for managerial.
Source: Author.
6.4 Managerial Recommendations
From a managerial perspective, this research provides priorities for handling sustainable technology adoption solutions. The author categorizes the factor into 2 groups: internal and external factors. Management should prioritize internal factors first due to the authority to control and manageable power [31], while external factors are only used to determine the proper context of organizational strategy in both short- and long-term perspectives. First, for the big picture and long term, management should set their focus on the long-term perspective by measuring where the organization should go in the next era and creating digitalization strategies to improve organizational competence and sustainability capabilities to enhance its competitive edge. Second, for the short term, leaders will become important to drive the overall strategy and organizational competence to move forward along with the organizational digitalization strategic plan by creating appropriate resources and environments to support sustainable technology adoption, while the technology that the organization chooses to use to close the short term and long term should give stakeholders trust, security, and reliability [4, 7].
6.5 Policy Recommendations
The policymaker’s perspective may differ from that presented in Section 6.4 because of the influence of higher authority. The author categorized the policy recommendations into long-term and short-term strategies. For the long-term policy, policymakers should focus on supporting digitalization infrastructure for business because the primary barrier to technology adoption is the access of digital infrastructure, especially in emerging countries [86]. Therefore, the government should establish a central digital infrastructure (Digital Infrastructure Hub), such as a platform that connects data between DSCF service providers and regulators, to build trust and reduce data security risks, which could improve intention to adopt the DSCF Platform [4, 7]. While amplifying the current strategy “positive covenant” by incentivizing the private sector using tax credits for digital transformation for sustainability investment. Evidently, from 2023 – 2024 company in the stock exchange of Thailand started to adopt ESG to lower their funding cost by new regulation or subsidies to businesses that introduce digital trade finance platforms, along with Green Procurement or ESG-based Financing policies to promote the adoption of technologies in sustainable supply chains [8, 10].
For short-term policy, budget and policy support for access to DSCF platforms for small and medium-sized enterprises are still not in place in the country. However, policy maker should categorize type of readiness of corporate and private sector , by categorize into organizations sustainable capability and strategic digitalization competence like Figure 8. The government should use budget and policy to support the blue area first because the readiness of organizations for sustainable digital transformation is high but they need a little push from the regulator by motivate management in the missing area like sustainability-focus organization need to incentivize them by supporting them how adoption technologies could improve their sustainability capability in the long term. While in the red zone most are SMEs, indicated by low competence and capability to do sustainable digital transformation, which need more time and policy to invest in the future due to lack of infrastructure, resources, and knowledge.
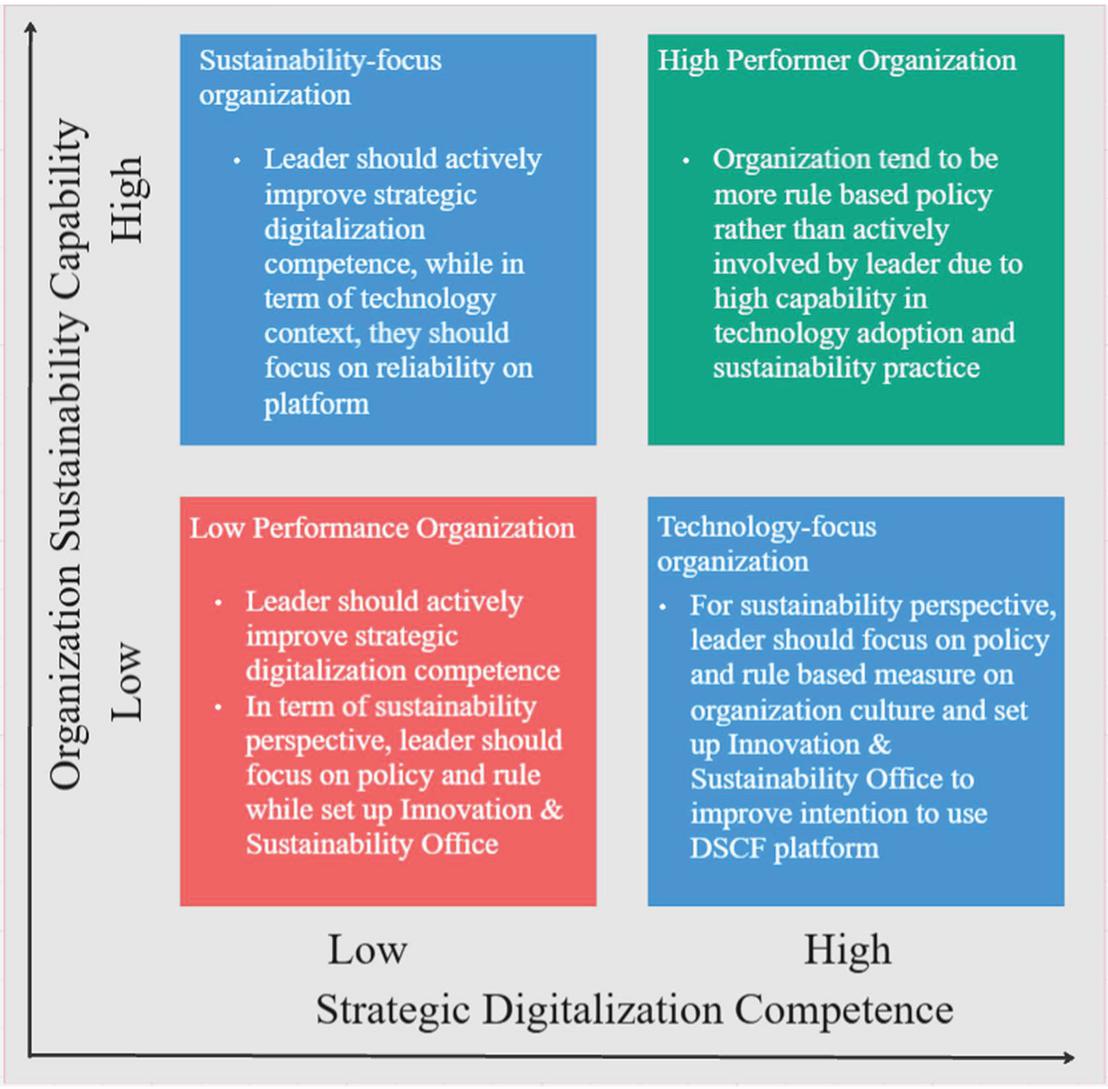
Figure 8 Summary of the approaches and roles of leaders on the intention to use DSCF platforms.
Source: Author.
7 Conclusion, Limitations, and Research Directions
7.1 Conclusion
This study set out to explain why some organizations in emerging economies embrace Digital Supply Chain Finance (DSCF) while others hold back. By combining the TOE framework with Institutional Theory and a sustainability lens, we found that technology readiness and organizational capability are the real game-changers more influential than external pressure alone. Yet, when industry norms and regulations align with sustainability-oriented leadership, adoption becomes not just faster but also more purposeful. The message is clear, the DSCF platform is more than a tool for efficiency. It can be a catalyst for building resilient, future-ready supply chains that deliver financial, social, and environmental value. For managers, that means investing in digital capability and agile processes. For policymakers, it means shaping incentives and standards that make sustainable finance the obvious choice.
In bridging fragmented perspectives from past studies, this research offers a practical, evidence-based roadmap for leveraging DSCF as a strategic enabler in the Industry 4.0 era turning financial innovation into long-term advantage.
7.2 Research Limitations
Although this research attempts to create a conceptual model that covers important dimensions of modern organizational behavior, and the financial technologies studied are financial activity that have been familiar with the Thai economic system for a long time, but the investment by the business sector and digital infrastructure are still limitations. Therefore, there are some research limitations that should be considered in interpreting the results and applying them, which consist of 3 aspects:
Limitations of the data sampling: The sample group of this research focuses on experts from organizations in Thailand that are familiar with the supply chain finance. As a result, the ability to explain or compare the results with foreign contexts may be limited and exhibit some bias. So the application of this concept to developed countries may require further adjustments to the conceptual model.
Variable limitations: Although the variables that cover the TOE framework are selected, there are still other latent variables that may influence technology adoption, such as trust in the digital financial system, structural government support, or learning of operational users, which may increase the accuracy of the model in the future. However, the challenge is that integrating sustainability into the questionnaire might need to be improved to reflect a better understanding for respondents.
Theory construction limitations: while the integrated TOE–Institutional–Sustainability framework offers a comprehensive view, other theoretical perspectives (e.g., Resource-Based View, Dynamic Capabilities) could further enrich the analysis. Future research should address these gaps by applying longitudinal and cross-country designs, integrating multiple data sources, and testing the model in diverse industrial contexts.
7.3 Future Research Directions
Given the aforementioned limitations, future research can be further developed in the following ways:
First, the next research should focus on comparing both benefits and costs to consider sustainable technology adoption from an organizational perspective, which could give us a different perspective.
Second, from the variable perspective, to study sustainability with institutional theory might require testing between separating the original variables compared to the new integrated variables.
References
[1] I. Hidayat-ur-Rehman and M. N. Hossain, “The impacts of Fintech adoption, green finance and competitiveness on banks’ sustainable performance: digital transformation as moderator,” Asia-Pacific Journal of Business Administration, 2024, doi: 10.1108/APJBA-10-2023-0497.
[2] A. Al-Okaily, “Financial innovation: predicting determinants of blockchain technology adoption and its impact on financial firms performance,” International Journal of Innovation Science, 2025, doi: 10.1108/IJIS-08-2024-0221.
[3] G. Li, J. Xue, N. Li, and Q. Qi, “Does digital finance favor firms in supply chains? Roles of green innovation and bargaining power,” Transportation Research Part E: Logistics and Transportation Review, vol. 183, p. 103431, 2024/03/01/ 2024, doi: 10.1016/j.tre.2024.103431.
[4] Y. Gong, Z. Tianyu, D. Peiwu, C. Xiangfeng, and Y. and Shi, “Innovation adoption of blockchain technology in supply chain finance,” Production Planning & Control, vol. 35, no. 9, pp. 992–1008, 2024/07/03 2024, doi: 10.1080/09537287.2022.2155564.
[5] DEPA, Thailand digital technology foresight 2035. Thailand: DEPA, 2020.
[6] W. S. K. Weerabahu, P. Samaranayake, D. Nakandala, and H. Hurriyet, “Digital supply chain research trends: a systematic review and a maturity model for adoption,” Benchmarking: An International Journal, vol. 30, no. 9, pp. 3040–3066, 2023, doi: 10.1108/BIJ-12-2021-0782.
[7] W. Wang, Y. Chen, Y. Wang, M. Deveci, A. Al-Hinai, and S. Kadry, “Analyzing the barriers to blockchain adoption in supply chain finance using an integrated interval-valued Fermatean fuzzy RAFSI model,” Financial Innovation, vol. 11, no. 1, p. 9, 2025, doi: 10.1186/s40854-024-00670-y.
[8] IFC, Handbook – Technology and Digitization in Supply-Chain Finance. Washington: IFC, 2020.
[9] W. C. o. Environment and Development, Our Common Future. Oxford University Press, 1990.
[10] P. K. Singh and S. W. Chan, “The Impact of Electronic Procurement Adoption on Green Procurement towards Sustainable Supply Chain Performance-Evidence from Malaysian ISO Organizations,” Journal of Open Innovation: Technology, Market, and Complexity, vol. 8, no. 2, p. 61, 2022/06/01/ 2022, doi: 10.3390/joitmc8020061.
[11] L. Jum’a, M. Ikram, and C. Jose Chiappetta Jabbour, “Towards circular economy: A IoT enabled framework for circular supply chain integration,” Computers & Industrial Engineering, vol. 192, p. 110194, 2024/06/01/ 2024, doi: 10.1016/j.cie.2024.110194.
[12] S. V. Ramesh Sharda, Integrated Series in Information Systems. Springer International Publishing, 2012.
[13] V. Venkatesh and F. D. Davis, “A theoretical extension of the technology acceptance model: Four longitudinal field studies,” Management science, vol. 46, no. 2, pp. 186–204, 2000, doi: 10.2307/30036540.
[14] V. Venkatesh, M. G. Morris, G. B. Davis, and F. D. Davis, “User Acceptance of Information Technology: Toward a Unified View,” MIS Quarterly, vol. 27, no. 3, pp. 425–478, 2003, doi: 10.2307/30036540.
[15] E. M. Rogers, Diffusion of Innovations, 5th Edition. Free Press, 2003.
[16] L. G. Tornatzky, M. Fleischer, and A. K. Chakrabarti, The Processes of Technological Innovation. Lexington Books, 1990.
[17] T. Oliveira and M. F. Martins, “Literature review of information technology adoption models at firm level,” Electronic journal of information systems evaluation, vol. 14, no. 1, pp. 110–121, 2011.
[18] R. Chaudhuri, B. Singh, A. K. Agrawal, S. Chatterjee, S. Gupta, and S. K. Mangla, “A TOE-DCV approach to green supply chain adoption for sustainable operations in the semiconductor industry,” International Journal of Production Economics, vol. 275, p. 109327, 2024/09/01/ 2024, doi: 10.1016/j.ijpe.2024.109327.
[19] T. H. Nguyen, X. C. Le, and T. H. L. Vu, “An Extended Technology-Organization-Environment (TOE) Framework for Online Retailing Utilization in Digital Transformation: Empirical Evidence from Vietnam,” Journal of Open Innovation: Technology, Market, and Complexity, vol. 8, no. 4, p. 200, 2022/12/01/ 2022, doi: 10.3390/joitmc8040200.
[20] B.-N. Hwang, C.-Y. Huang, and C.-H. Wu, “A TOE approach to establish a green supply chain adoption decision model in the semiconductor industry,” Sustainability, vol. 8, no. 2, p. 168, 2016, doi: 10.3390/su8020168.
[21] A. Katebi, P. Homami, and M. Najmeddin, “Acceptance model of precast concrete components in building construction based on Technology Acceptance Model (TAM) and Technology, Organization, and Environment (TOE) framework,” Journal of Building Engineering, vol. 45, p. 103518, 2022/01/01/ 2022, doi: 10.1016/j.jobe.2021.103518.
[22] K. Ofosu-Ampong and B. Acheampong, “Adoption of contactless technologies for remote work in Ghana post-Covid-19: Insights from technology-organisation-environment framework,” Digital Business, vol. 2, no. 2, p. 100023, 2022/01/01/ 2022, doi: 10.1016/j.digbus.2022.100023.
[23] A. Katebi and M. Tehrani, “Adoption of AI in construction design: Insights from UTAUT2 and TOE frameworks,” Results in Engineering, vol. 26, p. 104981, 2025/06/01/ 2025, doi: 10.1016/j.rineng.2025.104981.
[24] H.-F. Lin, “Understanding the determinants of electronic supply chain management system adoption: Using the technology–organization–environment framework,” Technological Forecasting and Social Change, vol. 86, pp. 80–92, 2014/07/01/ 2014, doi: 10.1016/j.techfore.2013.09.001.
[25] M. Akter, T.-F. Kummer, and O. Yigitbasioglu, “Looking beyond the hype: The challenges of blockchain adoption in accounting,” International Journal of Accounting Information Systems, vol. 53, p. 100681, 2024, doi: 10.1016/j.accinf.2024.100681.
[26] N. Nguyen, T. Dang-Van, T. Vo-Thanh, H.-N. Do, and S. Pervan, “Digitalization strategy adoption: The roles of key stakeholders, big data organizational culture, and leader commitment,” International Journal of Hospitality Management, vol. 117, p. 103643, 2024/02/01/ 2024, doi: 10.1016/j.ijhm.2023.103643.
[27] S. H.-W. Chuah, M.-L. Tseng, K.-J. Wu, and C.-F. Cheng, “Factors influencing the adoption of sharing economy in B2B context in China: Findings from PLS-SEM and fsQCA,” Resources, Conservation and Recycling, vol. 175, p. 105892, 2021/12/01/ 2021, doi: 10.1016/j.resconrec.2021.105892.
[28] S. S. Abed, “Social commerce adoption using TOE framework: An empirical investigation of Saudi Arabian SMEs,” International Journal of Information Management, vol. 53, p. 102118, 2020, doi: 10.1016/j.ijinfomgt.2020.102118.
[29] F. Cruz-Jesus, A. Pinheiro, and T. Oliveira, “Understanding CRM adoption stages: empirical analysis building on the TOE framework,” Computers in Industry, vol. 109, pp. 1–13, 2019/08/01/ 2019, doi: 10.1016/j.compind.2019.03.007.
[30] L. Lu, C. Liang, D. Gu, Y. Ma, Y. Xie, and S. Zhao, “What advantages of blockchain affect its adoption in the elderly care industry? A study based on the technology–organisation–environment framework,” Technology in Society, vol. 67, p. 101786, 2021/11/01/ 2021, doi: 10.1016/j.techsoc.2021.101786.
[31] S. Gupta, W. Ghardallou, D. K. Pandey, and G. P. Sahu, “Artificial intelligence adoption in the insurance industry: Evidence using the technology–organization–environment framework,” Research in International Business and Finance, vol. 63, p. 101757, 2022/12/01/ 2022, doi: 10.1016/j.ribaf.2022.101757.
[32] H. Ahmadi, M. Nilashi, L. Shahmoradi, and O. Ibrahim, “Hospital Information System adoption: Expert perspectives on an adoption framework for Malaysian public hospitals,” Computers in human behavior, vol. 67, pp. 161–189, 2017, doi: 10.1016/j.chb.2016.10.023.
[33] O. Alsetoohy, B. Ayoun, S. Arous, F. Megahed, and G. Nabil, “Intelligent agent technology: what affects its adoption in hotel food supply chain management?,” Journal of Hospitality and Tourism Technology, vol. 10, no. 3, pp. 286–310, 2019, doi: 10.1108/JHTT-01-2018-0005.
[34] A. Abdurrahman, “Investigating the impact of digital business ecosystem in enhancing Islamic mobile banking adoption through the TOE framework,” Digital Business, vol. 4, no. 2, p. 100096, 2024, doi: 10.1016/j.digbus.2024.100096.
[35] A. Alnoor, S. Abbas, A. M. Sadaa, X. Chew, and G. E. Bayram, “Navigating the power of blockchain strategy: Analysis of technology-organization-environment (TOE) framework and innovation resistance theory using PLS-SEM and ANN insights,” Technological Forecasting and Social Change, vol. 214, p. 124044, 2025, doi: 10.1016/j.techfore.2025.124044.
[36] B. T. Assaye et al., “Readiness of big health data analytics by technology-organization-environment (TOE) framework in Ethiopian health sectors,” Heliyon, vol. 10, no. 19, 2024, doi: 10.1016/j.jbusres.2015.12.001.
[37] T. N. Huynh, P. Van Nguyen, Q. N. Nguyen, and P. U. Dinh, “Technology innovation, technology complexity, and co-creation effects on organizational performance: The role of government influence and co-creation,” Journal of Open Innovation: Technology, Market, and Complexity, vol. 9, no. 4, p. 100150, 2023/12/01/ 2023, doi: 10.1016/j.joitmc.2023.100150.
[38] A. B. N’Dri and Z. Su, “Successful configurations of technology–organization–environment factors in digital transformation: Evidence from exporting small and medium-sized enterprises in the manufacturing industry,” Information & Management, vol. 61, no. 7, p. 104030, 2024/11/01/ 2024, doi: 10.1016/j.im.2024.104030.
[39] P. M. L. Ng, K. K. Lit, and C. T. Y. Cheung, “Remote work as a new normal? The technology-organization-environment (TOE) context,” Technology in Society, vol. 70, p. 102022, 2022/08/01/ 2022, doi: 10.1016/j.techsoc.2022.102022.
[40] A. wael Al-khatib, “Drivers of generative artificial intelligence to fostering exploitative and exploratory innovation: A TOE framework,” Technology in Society, vol. 75, p. 102403, 2023/11/01/ 2023, doi: 10.1016/j.techsoc.2023.102403.
[41] O. H. Salah and M. M. Ayyash, “E-commerce adoption by SMEs and its effect on marketing performance: An extended of TOE framework with ai integration, innovation culture, and customer tech-savviness,” Journal of Open Innovation: Technology, Market, and Complexity, vol. 10, no. 1, p. 100183, 2024/03/01/ 2024, doi: 10.1016/j.joitmc.2023.100183.
[42] Y. Zhang, J. Sun, Z. Yang, and Y. Wang, “Critical success factors of green innovation: Technology, organization and environment readiness,” Journal of Cleaner Production, vol. 264, p. 121701, 2020/08/10/ 2020, doi: 10.1016/j.jclepro.2020.121701.
[43] P. J. DiMaggio and W. W. Powell, “The Iron Cage Revisited: Institutional Isomorphism and Collective Rationality in Organizational Fields,” American Sociological Review, vol. 48, no. 2, pp. 147–160, 1983, doi: 10.2307/2095101.
[44] M. C. Suchman, “Managing legitimacy: Strategic and institutional approaches,” Academy of management review, vol. 20, no. 3, pp. 571–610, 1995.
[45] L. G. Zucker, “Institutional Theories of Organization,” Annual Review of Sociology, vol. 13, pp. 443–464, 1987. [Online]. Available: http://www.jstor.org/stable/2083256.
[46] J. W. Meyer and B. Rowan, “Institutionalized Organizations: Formal Structure as Myth and Ceremony,” American Journal of Sociology, vol. 83, no. 2, pp. 340–363, 1977, doi: 10.1086/226550.
[47] R. Moser, J. Winkler, G. Narayanamurthy, and V. Pereira, “Organizational knowledgeable responses to institutional pressures–a review, synthesis and extension,” Journal of Knowledge Management, vol. 24, no. 9, pp. 2243–2271, 2020, doi: 10.1108/JKM-05-2020-0349.
[48] S. T. Pamela, “The institutionalization of institutional theory,” Studying organization: Theory and method, p. 169, 1999.
[49] S. A. Sherer, C. D. Meyerhoefer, and L. Peng, “Applying institutional theory to the adoption of electronic health records in the U.S,” Information & Management, vol. 53, no. 5, pp. 570–580, 2016/07/01/ 2016, doi: 10.1016/j.im.2016.01.002.
[50] D. Jugend, P. D. C. Fiorini, P.-L. Fournier, H. Latan, C. J. Chiappetta Jabbour, and J. A. A. Scaliza, “Industry 4.0 technologies for the adoption of the circular economy: An analysis of institutional pressures and the effects on firm performance,” Journal of Environmental Management, vol. 370, p. 122260, 2024/11/01/ 2024, doi: 10.1016/j.jenvman.2024.122260.
[51] K. Kauppi, “Extending the use of institutional theory in operations and supply chain management research: Review and research suggestions,” International Journal of Operations & Production Management, vol. 33, no. 10, pp. 1318–1345, 2013, doi: 10.1108/IJOPM-10-2011-0364.
[52] A. Leelasantitham, “A Novel Guideline Framework for Research and Development in the Field of Management of Technology and Innovation,” in 2024 5th Technology Innovation Management and Engineering Science International Conference (TIMES-iCON), 2024: IEEE, pp. 1–5, doi: 10.1109/TIMES-ICON61890.2024.10630775.
[53] O. A. Gansser, S. Boßow-Thies, and B. Krol, “Creating trust and commitment in B2B services,” Industrial Marketing Management, vol. 97, pp. 274–285, 2021/08/01/ 2021, doi: 10.1016/j.indmarman.2021.07.005.
[54] F. Chameroy, S. Salgado, V. de Barnier, and D. Chaney, “In platform we trust: How interchangeability affects trust decisions in collaborative consumption,” Technological Forecasting and Social Change, vol. 198, p. 122997, 2024/01/01/ 2024, doi: 10.1016/j.techfore.2023.122997.
[55] F. Caliskan, Y. Idug, D. Gligor, and S.-J. Hong, “Blockchain technology for building buyer-supplier trust and transparency in supply chains: An experimental study on P2P online marketplace vendors,” Industrial Marketing Management, vol. 124, pp. 239–253, 2025/01/01/ 2025, doi: 10.1016/j.indmarman.2024.12.004.
[56] L. Cui, Z. Wang, Y. Liu, and G. Cao, “How does data-driven supply chain analytics capability enhance supply chain agility in the digital era?,” International Journal of Production Economics, vol. 277, p. 109404, 2024/11/01/ 2024, doi: 10.1016/j.ijpe.2024.109404.
[57] S. Aljarboa, “Factors influencing the adoption of artificial intelligence in e-commerce by small and medium-sized enterprises,” International Journal of Information Management Data Insights, vol. 4, no. 2, p. 100285, 2024, doi: 10.1016/j.jjimei.2024.100285.
[58] F. Bhuiyan, T. Rana, K. Baird, and R. Munir, “Strategic outcome of competitive advantage from corporate sustainability practices: Institutional theory perspective from an emerging economy,” Business Strategy and the Environment, vol. 32, no. 7, pp. 4217–4243, 2023, doi: 10.1002/bse.3362.
[59] S. Bag, G. Srivastava, S. Gupta, J. Z. Zhang, and S. Kamble, “Climate change adaptation capability, business-to-business marketing capability and firm performance: Integrating institutional theory and dynamic capability view,” Industrial Marketing Management, vol. 115, pp. 470–483, 2023/11/01/ 2023, doi: 10.1016/j.indmarman.2023.11.003.
[60] C. Q. Nguyen, A. M.-T. Nguyen, and P. Tran, “Assessing the critical determinants of cross-border E-commerce adoption intention in Vietnamese small and medium-sized enterprises: PLS-SEM algorithm approach,” Journal of Open Innovation: Technology, Market, and Complexity, vol. 10, no. 1, p. 100257, 2024/03/01/ 2024, doi: 10.1016/j.joitmc.2024.100257.
[61] L. S. Barreto, V. Freitas, and V. A. Freitas de Paula, “Sustainable supply chain innovation and market performance: The role of sensing and innovation capabilities,” Cleaner and Responsible Consumption, vol. 14, p. 100199, 2024/09/01/ 2024, doi: 10.1016/j.clrc.2024.100199.
[62] D. Etse, A. McMurray, and N. Muenjohn, “The Effect of Regulation on Sustainable Procurement: Organisational Leadership and Culture as Mediators,” Journal of Business Ethics, vol. 177, no. 2, pp. 305–325, 2022/05/01 2022, doi: 10.1007/s10551-021-04752-0.
[63] H. Li, Y. Wu, D. Cao, and Y. Wang, “Organizational mindfulness towards digital transformation as a prerequisite of information processing capability to achieve market agility,” Journal of Business Research, vol. 122, pp. 700–712, 2021/01/01/ 2021, doi: 10.1016/j.jbusres.2019.10.036.
[64] H. T. Lu, X. Li, and K. F. Yuen, “Digital transformation as an enabler of sustainability innovation and performance – Information processing and innovation ambidexterity perspectives,” Technological Forecasting and Social Change, vol. 196, p. 122860, 2023/11/01/ 2023, doi: 10.1016/j.techfore.2023.122860.
[65] J. Cohen, P. Cohen, S. G. West, and L. S. Aiken, Applied Multiple Regression/Correlation Analysis for the Behavioral Sciences. Taylor & Francis, 2013.
[66] S.-J. Chang, A. van Witteloostuijn, and L. Eden, “From the Editors: Common method variance in international business research,” Journal of International Business Studies, vol. 41, no. 2, pp. 178–184, 2010/02/01 2010, doi: 10.1057/jibs.2009.88.
[67] B. J. Babin, M. Griffin, and J. F. Hair, “Heresies and sacred cows in scholarly marketing publications,” Journal of Business Research, vol. 69, no. 8, pp. 3133–3138, 2016/08/01/ 2016, doi: 10.1016/j.jbusres.2015.12.001.
[68] M. K. Lindell and D. J. Whitney, “Accounting for common method variance in cross-sectional research designs,” Journal of applied psychology, vol. 86, no. 1, p. 114, 2001, doi: 10.1037/0021-9010.86.1.114.
[69] C. M. Fuller, M. J. Simmering, G. Atinc, Y. Atinc, and B. J. Babin, “Common methods variance detection in business research,” Journal of Business Research, vol. 69, no. 8, pp. 3192–3198, 2016/08/01/ 2016, doi: 10.1016/j.jbusres.2015.12.008.
[70] C. M. Ringle, M. Sarstedt, and D. W. Straub, “Editor’s comments: A critical look at the use of PLS-SEM,” MIS quarterly, vol. 36, no. 1, pp. 3–14, 2012.
[71] J. F. Hair Jr, L. M. Matthews, R. L. Matthews, and M. Sarstedt, “PLS-SEM or CB-SEM: updated guidelines on which method to use,” International Journal of Multivariate Data Analysis, vol. 1, no. 2, pp. 107–123, 2017, doi: 10.1504/IJMDA.2017.087624.
[72] V. E. Vinzi, L. Trinchera, and S. Amato, PLS path modeling: from foundations to recent developments and open issues for model assessment and improvement (Handbook of partial least squares: Concepts, methods and applications). 2009, pp. 47–82.
[73] G. Dash and J. Paul, “CB-SEM vs PLS-SEM methods for research in social sciences and technology forecasting,” Technological Forecasting and Social Change, vol. 173, p. 121092, 2021/12/01/ 2021, doi: 10.1016/j.techfore.2021.121092.
[74] J. Henseler, C. M. Ringle, and R. R. Sinkovics, “The use of partial least squares path modeling in international marketing,” in New challenges to international marketing, vol. 20: Emerald Group Publishing Limited, 2009, pp. 277–319.
[75] C. M. Ringle, D. da Silva, and D. d. S. Bido, “Modelagem de Equações Estruturais com Utilização do Smartpls,” ReMark – Revista Brasileira de Marketing, vol. 13, no. 2, pp. 56–73, 05/23 2014, doi: 10.5585/remark.v13i2.2717.
[76] J. F. Hair, J. J. Risher, M. Sarstedt, and C. M. Ringle, “When to use and how to report the results of PLS-SEM,” European Business Review, vol. 31, no. 1, pp. 2–24, 2019, doi: 10.1108/EBR-11-2018-0203.
[77] W. Chin and G. Marcoulides, “The Partial Least Squares Approach to Structural Equation Modeling,” Modern Methods for Business Research, vol. 8, 01/01 1998.
[78] J. Henseler, C. M. Ringle, and M. Sarstedt, “A new criterion for assessing discriminant validity in variance-based structural equation modeling,” Journal of the Academy of Marketing Science, vol. 43, no. 1, pp. 115–135, 2015/01/01 2015, doi: 10.1007/s11747-014-0403-8.
[79] J. Henseler, G. Hubona, and P. A. Ray, “Using PLS path modeling in new technology research: updated guidelines,” Industrial management & data systems, vol. 116, no. 1, pp. 2–20, 2016, doi: 10.1108/IMDS-09-2015-0382.
[80] J. F. Hair, W. C. Black, and B. J. Babin, Multivariate Data Analysis: A Global Perspective. Pearson Education, 2010.
[81] A. Field, Discovering statistics using IBM SPSS statistics. Sage publications limited, 2013.
[82] P.-F. Hsu, S. Ray, and Y.-Y. Li-Hsieh, “Examining cloud computing adoption intention, pricing mechanism, and deployment model,” International Journal of Information Management, vol. 34, no. 4, pp. 474–488, 2014/08/01/ 2014, doi: 10.1016/j.ijinfomgt.2014.04.006.
[83] A. W. Siyal, H. Chen, F. Shahzad, and S. Bano, “Investigating the role of institutional pressures, technology compatibility, and green transformation in driving manufacturing industries toward green development,” Journal of Cleaner Production, vol. 428, p. 139416, 2023/11/20/ 2023, doi: 10.1016/j.jclepro.2023.139416.
[84] M. M. Crossan and M. Apaydin, “A Multi-Dimensional Framework of Organizational Innovation: A Systematic Review of the Literature,” Journal of Management Studies, vol. 47, no. 6, pp. 1154–1191, 2010, doi: 10.1111/j.1467-6486.2009.00880.x.
[85] J. J. P. Jansen, D. Vera, and M. Crossan, “Strategic leadership for exploration and exploitation: The moderating role of environmental dynamism,” The Leadership Quarterly, vol. 20, no. 1, pp. 5–18, 2009/02/01/ 2009, doi: 10.1016/j.leaqua.2008.11.008.
[86] T. Tanjung, I. Ghazali, W. H. W. Mahmood, and S. G. Herawan, “Drivers and barriers to Industrial Revolution 5.0 readiness: A comprehensive review of key factors,” Green Technologies and Sustainability, vol. 3, no. 4, p. 100217, 2025/10/01/ 2025, doi: 10.1016/j.grets.2025.100217.
Biographies

Visakorn Kirivan, CFA received the bachelor’s degree in Economics from Kasetsart University in 2009, and the master’s degree in Financial Economics from the National Institute of Development Administration (NIDA) in 2015. He is currently pursuing a Ph.D. in IT Management at Mahidol University since 2022. He is presently working as Senior Vice President (SVP) Investment Strategist at Kasikorn Securities PLC, where he leads macroeconomic research and strategic asset allocation for high-net-worth and institutional clients. Prior to that, he held the position of VP and Economist at DAOL Securities PLC, guiding global portfolio strategies and multi-asset investment models. His earlier roles include Assistant Fund Manager at Dhipaya Insurance PLC and Business Intelligence Officer at Thaicom PLC. His research interests include macroeconomic forecasting, portfolio strategy design, digital finance, and the integration of data-driven approaches in investment decision-making. He has been actively involved in educating young professionals as a trainer at the Stock Exchange of Thailand and serves as a reviewer and speaker for various investment and financial forums.

Adisorn Leelasantitham (Ph.D.) received the B.Eng. degree in Electronics and Telecommunications and the M.Eng. degree in Electrical Engineering from King Mongkut’s University of Technology Thonburi (KMUTT), Thailand, in 1997 and 1999, respectively. He received his Ph.D. degree in Electrical Engineering from Sirindhorn International Institute of Technology (SIIT), Thammasat University, Thailand, in 2005. He is currently the Associate Professor in Technology of Information System Management Division, Faculty of Engineering, Mahidol University, Thailand. His research interests include applications of blockchain technology, conceptual models and frameworks for IT management, disruptive innovation, image processing, AI, neural networks, machine learning, IoT platforms, data analytics, chaos systems, and healthcare IT. He is a member of the IEEE.
Journal of Mobile Multimedia, Vol. 21_5, 881–938.
doi: 10.13052/jmm1550-4646.2154
© 2025 River Publishers