Development of an Island Recycle Waste Management System Using the LINE OA Platform to Enhance the Efficiency of Waste and Recyclable Material Management Reporting on Islands for Sustainable Practices
Kemachart Kemavuthanon1, 2, Samatthachai Yamsa-ard1, 3,*, Panate Manomaivibool4 and Yu Liu5
1Circular Economy for Waste-free Thailand Research Center, School of Science, Mae Fah Luang University, Chiang Rai, Thailand
2Digital and Communication Engineering, School of Applied Digital Technology, Mae Fah Luang University, Chiang Rai, Thailand
3Logistics and Supply Chain Management Program, School of Management, Mae Fah Luang University, Chiang Rai, Thailand
4Logistics and Supply Chain Management (SLSM), Burapha University, Chon Buri, Thailand
5Burapha University International College (BUUIC), Burapha University, Chon Buri, Thailand
E-mail: kemachart.kem@mfu.ac.th; samatthachai.yam@mfu.ac.th; panate.ma@go.buu.ac.th; liu.yu@go.buu.ac.th
*Corresponding Author
Received 23 July 2025; Accepted 31 December 2025
Abstract
This research focuses on the development of an island recycle waste management system to address challenges in managing waste transportation and recycling data on islands in Thailand. The system was designed to support digital data recording, including waste types and quantities, transportation costs, and the real-time uploading of verification evidence to a centralized database. The study applies a mixed-methods approach that integrates a TAM-based quantitative analysis with a qualitative user.
The study applied the technology acceptance model (TAM) to analyze user satisfaction regarding perceived usefulness (PU) and perceived ease of use (PEOU). Data collected from participating shops on target islands were analyzed to evaluate system acceptance, which was found to be moderate to high.
The system shows indications of reducing errors; however, objective error-rate comparisons were not collected and are now acknowledged as a limitation. The system streamlined processes and enhanced data management efficiency, although some users encountered issues such as menu complexity and unfamiliarity with technology.
Proposed enhancements include adding features tailored to elderly shop owners, integrating image processing technology to support document scanning, developing multimedia user guides, and organizing hands-on training sessions as part of the intervention rather than recommendations alone.
This study aims to promote sustainable waste management on islands and to refine the system to better suit diverse user contexts. It also serves as a prototype for future system development.
Keywords: Information technology, LINE OA, waste and recycling data management, technology acceptance model (TAM), perceived usefulness (PU), perceived ease of use (PEOU).
1 Introduction
Managing waste on islands in Thailand poses significant challenges, impacting both the environment and the tourism industry. Existing waste management systems are often insufficient and inefficient, leading to the accumulation of waste in natural areas. This study aims to develop an information technology-based waste management reporting system by utilizing the island recycle waste management system [1, 2]. The platform facilitates real-time recording and verification of waste transportation and recyclable material data from recycling shops on target islands. The system enables systematic and auditable data collection, minimizes errors, and reduces redundancy associated with traditional data recording methods.
This research builds upon a prior project focused on sustainable waste and recyclable material management on islands [3]. The initiative supported the transportation of waste and recyclable materials from islands to the mainland by subsidizing ferry transport costs for participating recycling shops. The project’s goal was to increase the volume of recyclable materials entering recycling processes, reduce waste accumulation, and promote sustainable waste management practices [4, 5].
The system was designed using insights from the previous project to accommodate users with diverse technological expertise. It allows users to record waste types, quantities, and transportation costs through a rich menu function in the LINE OA platform while uploading transportation verification evidence to the project’s centralized database in real-time [6].
This study evaluates the success factors for adopting the island recycle waste management system using the technology acceptance model (TAM) [7, 8]. The evaluation focuses on key variables, including perceived usefulness (PU) and perceived ease of use (PEOU), which significantly influence users’ intentions and positive attitudes toward system adoption [9].
2 Methodology
This study adopts a mixed methods research approach, integrating quantitative and qualitative findings to systematically explain user acceptance and satisfaction with the LINE Official Account (LINE OA) system among waste collectors. Quantitative analysis based on the technology acceptance model (TAM) indicates that users demonstrated moderate to high levels of attitude toward using (ATU) and behavioral intention to use (BI). These results suggest that the system was perceived as effective in reducing operational steps and saving time in daily work processes. However, user-related factors – particularly age and mobile device compatibility – were found to influence actual system use. Even when the system was perceived as efficient, older users or those with limited device capability were less able to utilize its full functionality, reflecting variations in overall system acceptance. Qualitative findings derived from open-ended questions further support and contextualize the quantitative results. Users cited practical experiences such as ease of use, rapid information reporting, and reduced reliance on paper-based records as key benefits. These experiential accounts are consistent with the observed moderate to high levels of ATU and BI, reinforcing the interpretation of technology acceptance within the study context. The objective is to enhance the efficiency of data management processes. The research methodology includes the following steps:
2.1 Analysis of Waste and Recyclable Material Management Theories
The waste management strategy for islands emphasizes source separation to facilitate transportation and recycling processes [1, 2, 10]. Reports from the Sustainable Waste and Recyclable Material Management on Islands project indicate that recyclable waste is transported to processing facilities on the mainland via ferries [11, 12]. Effective waste management requires a standardized and accurate information system to support sustainable operations [13].
The Circular Economy framework was adopted as the primary conceptual model for this research. This framework focuses on recycling materials back into the production cycle to reduce waste generation. It also incorporates the 3R principles (reduce, reuse, recycle) to improve resource utilization and minimize environmental impact [5].
2.2 Application of the LINE OA Platform for Data Management
LINE OA was chosen for this research due to its widespread usage in Thailand [6, 14]. The system was designed to enable recycling shops to record waste types, quantities, and transportation costs via the rich menu feature in LINE OA. Users can also upload receipt images to verify data, which is transmitted directly to a centralized database in real time. This design reduces data recording errors and enhances tracking efficiency [15].
The LINE OA system was developed with consideration for users’ technological limitations. User-friendly features ensure accessibility. A technical specification has been added to clarify system functions, including (1) input validation rules, (2) database structure, (3) data-flow from LINE OA to the central server, and (4) error-handling [9].
2.3 Design of Technology Acceptance Study (Technology Acceptance Model: TAM)
This study employs the technology acceptance model (TAM) to analyze the acceptance of the system, focusing on two key factors: perceived usefulness (PU) – the extent to which the system is perceived as beneficial – and perceived ease of use (PEOU) – the degree of ease associated with its use. These factors directly influence users’ attitude toward using (ATU) and their behavioral intention to use (BI) [7, 9], which serve as critical indicators of the system’s adoption success. The research evaluates PU by assessing how effectively the system reduces the complexity of traditional processes, such as manual, handwritten data management prone to errors [6]. The new system enhances transparency and operational efficiency by enabling users to input waste type and transportation cost data directly through the rich menu feature. These inputs are then transmitted in real time to a centralized database. This streamlined process ensures faster and more accurate data management compared to previous manual methods. The study analyzes PEOU by examining the usability of the rich menu and system interface. Usability is assessed based on users’ ability to input data and upload verification documents [9]. Special attention is given to the intuitiveness of the menu, including the use of visual icons to minimize complexity. Training sessions were incorporated as a formal part of the intervention, including hands-on practice, demonstrations of key LINE OA functions, and follow-up assistance for elderly or low-literacy users, to directly strengthen PEOU as recommended. A satisfaction questionnaire was developed using a Likert scale to measure both PU and PEOU. The scale ranged from 1 (strongly disagree) to 5 (strongly agree). Sample questions related to PU included: “Does the system help reduce processing time?” “Does the system improve data accuracy?” For PEOU, sample questions focused on: “Is data entry through the rich menu straightforward?” “Does the system respond quickly to user inputs?” The collected data were analyzed to identify the factors influencing system acceptance and to provide insights into potential improvements for broader adoption. Additionally, although TAM computations were performed, the study acknowledges that assigning without empirical estimation does not follow standard TAM analytical procedure. These values are therefore interpreted as heuristic indicators rather than validated coefficients.
Mathematical Equations in the TAM Framework
The technology acceptance model (TAM) utilizes mathematical equations to evaluate the relationships among perceived usefulness (PU), perceived ease of use (PEOU), attitude toward using (ATU), and behavioral intention to use (BI). The relationships are represented as follows:
1. Attitude toward using (ATU):
∙ ATU represents the weighted sum of PU and PEOU.
∙ The constants () adjust the weights assigned to each factor.
2. Behavioral intention to use (BI):
∙ BI is directly influenced by ATU and PU.
∙ The constants () represent the strength of the relationships between BI and its influencing factors.
3. Actual system use:
∙ Actual system use depends on BI.
In this study, the constants were defined as , and as heuristic indicators. These values were assigned for analytical simplicity and do not derive from empirical estimation procedures such as regression or structural equation modeling. Because these coefficients were not statistically estimated, they should be interpreted as approximations rather than validated causal parameters. This constitutes a methodological limitation, and the resulting ATU and BI values are treated as descriptive insights rather than evidence of confirmed structural relationships. This balance highlights that both perceived usefulness (PU) and perceived ease of use (PEOU) play equal roles in shaping positive attitudes (ATU) and behavioral intentions (BI).
By employing these constants, the study offers an exploratory view of potential relationships among TAM variables, which can guide future studies employing full SEM-based validation. The results derived from this model enable researchers to identify critical factors affecting user acceptance and to make evidence-based adjustments to improve the system’s performance and address any issues revealed through the evaluation.
2.4 Data Collection and Analysis
This research utilized scores for perceived usefulness (PU) and perceived ease of use (PEOU), derived from user questionnaires, to assess satisfaction with the system. The data collection and analysis process consisted of the following steps:
1. Data collection: Questionnaires were distributed to collect PU and PEOU scores from participating shops on the target island participating in the project.
2. Data analysis: The TAM equations were applied to calculate attitude toward using (ATU) and behavioral intention to use (BI), thereby elucidating the relationships between perceived usefulness, ease of use, and user intention.
3. Presentation of results: The analysis results were presented through graphs and tables, highlighting the factors influencing system acceptance.
This study adopted a quantitative research design based on the technology acceptance model (TAM) to evaluate user acceptance of an island-based recyclable waste transportation data management system. The analysis focused on actual system users operating in island contexts.
Purposive sampling was employed to select waste collectors and recyclable material buyers on islands, as they are the primary users responsible for transporting recyclable waste to the mainland under high logistical cost constraints. Transportation costs were subsidized by the project to ensure continuous system use, and participants were required to record and report monthly waste volume and weight through the system.
A structured questionnaire was used as the primary data collection instrument for users of the LINE Official Account (LINE OA) system. The questionnaire was developed based on the technology acceptance model (TAM) and comprised four sections: (1) TAM-related constructs, (2) attitude toward using the system (ATU), (3) behavioral intention to use (BI), and (4) overall user satisfaction with the LINE OA system.
Items measuring TAM constructs, ATU, BI, and user satisfaction were assessed using a five-point Likert scale ranging from 1 (strongly disagree) to 5 (strongly agree). ATU and BI were operationalized as directly measured constructs, with scores calculated as the mean of their respective items.
Descriptive statistics were used to summarize construct scores, and mean values were interpreted using predefined agreement-level thresholds. In addition, open-ended questions were included to capture user remarks related to system usability and implementation context. These qualitative descriptions were used solely to support the interpretation of quantitative findings and did not constitute an independent qualitative analysis.
The sample comprised 14 participating shops out of 17 identified in the study area (82.35% coverage), which is considered adequate as it represents the majority of the total population of active system users within the defined island context.
Quantitative data were collected using a structured questionnaire with five-point Likert-scale items measuring perceived usefulness (PU), perceived ease of use (PEOU), attitude toward use (ATU), and behavioral intention (BI). Data were analyzed using descriptive statistics (mean and standard deviation) and inferential analysis to examine relationships among TAM constructs.
Although the model provides insight into relative patterns of user perception, the absence of empirical coefficient estimation limits the inferential strength of the TAM outputs. Nevertheless, the descriptive relationships observed in PU, PEOU, ATU, and BI offer meaningful indications of system usability challenges and support the identification of areas requiring improvement, such as enhancing the user interface or introducing features tailored to users in remote areas with limited technological resources.
3 System Design for Information Management
The system design for information management in this study focused on enhancing the LINE OA platform to improve the efficiency of recording and managing data related to waste transportation and recycling materials. The system was developed to address the limitations of the previous workflow, which included delays, data entry errors, and operational complexity [1, 6]. The system architecture and workflow were further specified in technical detail. The revised design is structured into three explicit components as follows:
1. Analysis of limitations in the traditional workflow: The current workflow was analyzed to identify pain points, such as manual data entry errors, delays in data submission, and inefficiencies in waste tracking and reporting. This analysis included process mapping, identification of error-prone steps, and bottleneck detection across island-based operations.
2. Development of a new workflow utilizing LINE OA: A new workflow was designed using LINE OA to simplify processes, improve data accuracy, and facilitate real-time data submission. Key improvements included the integration of features for waste categorization, cost recording, and document upload through the platform’s rich menu. Backend mechanisms such as input validation, automatic timestamping, and metadata tagging of uploaded images were incorporated to support data integrity and auditability.
3. Platform workflow design for LINE OA: The LINE OA platform was designed using user-centric principles to ensure accessibility for users with varying levels of technological literacy. Interactive menus, visual icons, and real-time synchronization with a centralized database were implemented to enhance usability. Interface refinements were informed by iterative testing with participating vendors, particularly elderly users, leading to improvements in menu hierarchy, icon clarity, and navigation flow.
This system aims to overcome inefficiencies in traditional waste management workflows and establish a more streamlined and reliable process for data recording and reporting, supporting sustainable waste management practices in remote island contexts. Nevertheless, the system has limitations, including reliance on stable internet connectivity, learning barriers for first-time users, and constraints imposed by the fixed architecture of the LINE OA platform. These limitations are acknowledged and designated as areas for future development.
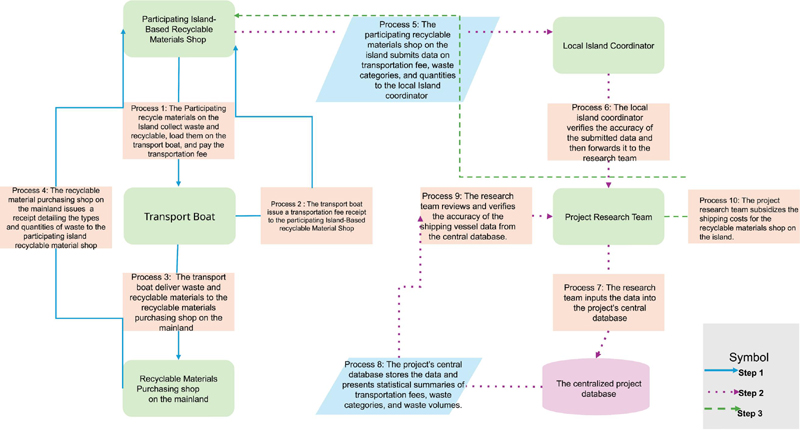
Figure 1 Traditional workflow. Source: Authors’ own.
Figure 1 shows the traditional workflow employed in the project, which relied on manual data recording and information transmission via coordinators. The process began with recycling shops on the island collecting waste and recyclable materials. These shops then transported the waste via ferry to waste buyers on the mainland. Data such as the quantity and type of waste, transportation costs, and receipts were recorded entirely on paper. All information had to be verified by the island coordinator before being forwarded to the research team for entry into the centralized database. This workflow presented several significant challenges, including:
Errors in data recording: The manual nature of recording information on paper increased the likelihood of errors.
Delays in data collection: The reliance on physical documentation caused inefficiencies and slow data transmission.
Lack of transparency: The verification and approval process lacked visibility, complicating the auditing and tracking of records.
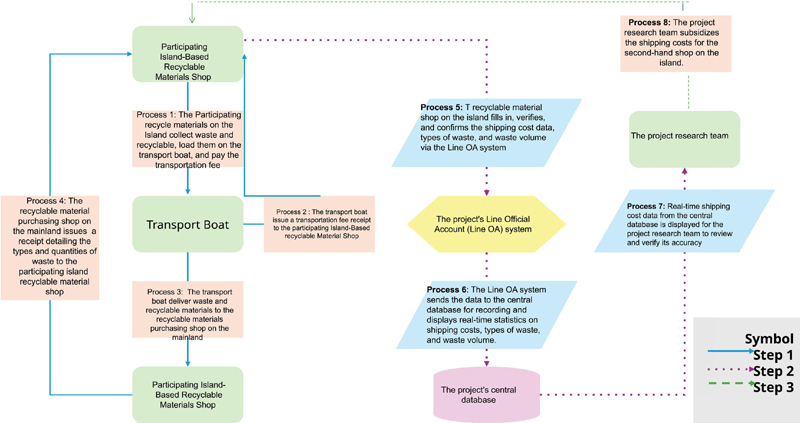
Figure 2 New workflow. Source: Authors’ own.
These limitations highlighted the need for a more efficient, transparent, and error-resistant system, which served as a foundation for the development of an improved digital workflow.
To address these limitations, Figure 2 presents a redesigned workflow that employs the island recycle waste management system (LINE OA) as the primary tool for data management. The system is designed to facilitate digital data recording, streamlining the entire process.
In the new workflow, recycling shop operators can directly record waste type, quantity, and transportation costs using LINE OA. All data is automatically transmitted to a centralized database, eliminating the need for intermediary coordinators.
This new approach enhances the speed and accuracy of data management while reducing dependency on manual operations, ensuring a more efficient and reliable system for managing waste and recycling information.
Table 1 Comparison between the old and new workflow. Source: Authors’ own
| Topic | Traditional Workflow | New Workflow |
| Data recording process | Using handwritten documents, data is easily error-prone and difficult to verify. | Recording data digitally via system reduces errors and can be verified quickly. |
| Speed of data transmission | Takes a long time because it has to go through a coordinator to collect and send data. | Sends data to the central database in real time, increasing speed and reducing complicated steps. |
| Data accuracy | High errors due to manual recording and duplicate data transmission. | Reduces errors with a digital system designed to check data before sending. |
| Operational costs | Costs are high due to the use of manpower and time in recording and checking data. | Reduces costs with an automatic system that reduces the use of human resources. |
| Transparency in data management | Lack of transparency, data is scattered and difficult to check. | Data storage system in the central database can be checked and tracked in real time. |
| Access to data | Relies on coordination and document data that are often delayed. | Access data via LINE OA and the central database immediately. |
| Convenience in data transmission | Data transmission requires multiple steps, relying on documents and personal communication. | The system can send data directly via LINE OA in digital form, which is fast and reduces complicated steps. |
Table 1 presents a comparison between the traditional and newly implemented workflows. The analysis reveals that the new system, which integrates LINE OA technology, offers several advantages that better address the need for convenience in data transmission. In the traditional system, data transmission relied on manual processes, which required significant labor and time. This approach also faced challenges such as the risk of document loss and delays in data processing, especially when multiple coordination steps were involved. In contrast, the new system streamlines data handling, improving efficiency and reducing the likelihood of errors or delays.
In the new system, the use of LINE Official Account (LINE OA) simplifies complex steps and facilitates real-time data submission to a centralized database without the need for intermediaries. This eliminates potential errors arising from communication issues or redundant data entry. Additionally, the new system enhances transparency and improves the ability to track data status, thereby streamlining the entire process. This transformation in data management reflects the application of information technology to increase operational efficiency, addressing issues inherent in the traditional system, such as delays and the inconvenience of coordination. Furthermore, it fosters trust in the data management process. The enhanced ease of data transmission also reduces time and labor costs, leading to more sustainable outcomes and providing a foundation for future system development.
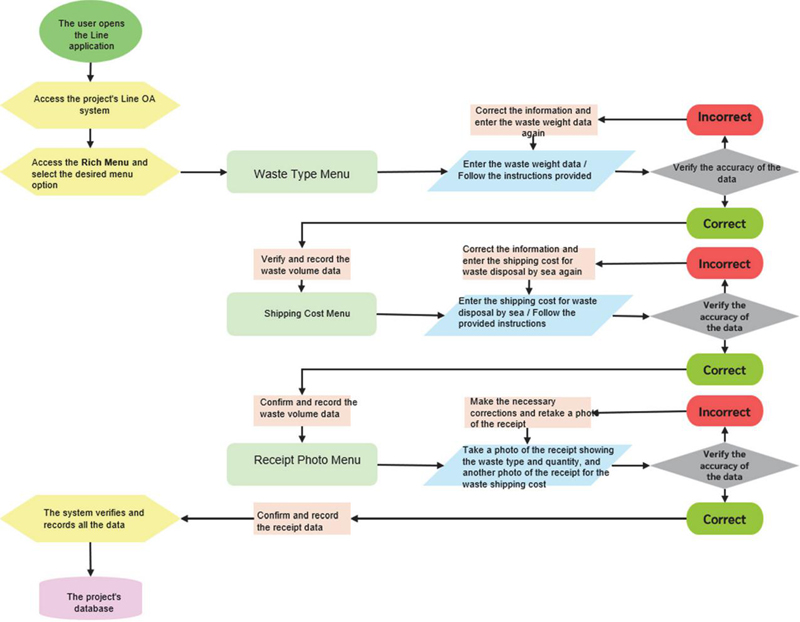
Figure 3 Operational design of the LINE OA platform. Source: Authors’ own.
Figure 3 presents the functionality of the island recycle waste management system, designed to encompass all essential steps in the data management process. Key features include the rich menu, which enables users to conveniently access various options such as selecting waste types, inputting waste weight data, entering transportation costs, and uploading receipt images for data verification. The system also incorporates a data review function prior to submission, reducing potential errors.
Moreover, the LINE OA system enhances transparency by storing all information in a centralized database, allowing the research team to access and verify data in real time. This design streamlines the complex steps of the traditional system, significantly improving the efficiency of waste management operations on the island. With user-centric considerations, the system has been developed to be intuitive and accessible, catering to diverse levels of technological proficiency among users. The use of a clear rich menu and a straightforward interface minimizes usability barriers, particularly for individuals with limited technological experience. This thoughtful design approach ensures that the system is both inclusive and effective in achieving its intended objectives.
The island recycle waste management system is designed as a user-friendly tool for managing data related to the transportation of waste and recyclable materials. Accessible via the LINE application on smartphones or other devices, the system encompasses the following key processes:
1. User registration: Users are required to register through the system to link their accounts with the centralized database. Access permissions are granted by the system administrator based on predefined user roles.
2. Data recording and reporting: During waste transportation, users can input relevant information, such as waste type, weight, and transportation costs, using forms available within the system.
3. Data verification: All recorded data is stored in a centralized database and can be immediately verified through a real-time dashboard.
4. Data analysis: The system provides analytical summaries, such as the distribution of waste types and quantities transported, supporting policy planning and process optimization.
By integrating these functionalities, the system enhances the efficiency and accuracy of waste management processes while providing valuable insights for decision-making and future improvements.
4 Result and Discussion
4.1 System Display and Functionality of the Island Recycle Waste Management System
The island recycle waste management system was specifically designed to support the management of waste and recyclable material data within the project, focusing on enhancing operational efficiency, convenience, and transparency. The system incorporates defined functional modules covering data input, validation, transmission, storage, and visualization, thereby streamlining the workflow from user data entry to real-time verification within a centralized database
The user interface of LINE OA is simple and accessible via smartphones, with the rich menu serving as a central feature. This allows users to input data such as waste types, weights, and transportation costs. Required input fields are predefined to reduce ambiguity, and basic validation rules prevent incomplete or inconsistent submissions. Additionally, the system supports the upload of receipt images to verify data, significantly reducing errors associated with manual document handling
The system also includes automated response messages, which guide users through each step of the process. These messages function as a guided workflow, prompting users to complete each required action sequentially. For example, users receive notifications to review their entries before submission or confirmation once their data has been successfully submitted. These mechanisms help reduce user input errors and improve user confidence in system reliability, although no controlled experimental error comparison was conducted. Furthermore, the system synchronizes data with the centralized database in real time, enabling efficient monitoring and tracking of operations. For project administrators, the system provides a dashboard feature that offers real-time oversight of waste transportation data submitted by vendors. The dashboard aggregates submitted records and presents descriptive summaries rather than predictive analytics. The dashboard facilitates the analysis of key metrics, such as the types and quantities of waste transported during each cycle, as well as transportation costs. These summaries support administrative review and planning but should be interpreted as operational indicators rather than performance benchmarks. This capability supports strategic planning and process optimization for future improvements. Overall, the system simplifies several steps of the traditional workflow and reduces the administrative burden for participating vendors. Additionally, the system fosters transparency throughout the operational workflow, contributing to more accountable, traceable, and efficient waste transportation management practices.
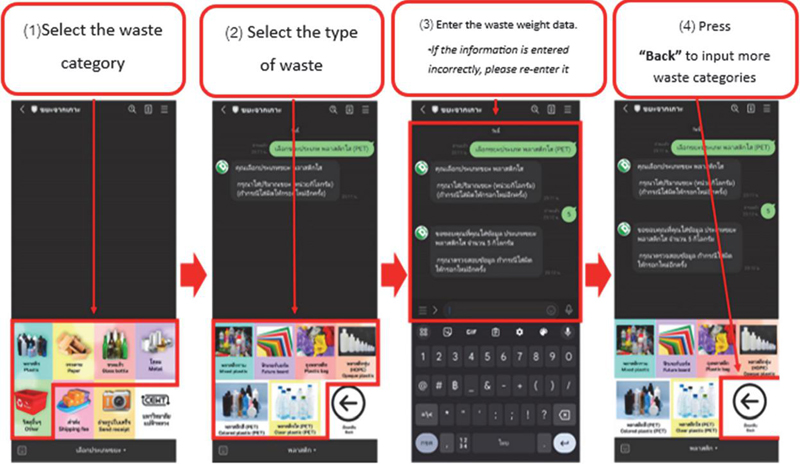
Figure 4 Filling in data on waste type and waste. Source: Authors’ own.
Figure 4 shows the initial step of utilizing the island recycle waste management system, which involves inputting waste type and weight data through the rich menu displayed within the chat interface of the application. Users can conveniently select waste types such as plastics, paper, metals, or other materials. The menu is designed with intuitive visual elements, including symbolic icons (e.g., a plastic bottle icon) to assist users in accurately understanding and selecting the appropriate waste category.
Once users complete the input of waste type and weight data, the system automatically provides a confirmation message, such as: “Thank you for entering the waste type information. Please review your submission. If any errors were made, kindly re-enter the information.” The system further guides users on subsequent steps, such as entering transportation cost data.
This user-centered design enhances accuracy and usability, ensuring that even users with limited technical expertise can navigate and complete the process efficiently. Moreover, the inclusion of automated responses and visual aids minimizes errors and streamlines the overall waste management workflow.
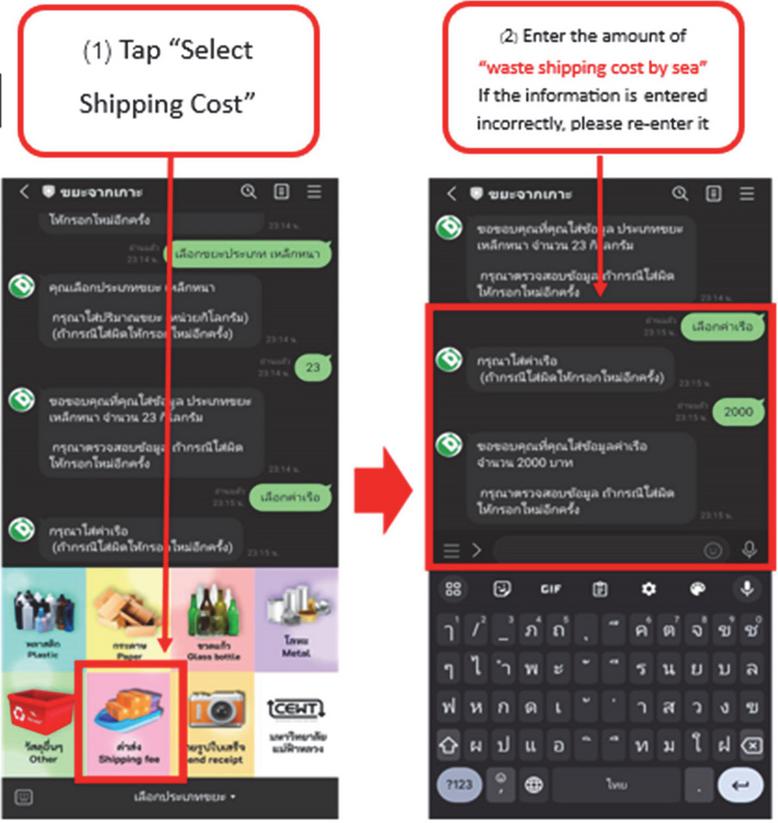
Figure 5 Filling in shipping cost information. Source: Authors’ own.
As shown in Figure 5, users proceed to enter shipping costs by activating the transportation cost menu within the rich menu, which features a transport ship icon to signify the menu’s function. This intuitive visual aid helps users easily identify and access the relevant section. Users can conveniently input shipping cost details through this menu. After submission, the system provides an automated response to verify the completeness of the entry, such as: “Thank you for entering the shipping cost information. Please review your submission. If any errors were made, kindly re-enter the information.” Additionally, the system guides users to proceed to the next step.
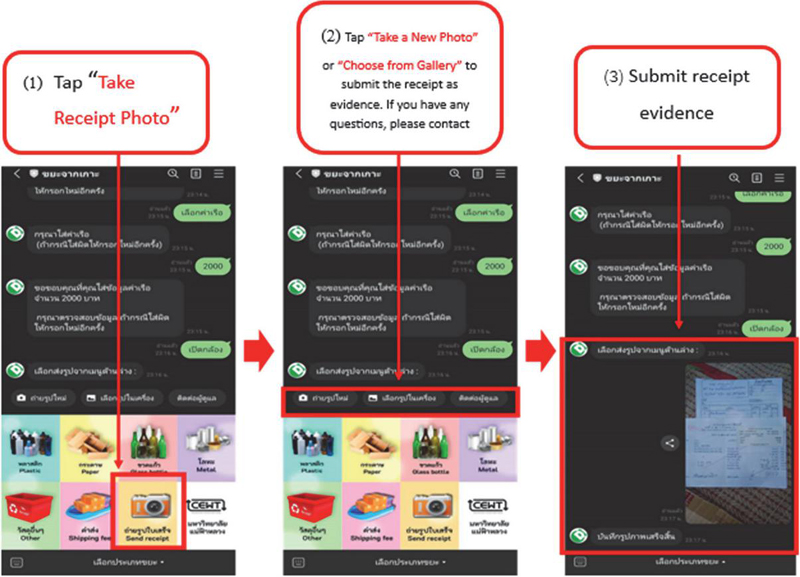
Figure 6 Uploading a photo of a receipt or proof of confirmation. Source: Authors’ own.
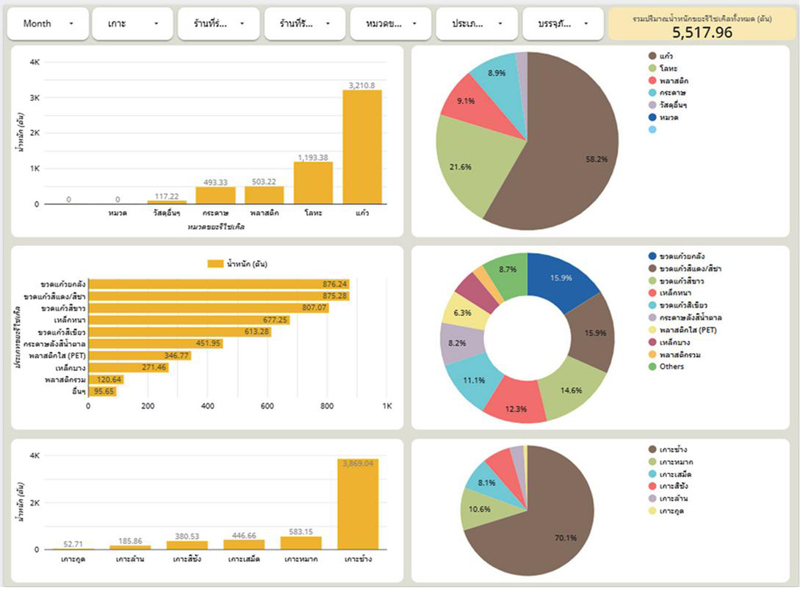
Figure 7 Project waste type and volume data dashboard for 2022–2024. Source: Authors’ own.
This design emphasizes user convenience, ensuring that the process of entering cost information is straightforward and efficient. By incorporating confirmation messages and step-by-step guidance, the system minimizes errors and enhances the overall user experience within the waste management workflow.
In Figure 6, users can upload images of receipts or verification documents through a dedicated menu in the rich menu, marked by a camera icon for intuitive recognition. This feature facilitates seamless submission of supporting documentation as part of the workflow. Once the upload is successfully completed, the system provides an automated confirmation message, such as: “Image upload completed.” This notification assures users that the system has successfully received and recorded the submitted information. This functionality enhances the reliability and transparency of the data submission process by ensuring that critical documentation is securely and accurately integrated into the central database.
All information entered and verified by users is transmitted to the central database in real-time. Upon successful submission, the system generates an automated confirmation message, such as: “Your information has been successfully recorded in the system.” Additionally, users can review the submitted data through a dedicated dashboard, specifically developed to enhance transparency and accessibility, as shown in Figure 7. This feature allows users to verify the accuracy of their records and facilitates efficient tracking and management of submitted information.
Table 2 Assessment of satisfaction with the use of the system of participating shops on participating islands. Source: Authors’ own
| Island Name | Shop Name | Score (PU) | Score (PEOU) | Value (ATU) | Value (BI) | Can Use the System | Reason and Suggestions |
| Koh Chang | Chaloei | 3 | 2 | 2.5 | 2.75 | No | Reason: The font size in the rich menu system is too small, and the display of the function is too complicated for the elderly. Suggestion: The zoom function and the font size should be increased. |
| Kob | 2 | 2 | 2.0 | 2.0 | No | Reason: The rich menu cannot respond to simple operations. Suggestion: Improve the rich menu to be suitable for the elderly. | |
| Mor | 3 | 2 | 2.5 | 2.75 | No | Reason: The use of the rich menu is too complicated, and the sequence of operations for the elderly is not easy to understand. Suggestion: Create a user manual or additional training to create understanding. | |
| Sarayut | 4 | 5 | 4.5 | 4.75 | Yes | Reason: The system responds quickly and the functions are complete and suitable for daily use. Suggestion: Add an automatic notification function to increase convenience. | |
| Lek | 5 | 5 | 5.0 | 5.0 | Yes | Reason: The system is modern, easy to use, and meets the needs of work. Suggestion: No additional suggestions. | |
| Mo | 4 | 3 | 3.5 | 3.75 | Yes | Reason: The system has good functions, but there are still some problems with some parts of the menu. Suggestion: Improve the menu to be more suitable for the context of use in each store. | |
| Koh Mak | Pong | 3 | 4 | 3.5 | 3.75 | Yes | Reason: The rich menu is useful in terms of information but has design limitations. Suggestion: Add instructions in the rich menu to help the elderly understand how to use it better. |
| Waen | 2 | 3 | 2.5 | 2.75 | No | Reason: The menu and functions do not meet the needs of daily use for the elderly. Suggestion: Simplify the functions and reduce unnecessary steps. | |
| Ruj | 5 | 5 | 5.0 | 5.0 | Yes | Reason: The system is easy to use. Fully responsive. Suggestions: No additional suggestions. | |
| Koh Kood | Kant | 3 | 2 | 2.5 | 2.75 | No | Reason: The rich menu function is complicated for the elderly Suggestions: Reduce the number of functions and add clear instructions |
| Koh Samet | Sa-at | 2 | 3 | 2.5 | 2.75 | No | Reason: The system is complicated to access the menu for the elderly Suggestions: Improve the rich menu to be suitable for the elderly. |
| O | 4 | 3 | 3.5 | 3.75 | Yes | Reason: The system responds well, but still lacks some ease of use. Suggestions: Add additional menu descriptions or change the menu to be more convenient to use. | |
| Koh Larn | Don | 3 | 4 | 3.5 | 3.75 | Yes | Reason: The rich menu is easy to use but lacks understanding of some functions. Suggestion: Provide learning materials or demonstrations in video format. |
4.2 Explanation of the Results of the Satisfaction Assessment of the System Usage According to the TAM Model
Table 2 presents the results of the satisfaction assessment of the use of the system among participating recycling shops on the island. The evaluation focused on two key indicators: perceived usefulness (PU) and perceived ease of use (PEOU), which reflect user satisfaction and acceptance of the technology. Additionally, the study calculated values for attitude toward using (ATU) and behavioral intention to use (BI), two critical variables that indicate users’ intentions and positive attitudes toward adopting the system. These metrics provide valuable insights into the system’s effectiveness and its alignment with user needs and expectations.
The assessment revealed that shops with high perceived usefulness (PU) and perceived ease of use (PEOU) scores, such as Ruj’s shop and Lek’s shop, achieved the highest attitude toward using (ATU) and behavioral intention to use (BI) scores of 5.0, indicating complete acceptance of the system. The system’s high scores were attributed to the functionality of the rich menu, which significantly reduced data management time and enhanced user convenience. For instance, Lek’s shop highlighted how the system minimized the complexity of data management and reduced potential errors.
In contrast, shops with low PU and PEOU scores, such as Pa Kla’s shop and Uncle Sa-ard’s shop, had the lowest ATU and BI scores, ranging from 2.0 to 2.75. These shops expressed dissatisfaction due to the system’s inability to meet their specific needs, particularly for older users. Key issues included the overly complex design of the rich menu and insufficient guidance for using its various functions. Shops with moderate PU and PEOU scores, such as Mo’s shop and Pa Pong’s shop, had ATU and BI scores between 3.5 and 3.75. This range reflects a perception that the system was beneficial in certain aspects but required improvements in usability to enhance its overall effectiveness. For example, Mo’s shop suggested simplifying the rich menu to improve accessibility and ensure more seamless interactions with the system.
The data presented in the table highlights a clear relationship between perceived usefulness (PU) and perceived ease of use (PEOU) with the decision to adopt the system across different shop locations. Shops that demonstrated effective system usage, such as Lek’s shop and Ruj’s shop, consistently exhibited high PU and PEOU scores. Conversely, shops that struggled with system usage, such as Uncle Chaloei’s shop and Pa Kla’s shop, recorded low PU and PEOU scores. These findings indicate that ease of use and perceived system utility are critical factors influencing technology acceptance.
In terms of user feedback, most shops recommended enhancing the system with accessible guidance tools, such as video tutorials or detailed step-by-step manuals, to support users with limited technological experience. Additionally, it was suggested that the arrangement and configuration of the rich menu be optimized to better suit the specific contexts and operational needs of each shop. These evaluation results underscore the importance of improving the island recycle waste management system to better address the diverse requirements of its users. Enhancing the understanding of PU and PEOU will significantly contribute to increased attitude toward using (ATU) and behavioral intention to use (BI) scores, fostering long-term acceptance and sustained usage of the system.
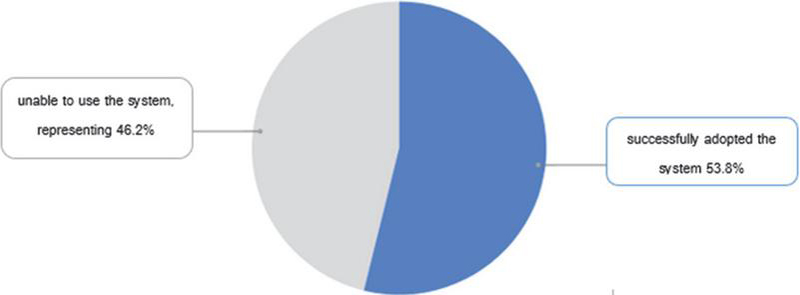
Figure 8 Proportion of system usage by antique shops on participating islands. Source: Authors’ own.
An analysis of the utilization of the system by antique shops participating in the project across various islands revealed that, out of the 13 participating shops, 7 successfully adopted the system, accounting for 53.8%, while 6 shops were unable to use the system, representing 46.2%. These findings, illustrated in Figure 8, reflect the varying levels of user readiness influenced by the distinct contexts of each area.
The 7 shops that successfully adopted the system were predominantly located in areas with better access to technology and greater familiarity with digital platforms. These included 3 shops on Koh Chang, 1 shop on Koh Mak, 1 shop on Koh Samet, and 1 shop on Koh Larn. These shops effectively utilized system functions, such as the rich menu, waste transportation data management, and tools that streamlined their operational processes. The adoption of the system contributed to reducing data management time and improving operational efficiency.
In contrast, the 6 shops unable to adopt the system faced key challenges related to a lack of basic technological knowledge. These included 3 shops on Koh Chang, 2 shops on Koh Mak, and 1 shop on Koh Kood. The challenges were particularly pronounced in areas with limited access to internet connectivity or appropriate devices. Furthermore, some shops reported difficulties with system functionalities, such as a lack of understanding of the rich menu or complications in accessing transportation data, which hindered effective usage.
The findings indicate that technological readiness and system acceptance are directly related to the level of understanding and perceived ease of use (PEOU) as well as the perceived usefulness (PU) of the system. Shops that successfully utilized the system generally exhibited higher PEOU and PU scores, reflecting confidence and positive attitudes toward system usage. Conversely, shops that were unable to utilize the system showed lower scores, highlighting the need for additional support.
Proportionally, the fact that 53.8% of shops successfully adopted the system demonstrates its potential to meet the operational needs of businesses to a certain extent. However, the remaining 46.2% of shops that failed to adopt the system underscore the necessity for further system enhancements aimed at improving usability. Additionally, providing targeted training to shop owners is essential to build confidence and reduce barriers to adoption.
To increase future adoption rates, efforts should focus on simplifying the rich menu to align with the specific usage contexts of island-based businesses. Furthermore, practical, hands-on training sessions can significantly enhance understanding and foster familiarity with the system, thereby increasing its effectiveness.
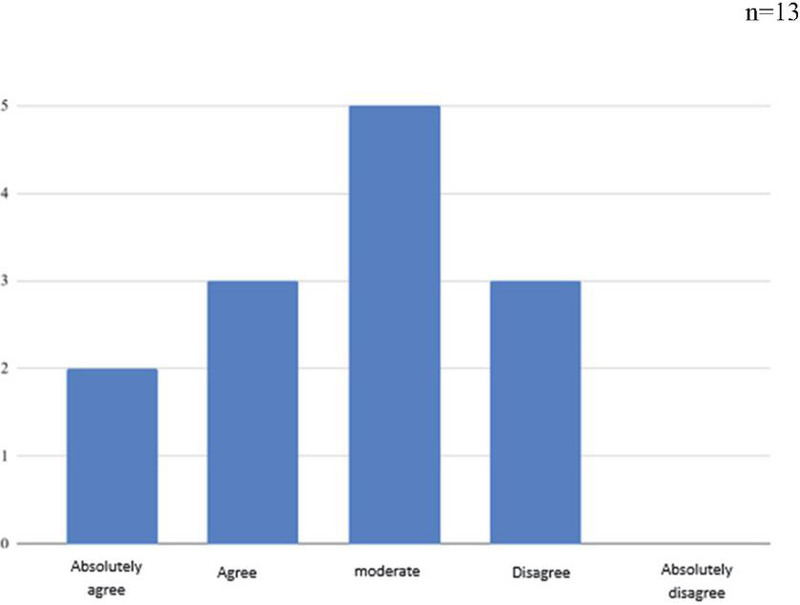
Figure 9 Satisfaction score of the system by the indicator of feeling that the system is useful (PU). Source: Authors’ own.
Figure 9 presents the evaluation of satisfaction scores for the system based on the perceived usefulness (PU) of the system by antique shops on the participating islands. The assessment is categorized into five levels. The results reveal that most shops rated the system as “moderate,” indicating a perception that the system is somewhat useful but does not fully meet their needs in certain aspects. Scores in the “agree” and “strongly agree” categories reflect high satisfaction among some shops, particularly those that recognized the system’s ability to streamline operations or improve waste management efficiency. For instance, the rich menu feature was acknowledged for saving time and reducing errors in data management in certain areas.
However, scores in the “disagree” category highlight usability challenges faced by some shops. These include overly complex rich menu designs or insufficient guidance for elderly users or those with limited technological experience. Shops encountering these difficulties often lacked prior exposure to technology, further emphasizing the need for system enhancements.
The distribution of scores underscores the diversity in user needs and expectations. Shops that rated the system as “moderate” expressed the need for improvements, such as simplifying the menu design or providing user-friendly manuals. In contrast, shops that gave higher ratings tended to have prior experience and demonstrated greater adaptability to the system. These findings highlight the necessity of refining the system to accommodate a broader range of users. Designing a system that caters to the diverse requirements of its users and enhancing understanding of the PU indicator could increase satisfaction levels and encourage broader adoption.
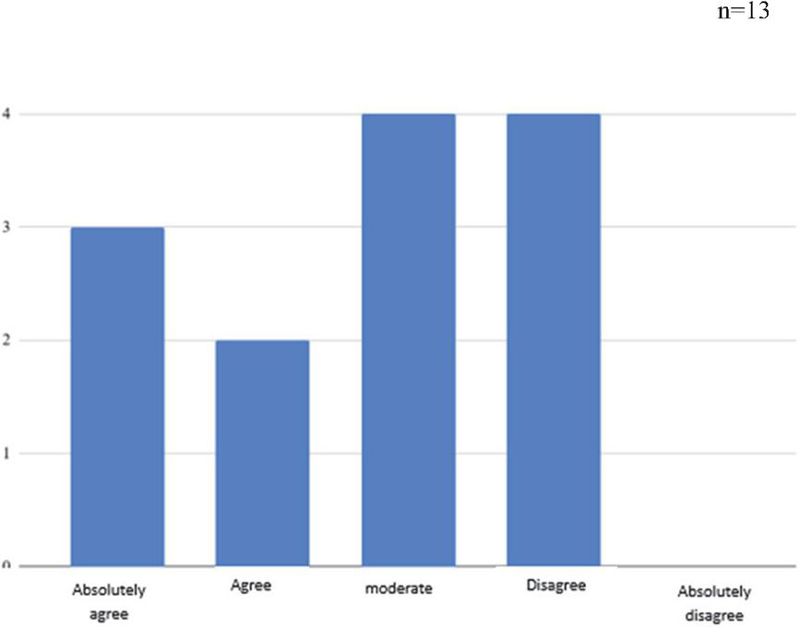
Figure 10 Satisfaction score of the system by the perceived ease of use (PEOU) indicator. Source: Authors’ own.
The analysis of satisfaction scores among antique shops on the participating islands regarding the system, specifically on the indicator of perceived ease of use (PEOU), reveals a wide distribution of opinions, as shown in Figure 10. Some users reported high ease of use, with ratings of “strongly agree” and “agree,” reflecting the effectiveness of the system’s design, particularly in features that simplify operations. For instance, the rich menu was noted for reducing complexity in data recording processes.
However, the majority of users rated the system as “moderate” or “disagree,” suggesting areas for improvement to better accommodate the diverse needs of users, particularly those unfamiliar with technology. These limitations are attributed to factors such as users’ lack of technological knowledge or skills and the complexity of certain processes, such as uploading data or navigating the interface. To address these challenges, the system may benefit from enhancements, such as the development of comprehensive user manuals and the simplification of features to minimize complexity and improve usability.
The findings highlight the critical role of perceived ease of use (PEOU) in fostering acceptance and adoption of new systems, particularly in contexts involving user groups with varying levels of technological proficiency. Improving ease of use could enhance the system’s long-term efficiency and support the project’s goal of developing a sustainable platform for waste and recycling management on the islands.
These results align with the technology acceptance model (TAM), which identifies PEOU as a key determinant of new technology adoption. Accordingly, the study recommends that the LINE OA development team prioritize improving usability-related features, provide robust training support, and create user experiences tailored to diverse target groups. These efforts are expected to increase user satisfaction and acceptance while enhancing the practical outcomes of the project.
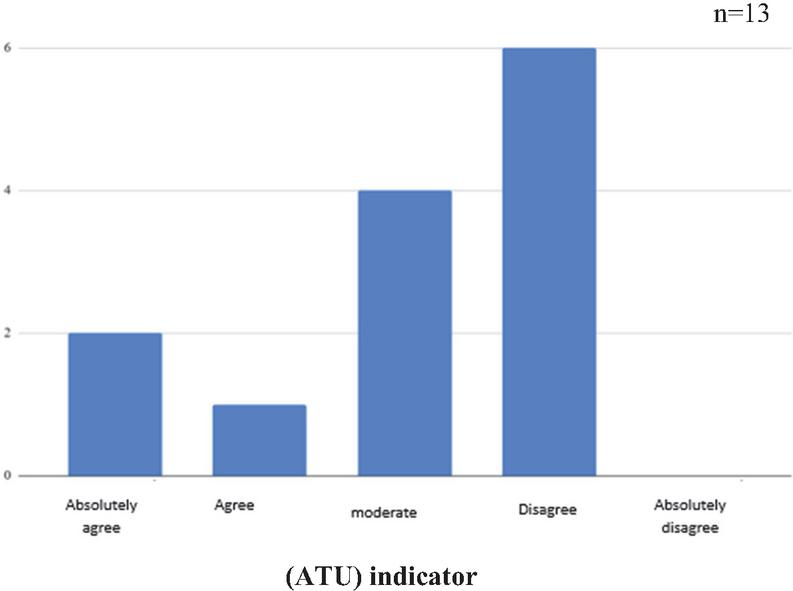
Figure 11 The system acceptance value of positive attitude towards usage. Source: Authors’ own.
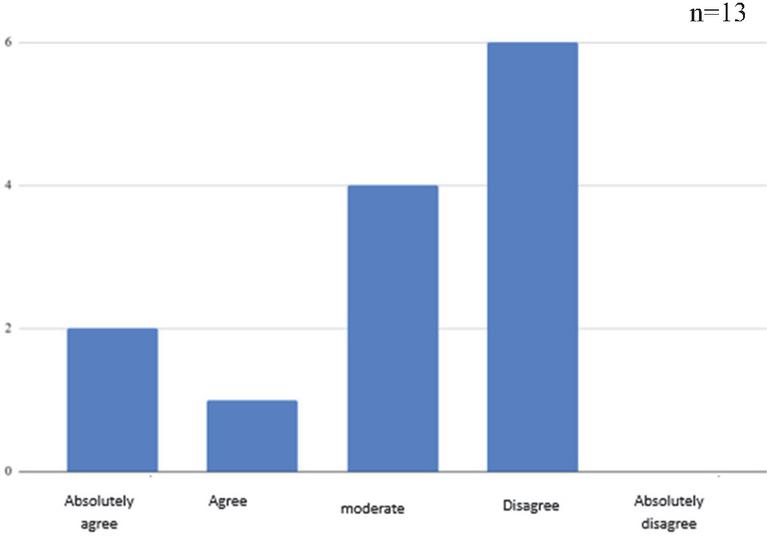
Figure 12 The system acceptance value of usage intention indicator (BI). Source: Authors’ own.
Figures 11 and 12 show the analysis of user acceptance of the system based on two critical indicators: attitude toward using (ATU) and behavioral intention to use (BI). These indicators are significant in reflecting user readiness and demand for the system among the target groups.
Figure 11 depicts user acceptance in terms of ATU. The largest group comprises users classified as “not accepting” (6 users), followed by those in the “moderate” category (4 users). Meanwhile, the “highly accepting” and “accepting” categories represent the smallest groups (3 users), with no users falling under “strongly not accepting.” These findings indicate that positive attitudes toward system usage remain at a low to moderate level. Factors influencing attitude include interface complexity and insufficient guidance, particularly among users unfamiliar with technology.
Similarly, Figure 12 presents BI scores, which align closely with the ATU results. The “not accepting” group is the largest (6 users), followed by the “moderate” group (4 users), while the “highly accepting” and “accepting” groups are the smallest (3 users). This reflects a low level of behavioral intention to use the system, attributed to unmet user expectations and suboptimal user experiences for some target groups.
The evaluation of the developed system was anchored on two critical indicators from the technology acceptance model (TAM): attitude toward using (ATU) and behavioral intention (BI). These metrics serve as vital reflections of user readiness and the overall demand for digital waste management tools among the target groups.
Quantitative findings and distribution. As illustrated in Figures 11 and 12, the distribution of ATU and BI scores follows a remarkably similar pattern. The largest segment of participants was classified as “not accepting” (6 users, or 46.2%), followed by those in the “moderate” category (4 users). Conversely, the “accepting” and “highly accepting” categories represented the smallest groups (3 users combined). These findings suggest that while there is a core group of early adopters, the overall positive attitude and intention to use the system remain at a low to moderate level.
The close alignment between ATU and BI values validates the core premise of TAM – that a user’s internal attitude is a primary determinant of their behavioral intention. The data indicates that users with positive perceptions of the system’s utility exhibit a higher propensity for adoption, whereas those with negative or neutral attitudes demonstrate lower engagement.
Barriers to adoption and system performance. The high non-adoption rate (46.2%) can be attributed to several significant barriers identified during the study. Despite the system’s high perceived usefulness (PU) – specifically its capacity to enhance operational efficiency and reduce data recording time – the perceived ease of use (PEOU) was significantly hindered by external factors. Key obstacles included:
• Demographic factors: Age and varying levels of digital literacy among island-based users were critical determinants of acceptance.
• Technical constraints: Insufficient guidance and complex interface navigation proved challenging for users unfamiliar with digital platforms.
• Hardware compatibility: Technical limitations of certain mobile devices used by participants prevented the system from functioning at its full capacity.
The qualitative data derived from open-ended questions elaborates on these quantitative results. Consistent users reported that the system facilitated greater convenience and expedited data reporting compared to traditional paper-based documentation. These experiential factors – convenience, speed, and reduced administrative burden – served as the primary drivers maintaining high ATU and BI scores among the adopting group.
Recommendations for system enhancement. To improve the adoption rate and foster more positive attitudes, the following redesign actions are proposed:
• Interface simplification: Redesigning the rich menu and reducing menu depth to accommodate older users or those with limited technological experience.
• Instructional support: Providing guided step-by-step workflows through instructional videos or simplified manuals.
• Contextual optimization: Tailoring system functions to suit the specific environmental and logistical contexts of different islands.
As illustrated, while the system demonstrates significant potential for improving waste management reporting, its success is heavily dependent on addressing the gap between technical functionality and user digital literacy. Future iterations must focus on inclusive design to ensure that the benefits of digital transformation are accessible to all stakeholders in the recycling ecosystem.
5 Conclusion
The findings of this study underscore the significant potential of the island recycle waste management system to mitigate the limitations of conventional, paper-based data management in small island contexts. By digitizing reporting processes through the LINE OA platform, the system enhances data integrity and streamlines the reporting workflow. However, the study identifies a critical gap between technological functionality and practical adoption, evidenced by a 46.2% non-adoption rate among the pilot group.
Key findings on technology acceptance. Analysis grounded in the technology acceptance model (TAM) confirms that perceived usefulness (PU) and perceived ease of use (PEOU) are pivotal determinants of attitude toward using (ATU) and behavioral intention (BI). While participants with higher digital literacy reported moderate-to-high satisfaction, adoption remained uneven. The results reveal that high PU alone (efficiency and time-saving) could not fully overcome low PEOU caused by demographic barriers, specifically among elderly users who struggled with the complex rich menu structure and small typography. This highlights that for sustainable waste management systems, inclusivity in design is as crucial as technical efficiency.
Strategic recommendations for system enhancement. To bridge the identified usability gaps and foster long-term scalability; the study proposes the following redesign actions.
• Inclusive user interface (UI): Simplifying the rich menu navigation and enlarging typography to accommodate users with diverse technological competencies, particularly the elderly.
• Automated data entry: Integrating features such as OCR (optical character recognition) for receipt scanning to reduce manual input and minimize cognitive burden on the users.
• Educational intervention: Transitioning from passive manuals to active training programs, including multimedia tutorials and hands-on guidance, to build user confidence.
In conclusion, while this pilot-level implementation demonstrates the system’s ability to improve data accuracy and reporting speed, its long-term success depends on addressing user-related barriers. By focusing on human-centric design and targeted training, the system can provide a more inclusive and sustainable solution for waste management in island communities.
References
[1] Center for Circular Economy Research for a Zero-Waste Thailand (CEWT), School of Science, Mae Fah Luang University. (2024, February 23). Final report: A study on sustainable waste and recyclable material management on islands.
[2] Chan, C. M. L., and Teoh, S. Y. (2019). A systematic literature review of digital technologies for waste management. Waste Management Research, 37(1), 1–15.
[3] Davis, F. D. (1989). Perceived usefulness, perceived ease of use, and user acceptance of information technology. MIS Quarterly, 13(3), 319–340.
[4] Ellen MacArthur Foundation. (2013). Towards the circular economy: Economic and business rationale for an accelerated transition.
[5] Kemavuthanon, K. (2025). An augmented reality-based hazardous waste management learning system: A case study of elementary school students in Chiang Rai province. 2025 Joint International Conference on Digital Arts, Media and Technology with ECTI Northern Section Conference on Electrical, Electronics, Computer and Telecommunications Engineering (ECTI DAMT & NCON), Nan, Thailand, 157–161.
[6] Kemavuthanon, K., Manomaivibool, P., & Eungwanichayapant, A. (2022). System design of a toxic waste management system empirical study for Chiang Rai province. 2022 6th International Conference on Information Technology (InCIT), Nonthaburi, Thailand, 157–161.
[7] Line Corporation. (2022). LINE Official Account developer guide. https://developers.line.biz/en/docs.
[8] Manomaivibool, P., Mongkonkorn, S., Unroj, P., and Dokmaingam, P. (2018). Chiang Rai Zero Waste: Participatory action research to promote source separation in rural areas. Resources, Conservation and Recycling, 136, 142–152.
[9] Marangunić, N., and Granić, A. (2015). Technology acceptance model: A literature review from 1986 to 2013. Universal Access in the Information Society, 14(1), 81–95.
[10] Ministry of Natural Resources and Environment, Thailand. (2020). National waste management strategy.
[11] Song, M., and Park, J. (2020). Enhancing communication efficiency with Line Official Accounts: A case study in Japan. Journal of Business Communication, 57(2), 123–140.
[12] United Nations Environment Programme (UNEP). (2021). Sustainability and waste management: Principles and practices. https://www.unep.org.
[13] Unmuang, M., Manomaivibool, P., Eungwanichayapant, A., Kemavuthanon, K., and Charoenroop, N. (2019). Using information and communication technology to support the management of household hazardous waste: A case of Chiang Rai Provincial Administrative Organization. Proceedings of the 45th Congress on Science and Technology of Thailand (STT 45), A247, 340–341.
[14] Venkatesh, V., Thong, J. Y. L., and Xu, X. (2012). Consumer acceptance and use of information technology: Extending the unified theory of acceptance and use of technology. MIS Quarterly, 36(1), 157–178.
[15] Weng, Y. C., and Fujiwara, T. (2011). Examining the effectiveness of municipal solid waste management systems in China. Waste Management, 31(4), 1220–1230.
Biographies

Kemachart Kemavuthanon received his bachelor’s degree in information technology and his master’s degree in information technology management and in information science and technology from the Mahanakorn University of Technology, Bangkok, Thailand, and his Ph.D. degree in information science and technology from the School of Engineering, Tokai University, Japan. He is currently a lecturer in digital and communication engineering with the School of Applied Digital Technology, Mae Fah Luang University, Thailand. His research interests include applied applications, game design and development, game engines, and game artificial intelligence. He also focuses on computer simulation and visualization, virtual reality (VR), augmented reality (AR), mixed reality (MR), the Internet of Things (IoT), machine learning, natural language processing, web applications, mobile applications, and waste management systems.

Samatthachai Yamsa-ard is a lecturer at Mae Fah Luang University’s School of Management with a Ph.D. in Management from NEOMA Business School, France. Specializing in digital transformation and value chain management, he combines academic expertise with practical experience from roles in the manufacturing sector, focusing his research on supply chain optimization and logistics innovation.

Panate Manomaivibool holds a Ph.D. in industrial and environmental economics from IIIEE, Lund University, Sweden. He is now an assistant dean for academic services and sustainability management at Burapha University International College (BUUIC). He has extensive research experience in circular economy, extended producer responsibility, and solid waste management.

Yu Liu holds an M.A. in Teaching Chinese as a Foreign Language from Mae Fah Luang University, Thailand. She is now teaching Chinese at Burapha University International College (BUUIC). She has research experience in teaching and linguistic studies. She has also assisted in several environmental research projects.
Journal of Mobile Multimedia, Vol. 22_1, 63–96
doi: 10.13052/jmm1550-4646.2213
© 2026 River Publishers