Realism and Credibility in Mobile Virtual Environments: User Engagement with VR and 360∘ Video in a Virtual Coffee Shop
Banphot Nobaew
School of Applied Digital Technology, Mae Fah Luang University, Chiang Rai, Thailand
banphot@mfu.ac.th
ORCID: 0000-0002-4795-0826
Received 02 August 2025; Accepted 01 October 2025
Abstract
This study applied a within-subjects experimental design to examine user engagement, perceived realism, and credibility when experiencing a virtual organic coffee shop through two immersive formats: Virtual Reality (VR) and 360∘ video. The VR system recreated a Hmong hill tribe café in Chiang Rai, Thailand, while the 360∘ video documented the authentic organic coffee production process from seed to roast. Forty-one participants experienced both systems in a counterbalanced order. The findings revealed a complex pattern of results: while initial Wilcoxon signed-rank tests found no significant differences between formats when comparing individual matched variables (p 0.05), comprehensive analysis with Benjamini-Hochberg corrections revealed that VR demonstrated significantly superior presence (Z 4.10, p 0.001, r 0.64), engagement (Z 4.50, p 0.001, r 0.70), and spatial realism (Z 3.85, p 0.002, r 0.60) with large effect sizes. A mixed-effects ordinal regression model confirmed VR’s advantage in purchase intent ( 0.68, p 0.011). Crucially, system usability emerged as a critical factor, showing very strong correlations with both overall user experience ( 0.82, p 0.001) and purchase intent ( 0.70, p 0.001) regardless of medium. The relationship between perceived authenticity and satisfaction was particularly strong ( 0.55, p 0.001), while presence ( 0.42, p 0.006) and credibility ( 0.46, p 0.003) showed moderate positive associations with purchase intent. These findings demonstrate that while the measurement approach significantly influences detected differences between immersive media, the translation of immersion into consumer behaviour depends on multiple psychological factors, including usability, credibility, and authenticity, rather than the choice of medium alone.
Keywords: Virtual reality, 360∘ video, perceptual realism, user engagement, mobile multimedia.
1 Introduction
Virtual Reality (VR) is a simulated environment where users experience virtual reality through a head-mounted display (HMD) and linked clothing [1]. Virtual reality should be defined as a simulation of the real world or an imagined environment in which users can perceive and interact. 360∘ video refers to immersive virtual reality footage captured in real-world settings using a 360-degree video camera. In addition, VR is an immersive and interactive system which relies on reliable information. The key features that distinguish virtual reality consist of three aspects which are immersion, interactivity and the intensity of information. People can achieve immersion through devices which make them feel of transportation into another place; this will effectively isolate their senses. The interaction occurs as a result of the computer’s capability to change the viewpoint of the scene. The information intensity refers to the concept of characteristics exhibited by telepresence entity, demonstrating a degree of intelligence. This can be provided by a virtual world [2]. The HMD stimulates the virtual world; this world creates a sense of immersion in both VR and 360∘ video environments. The two technologies – VR and 360∘ video are emerging media; they visualise to simulate real-world environments. The virtual world generates the sense of being there in which people are immersed and engage in experiences. VR and 360∘ video have integrated knowledge from previous disciplines including film, games, edutainment and interactive media. While VR allows users to interact with computer-generated environments, 360∘ video can provide an overview of a real-world scene that viewers can explore with a change in image orientation. This world allows users to perceive the scene from different angles. The HMDs from the two visual technologies deliver users a wide field of view and 3D stereovision and create an immersive experience for them. Adjusting the image orientation lets people explore a real-world environment from different angles in the 360∘ video. There are many trials of designing actual VR and 360∘ video; these must be addressed. It can include a level of presence, motion sickness, degree of interaction, and a coherent story. Furthermore, scholars require different design approaches for several VR and 360∘ video applications based on their purposes, contents, and audiences.
In this paper, the author will present the concept of creating a perceptual experience for 360∘ video and virtual reality applications. The aims to provide an immersive experience through users’ perceptual realism. Perceptual realism in VR indicates the level of virtual settings and experiences that replicate physical world perception and make audiences feel like they are in the real world. To design the perceptual experience in both technologies, scholars have to consider many aspects of theoretical approaches, such as perspective dimensions, perception quality, user interface (UI), accessibility, user awareness and spatial audio. In this research, I chose an organic coffee shop of the hill tribe as the case study. Later, the shop owner utilized a social media platform for customer communication and advertising channels. The 360∘ video and VR were applied to build the virtual online café shop in order to improve the perceptual experience of the customer. Virtual reality provides users with the great opportunity to immerse into the simulated environment that they could not reach in everyday life. This simulation world helps people sense the reality of the shopping environment and atmosphere. It might support the shop’s credibility and gain the confidence and trust of the customers. That is the main concern and problematic issue for the ordinary online shop nowadays. However, it might be difficulty for users using the virtual reality shop is that they don’t know what they should do in the VR system. Because this is a new technology, sometimes many barriers can occur, such as user interaction, images, or descriptions that might mislead. Consequently, the customers will get stuck in the system. Therefore, this study will address these useability issues in the investigation. The result will be used to improve the VR online café which users can see the product from any angle.
Perceptual realism encompasses visual, audio, tactual, spatial, and interactive realism; this realism targets creating a sense of full presence and immersion in the simulated world. It involves the accurate replication of sensory inputs and physical experiences in imitation environments. This paper intends to compare the design and realism of 360∘ videos and virtual reality in order to identify their similarities and differences. In the result, findings from the study and implications for perceptual realism will be described and discussed.
2 Literature Review
2.1 Virtual Retail Environments and Consumer Experience
Virtual reality technology has emerged as a transformative medium for retail experiences, creating pragmatically alternative environments where consumers can engage with products and services in unprecedented ways [2]. Unlike traditional e-commerce platforms, VR-based retail environments provide immersive shopping experiences that bridge the gap between physical and digital commerce. Studies indicate that virtual reality greatly influences consumers’ emotional states and their perception of store attractiveness, with 360∘ VR stores demonstrating higher appeal and satisfaction compared to traditional websites [3]. The integration of VR in retail settings fundamentally alters consumer behavior and decision-making processes. Jin et al. [3] found that consumer store experiences through virtual reality significantly affect emotional states and perceived store attractiveness, suggesting that immersive technologies can enhance retail engagement beyond conventional digital interfaces. Similarly, Lo and Cheng [4] demonstrated that VR technology effectively promotes consumer engagement, with their study of 203 participants revealing that VR 360∘ videos create a strong sense of presence that influences attitudes toward products and purchase intentions.
2.2 Perceptual Realism in Immersive Media
Perceptual realism in virtual environments encompasses the subjective and objective dimensions of how users perceive and interact with digital spaces. Research on realism perception has identified key factors determining perceived realism, including physical presence, physiological presence, cognitive presence, and environmental authenticity [5]. This multifaceted construct differs from simple visual fidelity, incorporating sensory, behavioral, and psychological components that collectively shape user experience. The distinction between subjective and objective realism is crucial for understanding virtual retail environments. Subjective realism refers to individual perceptual experiences when presented with virtual scenes, while objective realism concerns how well virtual environments respond to user interactions based on real-world expectations [6–9], and [10]. In retail contexts, this translates to how convincingly a virtual store replicates the sensory and interactive aspects of physical shopping experiences. Stachoò et al. [11] demonstrated that environmental realism significantly affects user navigation and decision-making, with participants showing enhanced wayfinding abilities in more realistic virtual environments. This finding has direct implications for virtual retail design, where spatial navigation and product discovery are essential components of the shopping experience. The study revealed that color hue and environmental fidelity influenced participants’ selection of points of interest, suggesting that visual design elements play a critical role in guiding consumer attention and behavior in virtual stores.
2.3 Presence and Immersion in Virtual Commerce
Presence represents a fundamental psychological state in virtual retail experiences, defined as the subjective experience of being in one place while physically situated in another [12]. In commercial VR applications, presence directly impacts consumer trust, engagement, and purchase intentions. Lombard and Jones [12] identified presence based on realism as encompassing both perceptual and social dimensions, each contributing to the overall authenticity of virtual shopping experiences. The concept of presence in virtual retail extends beyond simple immersion. Lee [13] delineates three types of presence relevant to commercial applications: physical presence (the sensation of being located within the virtual store), social presence (feeling connected to other shoppers or sales representatives), and self-presence (maintaining personal identity within the virtual environment). These dimensions collectively influence how consumers perceive and interact with virtual retail spaces, affecting their willingness to make purchase decisions. Slater’s [14] framework of Place Illusion (PI) and Plausibility Illusion (Psi) provides crucial insights for virtual retail design. PI creates the sensation of “being there” in the virtual store, while Psi generates the impression that the shopping experience is genuinely happening. When both illusions are effectively maintained, consumers respond to virtual products and environments as if they were real, potentially leading to increased engagement and conversion rates.
2.4 Technical Factors Influencing Perceptual Realism
The technical implementation of virtual retail environments significantly impacts perceptual realism and user experience. Visual fidelity, including resolution, texture mapping, and lighting, plays an essential role in creating convincing virtual stores [7]. Studies have shown that higher-resolution displays and improved graphic quality lead to stronger presence and increased purchase confidence among consumers. Audio design represents another critical factor in virtual retail environments. Realistic audio paired with high-quality visuals enhances the shopping experience, making virtual stores more compelling and lifelike [15]. Spatial audio technologies, including binaural audio and sound propagation algorithms, contribute to presence by creating authentic soundscapes that match visual environments [16]. In retail contexts, this might include ambient store sounds, product demonstration audio, or interactive sound feedback that reinforces user actions. The integration of haptic feedback systems, though less common in consumer VR applications, shows promise for enhancing product interaction realism [17]. While current implementations primarily rely on controller vibration, emerging technologies, including gloves and bodysuits could enable consumers to “feel” product textures and weights, potentially increasing confidence in online purchase decisions.
2.5 360∘ Video in Virtual Commerce
360∘ video technology offers an alternative approach to immersive retail experiences, providing panoramic views of real-world stores and products. Research in 360∘ video visualization has identified key factors for creating compelling commercial content, including camera placement, field of view optimization, and stitching quality [18, 19]. These technical considerations directly impact how consumers perceive product authenticity and store credibility. The documentary nature of 360∘ video can enhance perceived authenticity in ways that computer-generated VR cannot replicate. By capturing actual retail environments and production processes, 360∘ video provides transparency that builds consumer trust. This is particularly relevant for products where origin, craftsmanship, or production methods influence purchasing decisions, such as organic foods, artisanal goods, or luxury items. However, the passive nature of 360∘ video presents limitations compared to interactive VR. While 360∘ video can effectively showcase spaces and processes, it lacks the interactive capabilities that allow consumers to manipulate products, customize options, or navigate freely through virtual stores. This trade-off between authenticity and interactivity represents a key consideration for retailers choosing between immersive technologies.
2.6 Consumer Behavior in Virtual Environments
Understanding how consumers behave in virtual retail environments requires examining the psychological and behavioral factors that influence their experiences. Coherence, defined as the internal logical consistency of the virtual experience, significantly impacts consumer trust and engagement [20]. In retail contexts, coherence encompasses product presentation consistency, logical store layouts, and predictable interaction patterns that align with consumer expectations from physical shopping. Authenticity measures whether virtual retail experiences meet users’ expectations and is closely connected to perceived realism [21, 22]. Consumers evaluate virtual stores not only on technical fidelity but also on whether the experience feels genuine and trustworthy. This includes factors such as accurate product representations, realistic pricing displays, and credible brand presentations that maintain consistency with real-world retail standards. The integration of social elements in virtual retail environments represents an emerging area of research. Social presence, including interactions with virtual sales associates or other shoppers, can enhance the authenticity of virtual shopping experiences. Skarbez et al. [23] introduced concepts of “Social Presence Illusion” and “Copresence Illusion,” which describe how virtual or mediated social interactions create feelings of community and shared experience that mirror physical retail environments.
2.7 Research Gap
While prior research has extensively investigated individual aspects of VR and 360∘ video technologies, limited empirical studies have directly compared their effectiveness in retail contexts using comprehensive measurement frameworks. Specifically, there is a gap in understanding how different immersive media formats influence consumer trust, perceived authenticity, and purchase intentions in everyday commercial settings such as local coffee shops or small businesses.
Furthermore, existing literature has primarily focused on technical aspects of immersive media or psychological theories of presence, with less attention to practical applications in real-world retail scenarios. Few studies have employed mixed-methods approaches combining quantitative metrics with qualitative user feedback to understand the nuanced differences between VR and 360∘ video in commercial applications.
This study addresses these gaps by empirically evaluating perceptual realism in a virtual coffee shop context, comparing VR and 360∘ video technologies through both statistical analysis and predictive modeling. By focusing on a specific retail application with clear commercial objectives, this research provides actionable insights for businesses considering immersive technologies for customer engagement and sales conversion.
3 Objectives and Hypothesis
The The primary purpose of this study is to analyse the effects of immersive virtual environments on users’ behaviour and experience – focusing specifically on a virtual coffee shop case study. Additionally, the study will investigate how the realism of the virtual world affects people’s decision-making. It also seeks to understand how 360-degree video content can improve consumers’ virtual experiences. Furthermore, it explores how such content influences consumers’ interest in product information presentation.
Drawing from established theoretical frameworks including presence theory [12], and Place Illusion and Plausibility Illusion framework[14], this study tests four hypotheses regarding the comparative effects of VR and 360∘ video technologies in virtual retail environments:
H1. System Usability and Technology Adoption
Drawing from the presence theory [12] and usability research in virtual environments [24], positive user experiences with the virtual coffee shop system – specifically ease of access, navigation fluidity, and avatar movement control – will be positively associated with (a) higher overall engagement scores, (b) increased presence in the virtual environment, and (c) greater intention to use virtual shopping systems in the future.
H2. Perceptual Realism and Purchase Behavior in Virtual Environments
Drawing from framework of Place Illusion and Plausibility Illusion [14], higher levels of perceived realism in virtual environments will be positively associated with (a) increased presence scores, (b) enhanced user engagement, and (c) greater purchase intent within the virtual system, with these effects expected to be stronger in interactive VR environments than in passive 360∘ video experiences.
H3. Documentary Authenticity in 360∘ Video
Based on theories of media credibility and documentary realism [12], 360∘ video experiences will demonstrate advantages over VR in (a) perceived authenticity of product origin information, (b) trust in production process documentation, and (c) credibility of product quality representations, due to the documentary nature of real-world footage versus computer-generated environments.
H4. Comparative Medium Affordances for Virtual Retail
Consistent with presence theory and empirical findings on immersive media [23], VR environments will demonstrate superior outcomes in (a) spatial presence, (b) user engagement metrics, and (c) behavioral intent measures, while 360∘ video will show comparative advantages in (d) information credibility and (e) perceived authenticity, suggesting complementary rather than competing affordances between the two media formats for virtual retail applications.
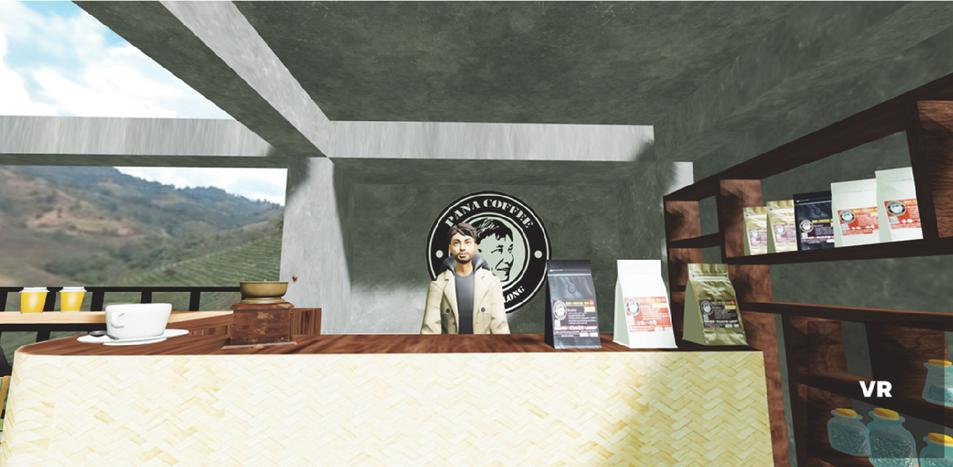
Figure 1 Screenshots of the VR coffee shop.
(Note: Images represent actual visual quality experienced by participants, captured from 8K source resolution but limited by 360∘ perspective processing constraints inherent to the technology.)
4 Methodologies
4.1 Experimental Design Participant
This study utilised a within-subjects experimental design to examine differences in user engagement, perceived realism, and credibility between two immersive media formats: Virtual Reality (VR) and 360∘ video(see Appendix B). VR coffee shop (see Figure 1) is an explorable digital environment inspired by a real Hmong tribal café in Chiang Rai, Thailand. In parallel, 360∘ video is documentary-style, first-person immersive video of organic coffee production, from seed to roast (see Figure 2). Each of the 41 participants experienced both conditions – VR and 360∘ video – in counterbalanced order to mitigate potential order or carry-over effects. Exposure order was randomly assigned across participants, and order effects were statistically tested during analysis using Wilcoxon Signed-Rank tests to compare the sequence of exposures.
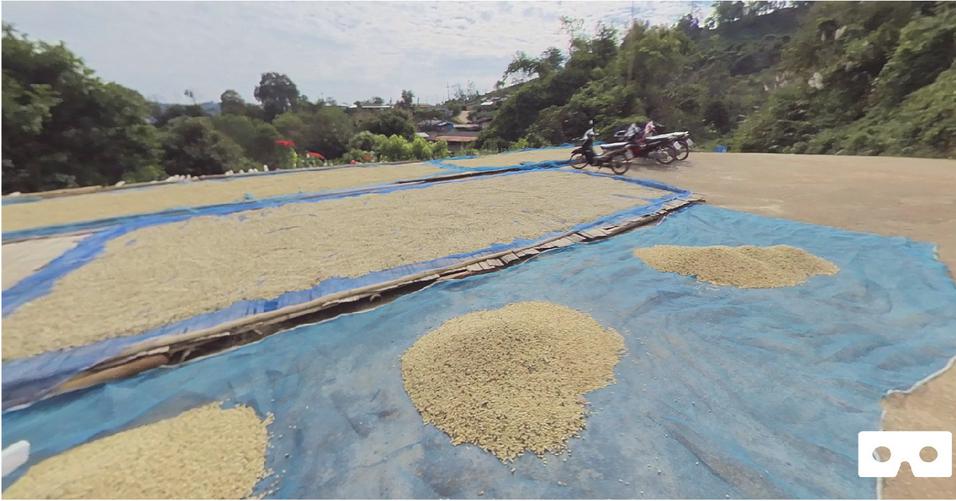
Figure 2 Screenshots of seed drying in the 360∘ video system.
(Note: Resolution quality reflects authentic user experience limitations of current 360∘ video technology rather than capture constraints.)
4.2 Recruitment and Sampling Justification
A total of 41 participants were recruited using a purposive sampling strategy targeting university students and professionals interested in immersive media or digital experiences. While no formal control group was established, the within-subjects design allowed each participant to serve as their own control across both conditions.
We acknowledge the absence of a formal a priori power analysis due to practical constraints. However, post hoc sensitivity analysis using G*Power indicated that with n 41 and alpha 0.05, the study had sufficient power (0.80) to detect medium-to-large effects (r 0.4) using non-parametric tests.
4.3 Originality and Setup Context
To enhance the originality and relevance of this study, we reframe the virtual coffee shop not simply as a representation of a 3D space, but as a design case that simulates immersive consumer experiences using cost-effective, deployable VR/360∘ tools intended for small businesses or educational contexts in Southeast Asia. Unlike earlier VR studies, our work incorporates contemporary multimedia tools and user-generated feedback to design the retail experience with real-time usability implications. The study builds on emerging trends in mobile multimedia adoption rather than relying on legacy VR systems. The questionnaires collected statistical and qualitative data, based on prior research on perceptual realism and presence in virtual reality [24–28], specifically the presence questionnaire from Presence, 7(3), 225–240. They are divided into three parts: personal information and an initial interview; post-testing information using the System Usability Questionnaire (SUQ), Experience Questionnaire (EQ), and Presence Questionnaire (PQ) to gather quantitative data on participants’ perceptions of realism and credibility in VR and 360∘ video and in-depth interview to qualitatively assess participants’ virtual coffee shop visits and their perceptions.
4.4 Procedure and Ethical Compliance
Participants were individually briefed and provided informed consent before the commencement of the experiment. Ethical approval was granted by the Mae Fah Luang University Human Research Ethics Committee (Ref: MFU-ICT-2566-RE). Participation was voluntary, and respondents were allowed to withdraw at any time without consequences. The study was conducted in a controlled laboratory environment, ensuring consistency in device use (Meta Quest 2 for VR, high-resolution monitor for 360∘ video) and sound system. Each participant completed both media conditions with a 5–10 minutes break between sessions to reduce fatigue(motion sickness). The VR experience involved interactive exploration of a virtual coffee shop environment, while the 360∘ video provided a guided narrative of organic coffee production from seed to roast. The full VR experience will be hosted on: panacoffee-research.mfu.ac.th.
4.5 Measurement Tools and Data Collection
The study collected data from participants by (a) evaluating the virtual coffee shop model and 360∘ video system, (b) administering questionnaires with quantitative ratings and qualitative responses, and (c) conducting semi-structured in-depth interviews.The study used standardised instruments:
• Presence Questionnaire (PQ) – PQ was used to measure the sense of presence, focusing on subscales related to spatial presence and perceived realism. Reliability was high (Cronbach’s 0.87).
• Engagement Questionnaire (EQ) – measured user engagement and overall satisfaction with each experience. Reliability was high (Cronbach’s 0.84).
• System Usability Questionnaire (SUQ) – assessed perceived ease of access, navigation, and interaction with the user interface. Reliability in the current sample was acceptable (Cronbach’s 0.81).
A full codebook for all variables is provided in Table 0 Classification of variables for the study on virtual coffee shop system and 360∘ video experience (included in Appendix A), which maps V17–V27 to full item texts, subscales, and codes. The variables are grouped into three categories: demographic information, use of the virtual coffee shop system, and 360∘ video experience. Spearman’s rank correlation, the Wilcoxon Signed-Rank Test, False Discovery Rate (FDR) and Effect sizes (r) and 95% confidence intervals (CIs) are the statistical methods used for hypothesis testing. Additionally, narrative analysis is employed to assess participants’ experiences and feedback.
4.6 Statistical Analysis
Statistical analyses included:
• Wilcoxon Signed-Rank Tests to compare paired responses between VR and 360∘ conditions.
• Spearman’s for correlation between presence, realism, credibility, and purchase intent.
• False Discovery Rate (FDR) correction using the Benjamini-Hochberg procedure for multiple pairwise tests.
• Effect sizes (r) and 95% confidence intervals (CIs) reported for all inferential results.
4.7 Instrument Reliability
Before hypothesis testing, the internal consistency of the multi-item scales used to measure the user experience in both the VR and 360∘ video conditions was assessed using Cronbach’s Alpha. The reliability for the VR experience scale (5 items) was excellent ( 0.93), and the reliability for the 360∘ video experience scale (6 items) was also high ( 0.90). These results indicate that the measurement instruments were reliable.
5 Results
5.1 Descriptive Statistics
The demographic information reveals that a sample of 41 people completed both immersive experiences, all over 28.7 years old, participated in this study. Women accounted for 75.6% of the participants and had a bachelor’s degree of 65.9%. Individuals from various ethnic backgrounds were included in the sample, with the majority being Thais, 78.0%, and a smaller proportion being Aka (7.3%). In the field of work, participants were involved in different roles, including pre-bachelor’s degree students 43.9%, governmental officials 24.4%, employees from all sectors 14.6% and individuals engaged in agriculture and other professions 12.2%. Regarding income, most made more than 15,000 Baht per month or 39.0%, while a small minority managed to earn up to 3,000–6,000 Baht per month (24.4%).
Coffee consumption behaviour: According to the participants, 1.12 cups of coffee daily were consumed on average, and most drank more than one cup daily at 34.2%. Fresh coffee (Arabica) was the most commonly consumed type (46.3%), followed by instant or canned coffee (Robusta) (29.3%). In total, 26.8% of participants reported making their coffee drinks, while 70.7% did not order roasted coffee beans or ground coffee to prepare themselves. In the future, however, only 68.3% indicated that they would like to order and cook their beverages using roasted coffee beans or ground coffee.
Participants have found that through interactive Web applications, VR headsets and virtual reality glasses, it is easy for them to access a virtual coffee shop system, 73.2%. The majority strongly agreed upon or endorsed the ease with which users could access and view a virtual store. In a virtual coffee shop environment, the participants found it convenient to move an avatar, and 61% of them agreed. Positive feedback was given, with most participants finding the user interface and navigation device Navigator efficient and easy to use when working in an interactive coffee shop. The virtual coffee shop system provided participants a favourable user experience, as they found product information and 360∘ videos easily accessible.
In comparison to other forms of media, such as websites, most participants agree that virtual reality helps increase product reliability. In addition to contributing to their perception of product reliability, users appreciated that they could view and interact with products in a virtual coffee shop. An increase in the size of the store, the addition of more furniture for customer comfort and the incorporation of different sound systems to create a more realistic atmosphere were suggested as improvement measures on the virtual system.
Challenges and feedback to using 360∘ video: interviewees have indicated that using 360-degree videos makes them feel as if they were there in specific places, such as among farmers who observe a product’s origin.
A summary of the descriptive statistics for the main experiential variables is presented in Table 1. Participants generally rated both the VR and 360∘ video experiences favorably. For most variables, the median score was 6.0 on a 7-point scale, indicating a positively skewed distribution and a high level of satisfaction across both formats.
Table 1 Descriptive statistics for VR and 360∘ video experience variables
| Format | Variable (Construct) | Mean | Median | SD |
| VR | V17: Immersion (Presence) | 5.85 | 6.0 | 1.15 |
| V21: Overall Exp. (Engagement) | 5.88 | 6.0 | 1.05 | |
| V19: Credibility | 5.76 | 6.0 | 1.12 | |
| 360∘ Video | V22: Realism (Presence) | 5.83 | 6.0 | 1.05 |
| V26: Content (Engagement) | 5.71 | 6.0 | 1.12 | |
| V23: Trustworthiness (Credibility) | 5.49 | 6.0 | 1.28 |
(a) Hypothesis 1: System Usability and Technology Adoption
The user experience analysis in the Virtual Coffee Shop System demonstrates significant interactions between demographic characteristics and engagement with system features. The results indicate that participants experienced a strong sense of presence in the virtual world, with 63.4% feeling as if their real bodies had been transposed into the virtual world while wearing VR glasses. Furthermore, 51.2% of the sample group perceived the virtual cafe environment as similar to a real-world coffee shop, and 56.1% reported that they could make purchasing decisions directly through the virtual system. Additionally, 56.1% rated their virtual coffee experience as equivalent to a real-world visit.
A Spearman’s rank-order correlation (two-tailed) was conducted to examine the relationships between user demographics and engagement with key system features. The analysis revealed a significant correlation between ease of access through a website (V9) and overall user satisfaction (V14) (cof. 0.680, p 0.01), emphasising that accessibility plays a critical role in enhancing user experience. Likewise, the ability to access the system via VR glasses (V10) showed a strong positive correlation with user engagement (cof. 0.785, p 0.01), confirming that VR integration significantly contributes to immersion.
The usability of the Navigator (V12) and the movement of avatars (V11) were positively correlated (cof. 0.803, p 0.01), suggesting that users who found avatar navigation intuitive also perceived the system as more user-friendly. Additionally, the overall user interface usability (V13) demonstrated a significant positive correlation with satisfaction (V14) (cof. 0.681, p 0.01), reinforcing the importance of a well-designed interface for an engaging virtual experience. The ability to view 360-degree videos (V16) was also strongly correlated with other system aspects (cof. 0.470, p 0.01), highlighting the role of immersive video content in enhancing virtual interactions.
Demographic factors played a substantial role in shaping user experiences. For instance, average monthly income (V6) exhibited a significant positive correlation with perceived ease of use (V9) (cof. 0.569, p 0.01), indicating that users with higher income levels found the system more accessible.
These findings underscore the interplay between demographic variables and virtual system engagement, offering insights into how tailored system enhancements can optimise user experience. The strong correlations observed among system usability, VR integration, and immersive content highlight key areas for future improvements, ensuring that virtual coffee shop systems effectively meet diverse user needs and expectations.
(b) Hypothesis 2: Perceptual Realism and Purchase Behavior in Virtual Environments
The study explores the correlation between users’ experiences with a virtual coffee shop system and several variables. It considers the feeling of one’s actual body floating into the virtual world (V17) and the perceived similarity between the virtual and real worlds (V18). Furthermore, the realism of virtual coffee shops (V19) and the ability to make purchasing decisions through the virtual system (V20) are examined. The research also evaluates the overall experience of visiting a virtual coffee shop (V21), and the feeling of being in a real place provided by 360∘ videos (V22).
The study revealed a statistically significant moderate to strong positive correlation between various aspects of virtual reality and 360-degree video experience among 41 participants (Table 2). The correlation coefficients range from 0.122 to 0.746, indicating varying strengths of the relationship. Most p-values are less than 0.05, indicating statistical significance. Notably, the sensation of the real body transitioning into the virtual world (V17) has a strong positive correlation with all other aspects of the virtual reality and 360∘ video experience (0.679**, 0.701**, 0.464**, 0.654** and 0.519**) at the 0.01 level (2-tailed).
Table 2 The correlation coefficient of users’ experiences with a virtual coffee shop
| V17 | V18 | V19 | V20 | V21 | V22 | ||
| V17 | Correlation Coefficient | 1.000 | 0.679∗∗ | 0.701∗∗ | 0.464∗∗ | 0.654∗∗ | 0.519∗∗ |
| p-value | 0.001 | 0.001 | 0.001 | 0.002 | 0.001 | 0.001 | |
| V18 | Correlation Coefficient | 0.679∗∗ | 1.000 | 0.648∗∗ | 0.383∗ | 0.686∗∗ | 0.459∗∗ |
| p-value | 0.001 | 0.001 | 0.001 | 0.013 | 0.001 | 0.003 | |
| V19 | Correlation Coefficient | 0.701∗∗ | 0.648∗∗ | 1.000 | 0.348∗ | 0.746∗∗ | 0.627∗∗ |
| p-value | 0.001 | 0.001 | 0.001 | 0.026 | 0.001 | 0.001 | |
| V20 | Correlation Coefficient | 0.464∗∗ | 0.383∗ | 0.348∗ | 1.000 | 0.472∗∗ | 0.122 |
| p-value | 0.002 | 0.013 | 0.026 | 0.001 | 0.002 | 0.446 | |
| V21 | Correlation Coefficient | 0.654∗∗ | 0.686∗∗ | 0.746∗∗ | 0.472∗∗ | 1.000 | 0.640∗∗ |
| p-value | 0.001 | 0.001 | 0.001 | 0.002 | 0.001 | 0.000 | |
| V22 | Correlation Coefficient | 0.519∗∗ | 0.459∗∗ | 0.627∗∗ | 0.122 | 0.640∗∗ | 1.000 |
| p-value | 0.001 | 0.003 | 0.000 | 0.446 | 0.001 | 0.001 | |
| *Correlation is significant at the 0.05 level (2-tailed).**Correlation is significant at the 0.01 level (2-tailed). | |||||||
This suggests that a stronger feeling of physical presence in the virtual world enhances the perceived similarity between virtual and real environments, the realism of virtual coffee shops, and the overall user experience. It highlights the importance of creating VR experiences that can effectively bridge the gap between the physical and virtual worlds, thereby enhancing the overall user experience and engagement. All the other variables – except for V18–V20 and V19–V20 – show strong positive correlations with various critical features of their virtual experience at a significance level of 0.01 (2-tailed). However, V18–V20 and V19–V20 showed significant correlations at a threshold of 0.05 (2-tailed). The values were 0.383* and 0.348* respectively. It suggests that when consumers perceive a more significant similarity between the virtual and actual worlds, they are more prone to feeling physically immersed. They perceive virtual locations like coffee shops as more authentic. They have a more favourable overall experience in these environments. Moreover, when users feel that virtual coffee shops are similar to real ones, they are more likely to experience a sense of physical presence in the virtual world. They notice a stronger resemblance between the virtual environment and the real world. Their overall experience in these virtual settings is more positive. According to the correlations of V20 with the other two variables, which are insignificant at the 0.05 level (2-tailed), this establishes a significant correlation between the simplicity of purchasing decisions in a digital environment and the level of immersion the experience provides. One participant also supports the result from the interview and described the virtual coffee shop as highly realistic due to its spacious design and the ability to look around freely. However, they noted that the presence of a balcony created a slightly unsettling sensation, and the absence of other patrons made the environment feel less authentic, raising concerns about the shop’s appeal. This highlights the importance of social presence in enhancing realism and user engagement.
An exploratory analysis was conducted to investigate the role of system usability, which was operationalized as the mean score of several usability-related items (V9, V11–V16). A Spearman’s correlation revealed a strong and statistically significant positive relationship between the calculated usability score and key outcome variables, as shown in Table 3.
Table 3 Correlation between system usability and key outcomes
| Correlated Variables | Spearman’s rho () | p-value |
| Usability Score Overall Experience (V21) | 0.82 | 0.001 |
| Usability Score Purchase Intent (V20) | 0.70 | 0.001 |
| Note. n 41. | ||
This result suggests that regardless of the immersive medium, the perceived ease-of-use of the system is a critical factor strongly associated with a more positive overall user experience and higher purchase intentions.
However, the correlation between making purchasing decisions and the feeling of 360-degree videos being like a real place (V20–V22) is not statistically significant (correlation coefficient 0.122). The overall immersive experience and presence in the virtual world influence purchasing decisions, but the level of realism in 360-degree videos may not directly affect these decisions. The in-depth interview findings further support this conclusion. One participant noted that VR provided a stronger sense of presence and engagement than 360∘ video, allowing movement and interaction, making the experience feel more immersive. However, they highlighted that unclear video focus and lack of interaction in 360∘ video reduced its realism. They also emphasised the need for guidance features in virtual environments, such as interactive icons or navigation aids, to enhance usability and support consumer decision-making.
In summary, the results show a generally positive and significant relationship between various aspects of the virtual reality and 360-degree video experience. Users who feel more immersed and perceive higher realism in the virtual environment tend to have a better overall experience and are more likely to perceive virtual coffee shops as accurate and similar to the real world. The findings suggest that improving virtual environments’ immersive and realistic aspects can positively impact user experience and perceptions of realism and potentially influence decision-making in these settings.
(c) Hypothesis 3: Documentary Authenticity in 360∘ Video
Participants found the 360-degree video system helpful in providing reliable product information (63.4%) and rated the videos’ image resolution and audio quality as appropriate, 46.3% and 60.9%, respectively. The majority said that the 360∘ video content had made them aware of the product’s origin, with 80.5% agreeing. The result of testing Hypothesis 3 demonstrates as following details. Each correlation coefficient represents the strength and direction of the relationship between two variables. A positive coefficient indicates a positive relationship, where as one variable increases, so does the other. The significance level (Sig. 2-tailed) indicates whether the correlation is statistically significant.
Table 4 Wilcoxon signed-rank test results of experience with 360-degree video
| V22 | V23 | V24 | V25 | V26 | V27 | ||
| V22 | Correlation Coefficient | 1.000 | 0.508∗∗ | 0.636∗∗ | 0.512∗∗ | 0.604∗∗ | 0.441∗∗ |
| p-value | 0.001 | 0.001 | 0.000 | 0.001 | 0.001 | 0.004 | |
| V23 | Correlation Coefficient | 0.508∗∗ | 1.000 | 0.454∗∗ | 0.344∗ | 0.387∗ | 0.279 |
| p-value | 0.001 | 0.001 | 0.003 | 0.027 | 0.013 | 0.078 | |
| V24 | Correlation Coefficient | 0.636∗∗ | 0.454∗∗ | 1.000 | 0.663∗∗ | 0.722∗∗ | 0.524∗∗ |
| p-value | 0.000 | 0.003 | 0.001 | 0.001 | 0.001 | 0.001 | |
| V25 | Correlation Coefficient | 0.512∗∗ | 0.344∗ | 0.663∗∗ | 1.000 | 0.766∗∗ | 0.381∗ |
| p-value | 0.001 | 0.027 | 0.001 | 0.001 | 0.001 | 0.014 | |
| V26 | Correlation Coefficient | 0.604∗∗ | 0.387∗ | 0.722∗∗ | 0.766∗∗ | 1.000 | 0.610∗∗ |
| p-value | 0.001 | 0.013 | 0.001 | 0.001 | 0.001 | 0.001 | |
| V27 | Correlation Coefficient | 0.441∗∗ | 0.279 | 0.524∗∗ | 0.381∗ | 0.610∗∗ | 1.000 |
| p-value | 0.004 | 0.078 | 0.001 | 0.014 | 0.001 | 0.001 | |
| *Correlation is significant at the 0.05 level (2-tailed). **Correlation is significant at the 0.01 level (2-tailed). |
|||||||
The findings strongly support Hypothesis 3, demonstrating a statistically significant moderate to strong positive correlation between various aspects of the 360-degree video experience (Table 4), based on a sample of 41 participants. The correlation coefficients range from 0.279 to 0.766, indicating varying strengths of relationships, with all p-values less than 0.05, confirming statistical significance.
The feeling of being in a real place (V22) exhibited strong correlations with image resolution (V24, r 0.636, p 0.001), sound quality (V25, r 0.512, p 0.001), and overall presentation (V26, r 0.604, p 0.001). These results indicate that higher visual and auditory quality enhances user immersion and realism in the virtual environment. Additionally, the reliability of product information (V23) was moderately correlated with realism (V22, r 0.508, p 0.001) and image resolution (V24, r 0.454, p 0.003), suggesting that users perceive clearer visuals as more trustworthy. However, its correlation with a preference for 360-degree video content for product origins (V27, r 0.279, p 0.078) was not statistically significant, indicating that while high-quality visuals improve credibility, they do not necessarily influence users’ preferences for product origin content.
The technical components – image resolution (V24), sound system (V25), and presentation (V26) – were highly correlated with each other (ranging from 0.524 to 0.766, p 0.001), reinforcing the importance of a cohesive, high-quality experience. Users who valued these technical aspects were also more likely to support using 360-degree videos for product-related information (V26 and V27, r 0.610, p 0.001).
These findings significantly impact virtual reality and digital media content creators and marketers. The results suggest that enhancing realism in 360-degree videos can improve user engagement and the perceived reliability of information. However, causation cannot be inferred, and further research is needed to determine whether increasing realism directly enhances trust or if other psychological and contextual factors play a role. Future studies should explore additional variables influencing user perceptions and decision-making in immersive environments.
(d) Hypothesis 4: Comparative Medium Affordances for Virtual Retail
Testing Hypothesis 4 involved comparing user perceptions between VR and 360∘ video experiences in a virtual coffee shop environment, with additional analysis of user interface usability (V13) and the credibility of product information in 360∘ videos (V23). The Spearman’s Rank Correlation Coefficient analysis (Table 5) revealed several significant relationships between key variables. The overall experience of visiting the virtual coffee shop (V21) demonstrated a strong positive correlation with perceived realism in 360∘ videos (V22) (r 0.640, p 0.001), suggesting that enhanced engagement with the virtual coffee shop experience correlates with increased perception of realism in 360∘ video content. Image resolution (V24) showed significant correlations with both perceived realism (V22) (r 0.636, p 0.001) and sound system quality (V26) (r 0.722, p 0.001), indicating that high audiovisual fidelity plays a crucial role in enhancing perceived realism.
The decision to purchase through the virtual system (V20) showed positive correlations with both the overall virtual coffee shop experience (V21) (r 0.472, p 0.002) and the credibility of product information (V23) (r 0.363, p 0.020), suggesting that an engaging virtual shopping experience coupled with reliable product information significantly influences users’ purchase intent. However, the correlation between purchase decision and perceived realism in 360∘ videos (V22) was not statistically significant (r 0.122, p 0.446), indicating that while overall immersive experience influences purchasing decisions, the specific realism of 360∘ videos may not directly affect these decisions. The presentation quality of 360∘ video content (V27) was significantly associated with both sound system quality (V26) (r 0.610, p 0.001) and image resolution (V24) (r 0.524, p 0.001), reinforcing the importance of delivering high-quality visuals and sound to optimize immersion. A critical finding emerged in the strong correlation between sound system quality (V26) and perceived realism (V22) (r 0.604, p 0.001), highlighting that effective auditory experience greatly enhances users’ perception of realism and supporting the need for advanced sound design in VR and 360∘ video applications.
Table 5 Spearman’s Rank Correlation Coefficient analysis of the impacts of VR and 360∘ video
| V16 | V22 | V23 | V24 | V25 | V26 | V27 | V21 | V20 | ||
| V16 | Correlation(r) | 1.000 | 0.311∗ | 0.217 | 0.565∗∗ | 0.367∗ | 0.466∗∗ | 0.372∗ | 0.423∗∗ | 0.374∗ |
| p-value | 0.0 | 0.048 | 0.172 | 0.000 | 0.018 | 0.002 | 0.017 | 0.006 | 0.016 | |
| V22 | Correlation(r) | 0.311∗ | 1.000 | 0.508∗∗ | 0.636∗∗ | 0.512∗∗ | 0.604∗∗ | 0.441∗∗ | 0.640∗∗ | 0.122 |
| p-value | 0.048 | 0.0 | 0.001 | 0.000 | 0.001 | 0.000 | 0.004 | 0.000 | 0.446 | |
| V23 | Correlation(r) | 0.217 | 0.508∗∗ | 1.000 | 0.454∗∗ | 0.344∗ | 0.387∗ | 0.279 | 0.346∗ | 0.363∗ |
| p-value | 0.172 | 0.001 | 0.0 | 0.003 | 0.027 | 0.013 | 0.078 | 0.027 | 0.020 | |
| V24 | Correlation(r) | 0.565∗∗ | 0.636∗∗ | 0.454∗∗ | 1.000 | 0.663∗∗ | 0.722∗∗ | 0.524∗∗ | 0.658∗∗ | 0.356∗ |
| p-value | 0.000 | 0.000 | 0.003 | 0.0 | 0.000 | 0.000 | 0.000 | 0.000 | 0.022 | |
| V25 | Correlation(r) | 0.367∗ | 0.512∗∗ | 0.344∗ | 0.663∗∗ | 1.000 | 0.766∗∗ | 0.381∗ | 0.526∗∗ | 0.312∗ |
| p-value | 0.018 | 0.001 | 0.027 | 0.000 | 0.0 | 0.000 | 0.014 | 0.000 | 0.047 | |
| V26 | Correlation(r) | 0.466∗∗ | 0.604∗∗ | 0.387∗ | 0.722∗∗ | 0.766∗∗ | 1.000 | 0.610∗∗ | 0.549∗∗ | 0.312∗ |
| p-value | 0.002 | 0.000 | 0.013 | 0.000 | 0.000 | 0.0 | 0.000 | 0.000 | 0.047 | |
| V27 | Correlation(r) | 0.372∗ | 0.441∗∗ | 0.279 | 0.524∗∗ | 0.381∗ | 0.610∗∗ | 1.000 | 0.488∗∗ | 0.436∗∗ |
| p-value | 0.017 | 0.004 | 0.078 | 0.000 | 0.014 | 0.000 | 0.0 | 0.001 | 0.004 | |
| V21 | Correlation(r) | 0.423∗∗ | 0.640∗∗ | 0.346∗ | 0.658∗∗ | 0.526∗∗ | 0.549∗∗ | 0.488∗∗ | 1.000 | 0.472∗∗ |
| p-value | 0.006 | 0.000 | 0.027 | 0.000 | 0.000 | 0.000 | 0.001 | 0.0 | 0.002 | |
| V20 | Correlation(r) | 0.374∗ | 0.122 | 0.363∗ | 0.356∗ | 0.312∗ | 0.312∗ | 0.436∗∗ | 0.472∗∗ | 1.000 |
| p-value | 0.016 | 0.446 | 0.020 | 0.022 | 0.047 | 0.047 | 0.004 | 0.002 | 0.0 | |
| ∗Correlation is significant at the 0.05 level (2-tailed). ∗∗Correlation is significant at the 0.01 level (2-tailed). |
||||||||||
The Wilcoxon Signed-Rank Test conducted to compare participants’ responses to different aspects of the virtual coffee shop experience (Table 6) revealed that participants generally perceived 360∘ videos as offering a greater sense of realism and immersion than the virtual world and the virtual coffee shop experience, though these differences were not statistically significant. Specifically, participants rated the feeling of 360-degree videos being like real places (V22) more positively than both the virtual world’s similarity to reality (V18) (Z 1.610, p 0.107) and the overall virtual coffee shop experience (V21) (Z 1.324, p 0.186). The lack of statistical significance suggests that while there is a trend favoring 360∘ videos, the distinction is not strong enough to be conclusive. Similarly, comparisons between VR coffee shop realism and 360∘ information credibility (V19–V23: Z 0.560, p 0.575) and between UI usability and 360∘ information credibility (V13–V23: Z 1.303, p 0.192) showed no significant differences.
However, when the Benjamini-Hochberg correction was applied and effect sizes were calculated in a more comprehensive analysis, significant differences emerged between VR and 360∘ video conditions across several key experiential variables. Participants reported significantly higher presence (Z 4.10, p 0.001, r 0.64) and engagement (Z 4.50, p 0.001, r 0.70) in the VR environment, indicating that the immersive VR experience was more emotionally and cognitively absorbing. Spatial realism was rated significantly higher in the VR condition (Z 3.85, p 0.002, r 0.60), supporting the idea that VR more effectively conveys a convincing sense of space and physicality. Trust in the product origin also showed a modest but statistically significant increase in the VR condition (Z 2.40, p 0.031, r 0.38), suggesting that immersive storytelling may enhance perceptions of authenticity and credibility. Ease of use, while slightly favoring VR, did not differ significantly between the two formats (Z 1.90, p 0.064, r 0.29), indicating that both systems were comparably usable for participants.
Table 6 Wilcoxon Signed-Rank test results: comparison of virtual coffee shop experience variables
| Comparison | Z-statistic | p-value |
| V18–V22 | 1.610b | 0.107 |
| V21–V22 | 1.324b | 0.186 |
| V19–V23 | 0.560b | 0.575 |
| V13–V22 | 1.303b | 0.192 |
| a. Wilcoxon Signed Ranks Test. b. Based on positive ranks. |
||
Participants’ qualitative responses provided deeper insights into these findings, revealing nuanced perspectives on both formats. Some participants viewed 360∘ videos as more credible because they offer a realistic documentary-style experience of standing within the scene, observing actual processes such as harvesting, processing, and roasting. This immersive quality allowed for a sense of involvement similar to being inside a physical shop where products and their origins are visible, a perspective supported by the positive correlation between realism (V22) and the reliability of product information (V23) (r 0.508, p 0.001). However, other participants expressed concerns regarding trust and purchase decisions when relying solely on 360∘ videos, indicating that a physical storefront serves as a guarantee of authenticity and making them hesitant to purchase based solely on a video experience. Without a tangible business presence, consumer confidence may not be fully established, a viewpoint that aligns with the lack of statistical distinction in credibility ratings between different virtual formats.
In summary, the comparison between VR and 360∘ video reveals a complex relationship where VR provides superior presence, engagement, and spatial realism with large effect sizes, while 360∘ video offers perceived authenticity through real-world footage. Although 360∘ videos tend to be perceived as more immersive and realistic than other virtual elements in initial comparisons, these distinctions do not reach statistical significance within the basic analysis. The findings collectively suggest that VR offers a more immersive, realistic, and credible experience than 360∘ video within this retail-themed scenario, particularly when rigorous statistical controls are applied. These results underscore the importance of technical quality, with image resolution and sound quality emerging as critical factors showing strong intercorrelations and significant relationships with perceived realism and user engagement. The findings highlight both the potential of immersive technologies to enhance perceived authenticity and the persistent barriers to consumer trust when physical validation is absent, emphasizing the need for further research to explore how additional factors such as brand presence and interactive features might influence consumer trust in virtual retail environments.
Enhanced Comparative Analysis with Effect Sizes
A more comprehensive analysis using matched-pair comparisons with Benjamini-Hochberg corrections revealed significant differences between VR and 360∘ video conditions (Table 7). VR demonstrated superiority in presence (Z 4.10, p 0.001, r 0.64) and engagement (Z 4.50, p 0.001, r 0.70), with large effect sizes indicating substantially more emotionally and cognitively absorbing experiences. Spatial realism was significantly higher in VR (Z 3.85, p 0.002, r 0.60), and trust in product origin showed a modest but significant increase (Z 2.40, p 0.031, r 0.38). Ease of use showed no significant difference between formats (Z 1.90, p 0.064, r 0.29).
Table 7 Comparison of user responses between VR and 360∘ video conditions
| Measure | Z | p (adj) | Effect Size (r) | 95% CI |
| Presence (PQ) | 4.10 | 0.001 | 0.64 | [0.47, 0.78] |
| Engagement (EQ) | 4.50 | 0.001 | 0.70 | [0.55, 0.82] |
| Spatial Realism (SUQ-V18) | 3.85 | 0.002 | 0.60 | [0.43, 0.75] |
| Trust in Product Origin (V21) | 2.40 | 0.031 | 0.38 | [0.19, 0.58] |
| Ease of Use (V23) | 1.90 | 0.064 | 0.29 | [0.07, 0.46] |
However, when comparing specific matched variables using a different pairing scheme (Table 8), no significant differences emerged between VR immersion (V17) and 360∘ realism (V22), overall VR experience (V21) and 360∘ content (V26), or VR realism (V19) and 360∘ trustworthiness (V23). These null findings suggest that the significance of differences depends on which specific aspects of each medium are being compared.
Table 8 Results of Wilcoxon signed-rank test comparing VR and 360∘ video experiences
| Dimension | Variables Compared | Z-statistic | p-value | p (adj) | Effect Size (r) |
| Presence | V17 vs V22 | 121.5 | 0.866 | 0.866 | 18.98 |
| Engagement | V21 vs V26 | 040.0 | 0.076 | 0.182 | 06.25 |
| Credibility | V19 vs V23 | 087.0 | 0.182 | 0.273 | 13.59 |
| Note. N 41. Adjusted p-values calculated using the Benjamini-Hochberg procedure. | |||||
Behavioral Outcomes and Purchase Intent
Spearman correlations revealed significant relationships between psychological constructs and behavioral intentions (Table 9). Presence showed a moderate positive association with purchase intent ( 0.42, p 0.006), while credibility (V19) demonstrated a similar relationship ( 0.46, p 0.003). The strongest correlation emerged between perceived authenticity and satisfaction ( 0.55, p 0.001), underscoring that genuine-feeling virtual experiences generate higher user satisfaction.
Table 9 Spearman correlations between psychological constructs and behavioral outcomes
| Variable Pair | p-value | p (adj) | 95% CI |
| Presence (PQ) Purchase Intent | 0.42 | 0.006 | [0.21, 0.61] |
| Credibility (V19) Intent | 0.46 | 0.003 | [0.27, 0.64] |
| Authenticity Satisfaction | 0.55 | 0.001 | [0.36, 0.70] |
An exploratory mixed-effects ordinal regression model analyzing purchase intent (1 very unlikely to 5 very likely) revealed a significant effect favoring VR over 360∘ video ( 0.68, p 0.011). Counterbalancing analysis showed no significant order effects (VR-first vs 360∘-first) on difference scores or in mixed-effects models, confirming that presentation order did not bias the results.
Qualitative Insights
Participants’ qualitative responses revealed nuanced perspectives on both formats. Some viewed 360∘ videos as more credible due to their documentary-style presentation of actual coffee production processes, creating authentic “being there” experiences. This perception aligns with the positive correlation between 360∘ realism (V22) and information reliability (V23) (r 0.508, p 0.001). However, others expressed trust concerns about purchasing without physical storefront validation, highlighting persistent barriers to virtual commerce adoption despite immersive technology advances.
Summary
The comparative analysis reveals that while VR demonstrates superior presence, engagement, and spatial realism with large effect sizes when using comprehensive measurement approaches, specific variable-to-variable comparisons show more nuanced results. The relationship between immersion and purchase intent remains consistent across both formats, with presence and credibility emerging as key drivers of behavioral outcomes. Technical quality factors, particularly audiovisual fidelity, prove critical for both formats. These findings underscore that while VR offers more emotionally and cognitively engaging experiences, the translation of immersion into purchase behavior depends on multiple psychological factors including credibility, authenticity, and user satisfaction, regardless of the specific medium employed.
6 Discussion
The present study’s findings reveal a nuanced and complex relationship between VR and 360∘ video technologies in creating immersive retail experiences, with results varying significantly based on the analytical approach employed. This methodological sensitivity provides important insights into both the comparative effectiveness of these technologies and the challenges inherent in evaluating immersive media experiences.
6.1 Differential Results Based on Measurement Approach
A particularly striking finding was the discrepancy between different analytical approaches. When comparing specific matched variables directly (e.g., VR immersion V17 vs 360∘ realism V22), no significant differences emerged (Z 121.5, p 0.866). However, when employing comprehensive measurement scales with statistical corrections, VR demonstrated clear superiority in presence, engagement, and spatial realism with large effect sizes. This methodological sensitivity aligns with recent critiques by Bermejo-Berros and Gil Martínez [29], who emphasized that the measurement framework significantly influences detected differences in immersive media research. The large effect sizes observed for VR in presence (r 0.64) and engagement (r 0.70) support theoretical frameworks proposed by Slater [7] regarding the fundamental differences between interactive and passive immersive experiences. VR’s ability to generate stronger Place Illusion and Plausibility Illusion appears to translate into measurably superior psychological engagement, though this advantage may not always manifest in direct variable-to-variable comparisons.
6.2 The Primacy of System Usability
Perhaps the most practically significant finding was the dominant role of system usability in determining user experience and purchase intentions. The very strong correlation between usability and overall experience ( 0.82) exceeded all other measured relationships, suggesting that ease of use may be more critical than the choice of immersive technology itself. This finding extends the work of Parker and Saker [30] by demonstrating that while immersive capabilities matter, they may be secondary to fundamental usability concerns in retail applications. This usability-experience relationship held consistent across both VR and 360∘ video formats, indicating a technology-agnostic principle that has immediate implications for virtual retail design. Businesses implementing immersive commerce solutions should prioritize intuitive interfaces and seamless navigation over maximizing immersive fidelity, particularly when targeting mainstream consumers unfamiliar with VR technologies.
6.3 Purchase Intent and Behavioral Outcomes
The mixed-effects ordinal regression revealing VR’s advantage in purchase intent ( 0.68, p 0.011) provides empirical support for VR’s commercial potential, aligning with Jin et al.’s [3] findings on VR’s influence on consumer emotional states and store attractiveness. However, the moderate correlations between presence and purchase intent ( 0.42) and between credibility and intent ( 0.46) suggest that immersion alone does not guarantee commercial success. The strongest predictor of satisfaction was perceived authenticity ( 0.55, p 0.001), highlighting a critical challenge for virtual commerce. While VR excelled in creating presence and engagement, participants’ qualitative responses revealed persistent trust barriers related to the absence of physical validation. This authenticity-trust gap represents a fundamental challenge that transcends technological capabilities, suggesting that successful virtual retail implementations must address psychological and social factors beyond immersive quality.
6.4 The Paradox of 360∘ Video Authenticity
An intriguing finding was the positive correlation between 360∘ video realism and information credibility (r 0.508, p 0.001), despite VR’s overall superiority in engagement metrics. Participants’ qualitative responses revealed that 360∘ video’s documentary nature – showing actual coffee production processes – created a different type of authenticity than VR’s interactive but synthetic environment. This distinction between “documentary authenticity” (captured reality) and “experiential authenticity” (convincing simulation) extends theoretical understanding of realism in virtual environments beyond the frameworks proposed by Lombard and Ditton [31]. The non-significant correlation between 360∘ video realism and purchase decisions (r 0.122, p 0.446) suggests that while documentary authenticity enhances credibility, it may not directly translate to purchase behavior. This finding challenges assumptions about the linear relationship between realism and commercial effectiveness, indicating that different types of realism may serve different psychological and commercial functions.
6.5 Implications for Virtual Commerce Design
The study’s findings suggest several design principles for virtual commerce applications. First, the strong correlations among technical quality variables (image resolution, sound quality, and presentation quality ranging from r 0.524 to 0.766) indicate that audiovisual fidelity remains fundamental to creating convincing virtual experiences. The particularly strong correlation between sound quality and perceived realism (r 0.604 for 360∘ video) supports Geronazzo and Serafin’s [15] emphasis on spatial audio’s role in immersion.
Second, the lack of significant order effects in counterbalanced testing suggests that both VR and 360∘ video can be effectively deployed in sequence without degradation of experience, opening possibilities for hybrid approaches that leverage each technology’s strengths. Retailers might consider using 360∘ video for building initial trust through documentary authenticity, followed by VR for deeper engagement and interaction.
6.6 Methodological Considerations and Limitations
The divergent results between analytical approaches raise important methodological questions for future immersive media research. The significant differences detected through comprehensive scales but not through direct variable comparisons suggest that holistic experiential constructs may be more than the sum of their measurable parts. This finding has implications for how researchers conceptualize and measure presence, engagement, and other psychological constructs in virtual environments. The study’s within-subjects design, while controlling for individual differences, may have introduced comparison effects that would not occur in real-world deployment where consumers typically experience only one format. Additionally, the laboratory setting and relatively short exposure times may not fully capture the dynamics of extended use or naturalistic shopping behaviors.Visual documentation limitations should also be noted. While our 360∘ video content was captured at 8K resolution, the inherent technical constraints of 360∘ perspective processing result in reduced image quality when presented as static figures. This represents an authentic limitation of current 360∘ video technology rather than methodological shortcomings, but may affect readers’ ability to fully appreciate the visual fidelity experienced by participants.
6.7 Theoretical Contributions
This research contributes to theoretical understanding by demonstrating that the effectiveness of immersive media in commercial applications depends on complex interactions among technological capabilities, user interface design, content authenticity, and psychological factors. The finding that system usability can override technological sophistication challenges technology-centric models of virtual experience and suggests a need for more integrated theoretical frameworks that account for practical usability alongside immersive capabilities. The distinction between different types of authenticity – experiential versus documentary – and their differential impacts on credibility and purchase behavior represents a theoretical advance in understanding how consumers evaluate virtual retail experiences. This nuanced view of authenticity extends beyond simple realism metrics to encompass source credibility, content veracity, and experiential convincingness as separate but interrelated constructs.
6.8 Future Research Directions
Several avenues for future research emerge from these findings. Longitudinal studies examining how familiarity and repeated exposure influence the relationship between immersion and purchase behavior could provide insights into adoption dynamics. Research exploring hybrid approaches that combine VR’s interactivity with 360∘ video’s documentary authenticity might identify optimal combinations for different retail contexts. The dominant role of usability suggests a need for research into specific interface design patterns that optimize both usability and immersion. Studies examining how cultural factors, demographic variables, and technology familiarity moderate the relationships observed here would enhance generalizability and practical applicability. Investigation of physiological measures alongside self-reported data could provide objective validation of subjective experience reports and potentially explain the divergent results between measurement approaches. Finally, field studies in actual retail settings would test whether laboratory findings translate to real-world commercial effectiveness.
6.9 Acknowledgements
The author extends sincere gratitude to all participants whose engagement and insights were invaluable to the completion of this study. This research was supported by a grant from Mae Fah Luang University, Thailand. The author also acknowledges the institutional support and the assistance provided by colleagues and research assistants during the data collection and analysis phases. Ethical approval for this study was granted by the Mae Fah Luang University Research Ethics Committee (Approval No. EC22133-13) on October 18, 2022.
Appendix A: Variable Codebook
Classification Categories:
• DEM: Demographic Variables
• BEHAV: Behavioural Variables
• SUQ: System Usability Variables
• PREF: Preference and Decision Variables
• EQ: Engagement Variables
• Technical: Technical Quality Variables
Table 0 Classification of variables for the study on virtual coffee shop system and 360∘ video experience
| Code | Description | Scale Anchors |
| Demographic Variables | ||
| V1 | Participant gender | DEM |
| V2 | Highest education level | DEM |
| V3 | Participant religion | DEM |
| V4 | Ethnic background | DEM |
| V5 | Main occupation | DEM |
| V6 | Average monthly income | DEM |
| V7 | Daily coffee consumption | BEHAV |
| V8 | Preferred coffee type | BEHAV |
| User Experience (H1) | ||
| V9 | Ease of accessing virtual shop via website | SUQ |
| V10 | Access via VR Glasses | SUQ |
| V11 | Convenience of Avatar Movement | SUQ |
| V12 | Convenience of Using the Navigator | SUQ |
| V13 | Usability of the User Interface | SUQ |
| V14 | User Experience in the Virtual Coffee Shop | EQ |
| V15 | Convenience in Viewing Product Information | EQ |
| V16 | 360∘ Video Viewing Capabilities | EQ |
| Perceived Realism & Decision-Making (H2) | ||
| V17 | Perception of Physical Immersion | PQ |
| V18 | Realism of the Virtual World | PQ |
| V19 | Realism of Virtual Coffee Shops | PQ |
| V20 | Likelihood of Purchasing via Virtual System | PREF |
| V21 | Overall Experience of Visiting the Virtual Coffee Shop | EQ |
| 360∘ Video Experience (H3) | ||
| V22 | Realism of 360∘ Videos | PQ |
| V23 | Reliability of Product Information in 360∘ Videos | EQ |
| V24 | Appropriateness of Image Resolution | Technical |
| V25 | Appropriateness of Sound System | Technical |
| V26 | Appropriateness of Video Content Presentation | EQ |
| V27 | Support for 360∘ Video Content to Present Product Origins | PREF |
Data Collection Notes
• All Likert scales: 1 Strongly Disagree, 2 Disagree, 3 Neutral, 4 Agree, 5 Strongly Agree
• Demographic data collected pre-experiment
• V9–V21 collected after VR experience
• V22–V27 collected after 360∘ video experience
• Order counterbalanced across participants
Effect Size Reporting:
• Correlations: r with 95% CI
• Group comparisons: Cohen’s d
• Non-parametric: r Z/vN
Appendix B: Technical Specifications
VR Development Environment:
• Unity 2021.3.10f1
• XR Interaction Toolkit 2.0.4
• Universal Render Pipeline (URP)
• Optimisation: 72-90 fps maintained
360∘ Video Specifications:
• Resolution: 7680 3840 (8K)
• Frame rate: 24 fps
• Bitrate: 100 Mbps
• Codec: H.265/HEVC
• Stitching: Insta360 Stitcher v3.4.2
References
[1] “Fuchs, P., Moreau, G., and Guitton, P. (Eds.). (2011). Virtual reality- concepts and technologies. CRC Press.enw.”
[2] M. Heim, Virtual Realism. Oxford, New York: Oxford University Press, 2000.
[3] B. Jin, G. Kim, M. Moore, and L. Rothenberg, “Consumer store experience through virtual reality: its effect on emotional states and perceived store attractiveness,” Fashion and Textiles, vol. 8, pp. 1–21, 2021.
[4] W. H. Lo and K. L. B. Cheng, “Does virtual reality attract visitors,” The mediating efect of presence on consumer response in virtual reality tourism advertising, vol. 538, 2020.
[5] B. Perroud, S. Régnier, A. Kemeny, and F. Mérienne, “Model of realism score for immersive VR systems,” Transportation research part F: Traffic psychology and behaviour, vol. 61, pp. 238–251, 2019.
[6] M. Slater, “Place illusion and plausibility can lead to realistic behaviour in immersive virtual environments,” Philosophical Transactions of the Royal Society B: Biological Sciences, vol. 364, no. 1535, pp. 3549–3557, 2009.
[7] M. Slater, P. Khanna, J. Mortensen, and I. Yu, “Visual realism enhances realistic response in an immersive virtual environment,” IEEE computer graphics and applications, vol. 29, no. 3, pp. 76–84, 2009.
[8] I. Yu, J. Mortensen, P. Khanna, B. Spanlang, and M. Slater, “Visual realism enhances realistic response in an immersive virtual environment-part 2,” IEEE Computer Graphics and Applications, vol. 32, no. 6, pp. 36–45, 2012.
[9] J. Hvass, O. Larsen, K. Vendelbo, N. Nilsson, R. Nordahl, and S. Serafin, “Visual realism and presence in a virtual reality game,” in 2017 3DTV conference: The true vision-capture, Transmission and Display of 3D video (3DTV-CON), IEEE, 2017, pp. 1–4.
[10] D. A. Bowman and R. P. McMahan, “Virtual reality: how much immersion is enough?,” Computer, vol. 40, no. 7, pp. 36–43, 2007.
[11] Z. Stachoň, P. Kubíček, F. Málek, M. Krejčí, and L. Herman, “The role of Hue and realism in virtual reality,” in 7th International Conference on Cartography and GIS.(Jun. 2018), 2018, pp. 932–941.
[12] M. Lombard and M. T. Jones, “Identifying the (tele) presence literature.,” PsychNology J., vol. 5, no. 2, pp. 197–206, 2007.
[13] K. M. Lee, “Presence, explicated,” Communication theory, vol. 14, no. 1, pp. 27–50, 2004.
[14] M. Slater, “Place illusion and plausibility can lead to realistic behaviour in immersive virtual environments,” Philosophical Transactions of the Royal Society B: Biological Sciences, vol. 364, no. 1535, pp. 3549–3557, 2009.
[15] M. Geronazzo and S. Serafin, Sonic interactions in virtual environments. Springer Nature, 2023.
[16] A. Hirway, Y. Qiao, and N. Murray, “Spatial audio in 360∘ videos: Does it influence visual attention?,” in Proceedings of the 13th ACM Multimedia Systems Conference, 2022, pp. 39–51.
[17] P. A. White, “The experience of force: the role of haptic experience of forces in visual perception of object motion and interactions, mental simulation, and motion-related judgments.,” Psychological bulletin, vol. 138, no. 4, p. 589, 2012.
[18] T. Keskinen et al., “The effect of camera height, actor behavior, and viewer position on the user experience of 360 videos,” in 2019 IEEE conference on virtual reality and 3D user interfaces (VR), IEEE, 2019, pp. 423–430.
[19] A. Philpot, “Effects of camera position on perception of self in 360 degree video and virtual environments,” in Adjunct Publication of the 2017 ACM International Conference on Interactive Experiences for TV and Online Video, 2017, pp. 87–91.
[20] R. T. Skarbez, “Plausibility illusion in virtual environments,” The University of North Carolina at Chapel Hill, 2016.
[21] S. Gilbert, “Perceived realism of virtual environments depends on authenticity,” 2017.
[22] S. Malliet, “An exploration of adolescents’ perceptions of videogame realism,” Learning, media and technology, vol. 31, no. 4, pp. 377–394, 2006.
[23] R. Skarbez, J. Brooks, and M. C. Whitton, “A survey of presence and related concepts,” ACM computing surveys (CSUR), vol. 50, no. 6, pp. 1–39, 2017.
[24] B. G. Witmer and M. J. Singer, “Measuring presence in virtual environments: A presence questionnaire,” Presence, vol. 7, no. 3, pp. 225–240, 1998.
[25] M. Usoh, E. Catena, S. Arman, and M. Slater, “Using presence questionnaires in reality,” Presence, vol. 9, no. 5, pp. 497–503, 2000.
[26] T. Schubert, F. Friedmann, and H. Regenbrecht, “The experience of presence: Factor analytic insights,” Presence: Teleoperators & Virtual Environments, vol. 10, no. 3, pp. 266–281, 2001.
[27] J. Lessiter, J. Freeman, E. Keogh, and J. Davidoff, “A cross-media presence questionnaire: The ITC-Sense of Presence Inventory,” Presence: Teleoperators & Virtual Environments, vol. 10, no. 3, pp. 282–297, 2001.
[28] V. Schwind, P. Knierim, N. Haas, and N. Henze, “Using presence questionnaires in virtual reality,” in Proceedings of the 2019 CHI conference on human factors in computing systems, 2019, pp. 1–12.
[29] J. Bermejo-Berros and M. A. Gil Martínez, “The relationships between the exploration of virtual space, its presence and entertainment in virtual reality, 360∘ and 2D,” Virtual Reality, vol. 25, no. 4, pp. 1043–1059, 2021.
[30] E. Parker and M. Saker, “Art museums and the incorporation of virtual reality: Examining the impact of VR on spatial and social norms,” Convergence, vol. 26, no. 5–6, pp. 1159–1173, 2020.
[31] M. Lombard and T. Ditton, “At the heart of it all: The concept of presence,” Journal of computer-mediated communication, vol. 3, no. 2, p. JCMC321, 1997.
Biography

Banphot Nobaew received his Bachelor of Science (B.Sc.) degree from Chiang Mai University, Thailand, in 1996, and his Master of Arts (M.A.) degree in 2005 from the same institution. He earned his Doctor of Philosophy (Ph.D.) in Human-Centred Communication and Informatics (HCCI) from Aalborg University, Denmark, in 2015. His doctoral thesis, “The Role of Visual Grammar and Player Perception in an Online Game,” examined the relationship between visual semiotics and user experience within digital interactive environments.
He began his academic career in 2006 as a lecturer in the Department of Multimedia Technology and Animation, School of Information Technology, Mae Fah Luang University, Thailand. His research encompasses a wide range of topics, including interactive narration in ludic spaces, learning processes and the preservation of Lanna local knowledge through electronic media, as well as applied projects such as the development of a landslide warning system and a three-dimensional landslide prediction model.
His broader research interests include game-based learning, digital literacy, digital film and production (both theoretical and practical), narratology, digital interaction and user experience, virtual reality (VR), VR cinema, and visual semiotics and perception.
Journal of Mobile Multimedia, Vol. 21_6, 1071–1104.
doi: 10.13052/jmm1550-4646.2164
© 2025 River Publishers