An Analytical Framework for Employee Promotion Clustering
Theeramet Kaewwiset and Punnarumol Temdee*
Computer and Communication Engineering for Capacity Building Research Center, School of Applied Digital Technology, Mae Fah Luang University, Chiang Rai, Thailand
E-mail: 6371501002@lamduan.mfu.ac.th; punnarumol@mfu.ac.th
*Corresponding Author
Received 24 August 2025; Accepted 19 November 2025
Abstract
Choosing which employees to promote is a complex task that demands both fairness and effectiveness. Machine learning has significantly improved promotion decisions by providing data-driven insights and automation. Clustering-based promotion models are popular, but their performance is often hindered by deficiencies in the input data, which are typically noisy, class imbalanced, and high dimensional. These problems can be alleviated through data preprocessing. Accordingly, this study introduces an analytical framework for employee promotion clustering that incorporates feature engineering – both feature extraction and feature augmentation – to enhance clustering performance and generalizability. The principal contribution is the development of the generative performance feature (GPF), an augmented representation that amplifies the influence of performance-oriented features extracted via principal component analysis (PCA). The GPF captures the intrinsic structure of the original dataset and is formulated as an additive composite feature. The PCA-transformed dataset combined with the GPF is then used to construct a clustering model. The proposed framework was evaluated on two public datasets with both K-means and fuzzy C-means (FCM) clustering models. The GPF led to significant improvements across key evaluation metrics, namely, the Rand index, the mutual information score, the V-measure, and the Fowlkes–Mallows index. K-means clustering demonstrated superior performance to FCM clustering across all evaluation metrics for both datasets.
Keywords: Employee promotion, clustering performance, feature engineering, feature augmentation, feature extraction, principal component analysis.
1 Introduction
In human resource management, employee promotion refers to advancing employees to a more senior role, typically with increased responsibilities, authority, and pay [1]. Promotions are an important tool for boosting employee motivation and morale; they can make employees feel recognized and appreciated, which enhances their job satisfaction, drive, and loyalty. Promotions also encourage employees to develop new skills and competencies, fostering both personal and professional growth. This enhances their value to the organization and prepares them for future challenges. Promotions also contribute to process improvements within the human resources (HR) department, helping streamline career development initiatives. One study [2] found that 94% of employees remain with an organization longer if it invests in their development during and after promotion. Moreover, a well-structured promotion strategy supports succession planning, by ensuring a pipeline of skilled individuals ready to assume critical roles, and reduces the costs associated with training and assignment constraints [3].
Promotions can occur for various reasons, including performance excellence, acquisition of new skills, and organizational restructuring. The relationship between promotion and performance evaluation has been widely studied [4]. Performance evaluations help HR professionals identify employees’ strengths and areas in which they require further development, in line with organizational goals and objectives [5]. Employee promotion is a strategic process that benefits both employees and the organization. However, it is a complex decision involving multiple criteria. Typically, the factors considered include performance, qualifications, experience, skills, leadership potential, and organizational needs [6–8]. Analyzing these factors enables organizations to understand how personal characteristics affect employees’ effectiveness and achievements [9]. A recent study [10] incorporated analytical techniques into the judgment process to support fair and effective HR decisions, overcoming some of the limitations of traditional, experience-based promotion systems and demonstrating the utility of structured, data-driven frameworks that can uncover unexpected relationships. Ensuring fairness, efficiency, and effectiveness in the promotion process requires integrating and interpreting numerous sources of information, making the analysis inherently complex.
Today, machine learning plays a significant role in promotion decisions; it can make them more data driven, objective, and efficient. Both supervised and unsupervised learning can be used to identify patterns in data and develop promotion models that provide information for decision-makers. In supervised learning, a model is trained on labeled data with predefined target values to classify promotion statuses [6–7, 11–14]. Unsupervised learning models analyze data without labeled targets to uncover hidden patterns, clusters, or relationships [15–22]. These models aim to extract meaningful insights, identify similarities or differences, and explore the underlying structure of the data. Feature engineering is usually required during data preparation to improve the performance of machine learning models. Feature engineering techniques include feature extraction and feature augmentation, which both enhance input data but serve different purposes. Feature extraction transforms raw data into a set of more informative features, reducing dimensionality while retaining essential information [23]. Feature augmentation involves adding new features or modifying existing ones to provide additional information for the model [24, 25].
This study employs unsupervised learning to develop a framework for promotion clustering based on the assumption that employees from different contexts who deserve promotion can be identified through similarities in their performance-oriented features. The proposed framework incorporates feature extraction and feature augmentation as data preprocessing steps. For feature extraction, principal component analysis (PCA) is used to select the performance features that capture most of the variation in the original dataset. Additionally, a novel augmented feature, termed the generative performance feature (GPF), is introduced to enhance the cluster boundaries within the dataset. This additive composite feature is based on the assumption that performance features have a greater influence on promotion status than personal attributes when considering individual promotions. The proposed framework is evaluated with two publicly available imbalanced HR datasets and two clustering models: K-means and fuzzy C-means (FCM) clustering. The performance is measured using the Rand index (RI), the mutual information score (MI), the V-measure score (V), and the Fowlkes–Mallows index (FMI).
2 Literature Review
2.1 Employee Promotion
Employee promotions can be categorized in several ways. Some authors distinguish vertical promotion, in which an employee moves up the organizational hierarchy, from horizontal promotion, in which an employee is transferred to a different role at the same level. Merit-based promotion is awarded on the basis of exceptional performance, achievements, or the fulfillment of specific goals and objectives. From an organizational perspective, employee promotion serves as a strategic tool for identifying talented workers and advancing them into roles with greater responsibility and authority. It enhances employee motivation, fosters loyalty, and improves productivity, while also increasing overall engagement [7, 13, 26]. Conversely, a lack of promotion opportunities or career progression is linked to lower organizational commitment, decreased job and career satisfaction, and higher withdrawal intentions, turnover, and absenteeism [26]. To ensure fairness and objectivity in promotions, HR professionals must develop and implement transparent criteria [27]. Additionally, it is important to ensure that hierarchical levels are classified correctly [28].
Promoting employees is a complex task for any organization, yet it is essential for improving employee performance and engagement [13]. Effective promotion decisions play a crucial role in shaping an organization’s future management quality [6]. An employee’s promotion can both influence and be influenced by the organization’s capabilities and overall structure [7]. It has a significant impact on employees’ careers and performance while also shaping incentive structures that drive both individual motivation and overall company productivity. Many other organizational decisions, including compensation adjustments, layoffs, terminations, performance appraisals, and employee selection processes, are closely connected to promotion. Traditional promotion methods often rely heavily on supervisors’ judgments, which can be impractical in large organizations [7, 13]. As a result, machine learning is increasingly employed to extract insights from complex datasets and formulate human development strategies to support fair and effective promotion decision-making [29].
Two main types of features are commonly used in constructing promotion models: personal and performance oriented. Personal features [6] include various aspects of an individual’s background and career history, such as educational qualifications, gender, age, department, region, recruitment channel, and marital status. According to expectancy theory [30], most employees are motivated to work harder when they believe their efforts will lead to improved performance, ultimately resulting in desirable outcomes like promotions. Performance-oriented features are also widely used in promotion decision-making [26]. These are typically measured through metrics such as key performance indicators (KPIs), performance ratings, awards received, training scores, and overall performance scores. Generally, both personal and performance-oriented features are used when constructing promotion models with machine learning methods [7, 8]. This study does the same; however, performance-oriented features are given higher priority on the assumption that performance is more critical to promotion than personal attributes.
2.2 Machine Learning Methods
Machine learning enables computers to learn from data and make predictions without being explicitly programmed. It has been applied to HR data in various contexts [29, 31]. Two learning approaches are used to construct employee promotion models: supervised learning and unsupervised learning, which perform classification and clustering tasks, respectively. Several standard supervised learning algorithms have been used to construct promotion models, including random forests [6], decision trees [12], and logistic regression [13]. Some studies have used the same dataset as this study for the analysis and prediction of employee promotions. For instance, research employing gradient boosting achieved 93.94% accuracy, an F1 score of 92.76%, and an ROC score of 67.22% [7]. Another study focused on addressing imbalanced datasets in employee promotion prediction; a random forest model attained 93.14% accuracy. The best results were obtained using random oversampling with a random forest, achieving 98.42% accuracy [14]. On the other hand, many studies have employed unsupervised learning methods to construct HR-related clustering models, particularly fuzzy clustering [15, 18, 32–34] and K-means clustering [17, 19–22]. Clustering models share a common objective with promotion models, as they can group individuals from different contexts according to similarities in their data. Therefore, this study proposes an unsupervised learning approach, incorporating K-means and FCM clustering to develop an employee promotion model.
High-quality data are essential for constructing machine learning models. Feature extraction and augmentation have become popular tools for making raw data more manageable for machine learning models. Feature extraction reduces a dataset’s dimensionality by selecting only the most important features for further analysis. The most commonly used dimensionality reduction method is PCA, which transforms a large set of variables into a smaller set of uncorrelated variables, known as principal components, that capture most of the variation in the data. Each principal component is a linear combination of the original variables and accounts for a portion of the total variance [35, 36]. PCA is commonly applied to prepare data for classification [12] and clustering [20]. In this study, PCA is used to enhance the performance of clustering models.
In addition to feature extraction, this study includes feature augmentation in the data preparation process. Feature augmentation techniques generate synthetic data from the original dataset, artificially expanding the training set by creating modified copies of data using existing features [24, 25]. A common feature augmentation approach involves generating new features from the original ones by analyzing their relationships with the target variable. In this study, a novel feature, the GPF, is introduced on the basis of the assumption that performance-oriented features have a greater impact on promotion decisions than personal attributes. For the proposed framework, integrating the GPF into the preprocessed dataset, in combination with feature extraction techniques, is expected to enhance clustering performance.
2.3 The Proposed Framework
The proposed analytical framework consists of feature extraction and feature augmentation processes designed to improve the quality of preprocessed data and enhance the efficiency of promotion clustering models. A conceptual diagram of the proposed framework is shown in Figure 1. First, PCA is applied to the original dataset, with the number of features chosen such that the cumulative explained variance reaches 80% to retain sufficient data variability. Next, the creation of the GPF begins with an examination of the PCA loading matrix to assess the influence of each performance feature. Feature scores are calculated according to the contribution of each feature across the principal components, and these scores are averaged to obtain an overall performance score for each feature. Performance features with an average score of 0.9 or higher are selected to create the GPF. Further details on the GPF construction process are provided in Section 3. After processing through the GPF algorithm, a new dataset is generated by appending the GPF to the PCA-transformed dataset. The resulting combined dataset, containing both the PCA components and the GPF, is then used to construct K-means and FCM clustering models for comparative analysis.
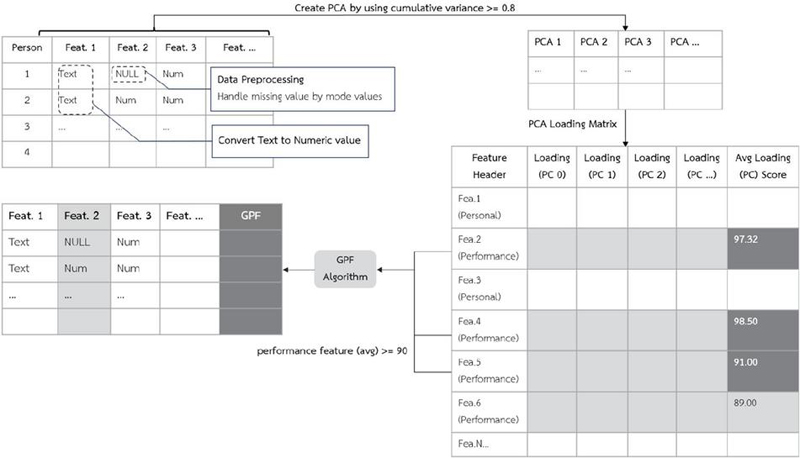
Figure 1 Conceptual diagram of the proposed analytical framework.
3 Methodology
This study received exemption ethical approval from Mae Fah Luang University Ethics Committee on Human Research (Protocol Number: EC 23031-13, dated February 28, 2023). The research methodology is structured into four parts – data preprocessing, feature engineering, model construction, and evaluation – as illustrated in Figure 2.
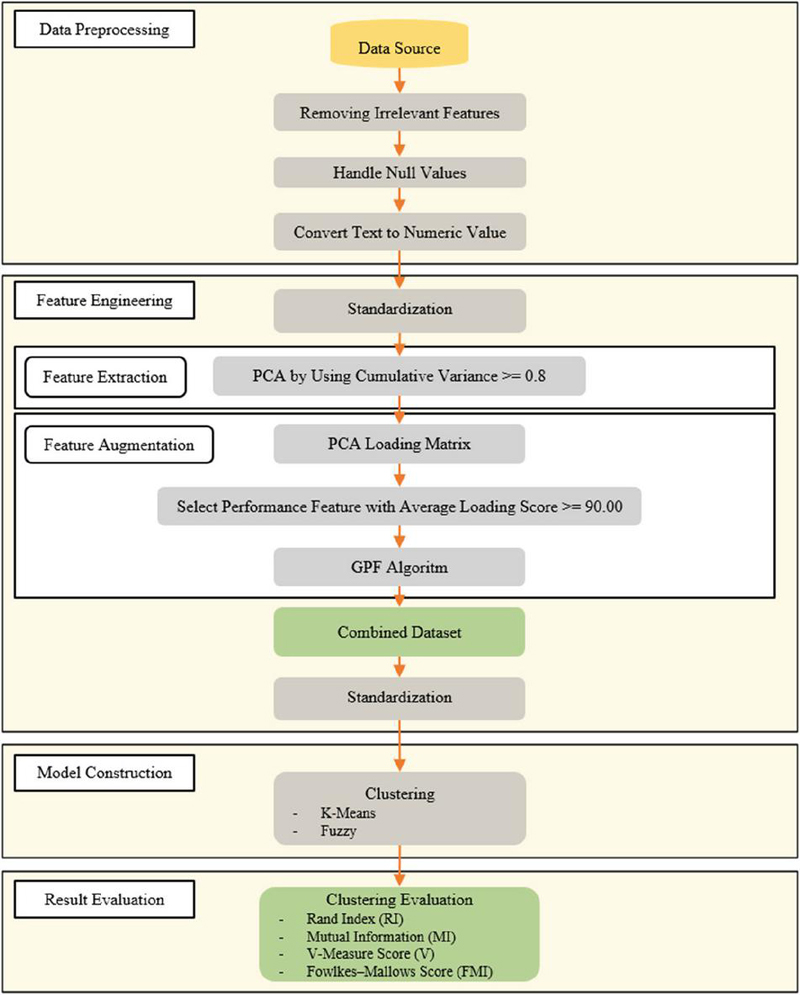
Figure 2 Research methodology.
Two publicly available HR datasets were used to evaluate the performance of the proposed employee promotion clustering model. The features in each dataset were categorized as personal or performance oriented. During data preprocessing, irrelevant features were removed, and missing values were handled. In addition, all categorical values were converted into numerical form for compatibility with the analytical methods. The feature engineering process consisted of two main steps: feature extraction and feature augmentation. Feature extraction was performed using PCA to reduce the data dimensionality as far as possible without taking the explained variance below 80%. In the feature augmentation step, the PCA loading matrix was used to identify performance features with an average loading score of at least 0.9. These selected features were then used as inputs for the GPF algorithm to create a GPF representing the combined influence of employee performance. The resulting PCA-transformed dataset was then combined with the newly generated GPF feature, forming the final dataset for clustering. This was then used to construct both K-means and FCM clustering models. The RI, MI, V, and FMI metrics were calculated to assess the performance of each model.
3.1 Data Preprocessing
Two datasets from Kaggle, containing information on HR and employee promotions, were analyzed in this study: Dataset 1 is the HR Analysis Case Study dataset [37], and Dataset 2 is the Data Science Staff Promotion Prediction dataset [38]. These HR datasets were used to evaluate the generalization of the proposed features and the employee promotion clustering model. The features and descriptions of Datasets 1 and 2 are presented in Tables 1 and 2, respectively.
Table 1 Feature details of Dataset 1: HR analysis case study
| Feature | |||
| No. | Feature | Category | Description |
| 1 | Employee ID | Personal | Integer from 1 to 78298 |
| 2 | Department | Personal | Company department: either analytics, finance, HR, legal, operations, procurement, R&D, sales and marketing, or technology |
| 3 | Region | Personal | From region_1 to region_34 |
| 4 | Education | Personal | Bachelor’s degree, below secondary, or master’s degree and above |
| 5 | Gender | Personal | Male or female |
| 6 | Recruitment channel | Personal | Referred, sourcing, or other |
| 7 | Number of training sessions | Performance | Integer from 1 to 9 |
| 8 | Age | Personal | Integer from 20 to 60 |
| 9 | Previous year’s rating | Performance | Integer from 1 to 5 |
| 10 | Length of service | Performance | Integer from 1 to 34 |
| 11 | KPI | Performance | More than 80% (encoded as 1) or less than 80% (encoded as 0) |
| 12 | Awards won | Performance | Received awards (encoded as 1) or not received awards (encoded as 0) |
| 13 | Average training score | Performance | Integer from 0 to 100 |
Table 2 Feature details of Dataset 2: Data science staff promotion prediction.
| Feature | |||
| No. | Feature | Category | Description |
| 1 | Employee number | Personal | From YAK/S/00001 to YAK/S/54761 |
| 2 | Division | Personal | Company division: business, finance, operations, etc. |
| 3 | Qualification | Personal | Non-university education, first degree or HND, or MSc./MBA/PhD |
| 4 | Gender | Personal | Male or female |
| 5 | Recruitment channel | Personal | Direct internal process, referral and special candidates, or agency and others |
| 6 | Training sessions attended | Performance | Integer from 2 to 11 |
| 7 | Year of birth | Personal | From 1950 to 2001 |
| 8 | Last performance score | Performance | Either 0, 2.5, 5, 7.5, 10, or 12.5 |
| 9 | Year of recruitment | Personal | From 1982 to 2018 |
| 10 | KPI target met | Performance | Met (encoded as 1), or not met (encoded as 0) |
| 11 | Awards won | Performance | Received awards (encoded as 1) or not received awards (encoded as 0) |
| 12 | Training score average | Performance | Integer from 31 to 91 |
| 13 | State of origin | Personal | Kaduna, Plateau, Borno, etc. |
| 14 | Foreign schooled | Personal | Yes or no |
| 15 | Marital status | Personal | Single, married, or not sure |
| 16 | Past disciplinary action | Performance | Yes or no |
| 17 | Previous intradepartmental movement | Performance | Yes or no |
| 18 | Number of previous employers | Performance | Either 0–5 or more than 5 |
Dataset 1 comprises 54,808 records with 13 features, of which 8.52% (4668 records) correspond to the promoted class and 91.48% (50,140 records) to the non-promoted class. Dataset 2 has 38,312 records with 18 features, of which 8.46% (3241 records) represent the promoted class and 91.54% (35,071 records) the non-promoted class. The class distributions for both datasets are depicted in Figure 3.
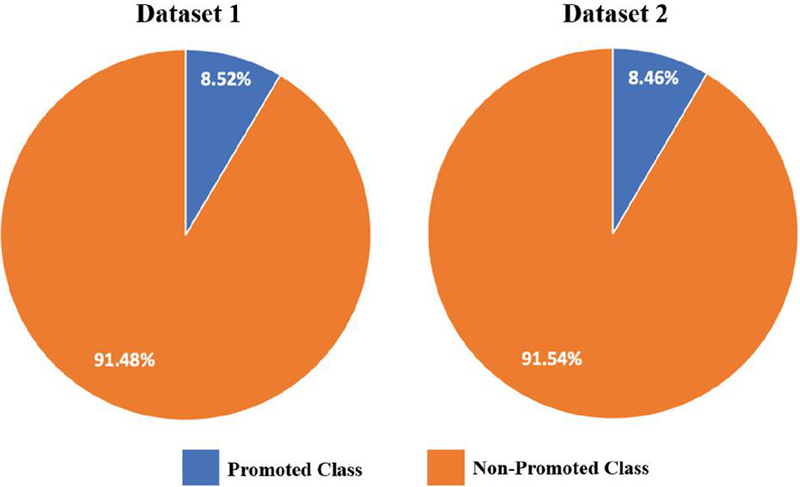
Figure 3 Class distributions of Datasets 1 and 2.
For this study, employee identification numbers were identified as irrelevant features because they do not provide meaningful information for data analysis or model development. Therefore, they were excluded from the datasets during preprocessing. Next, missing values represented by null entries were addressed. In Dataset 1, two features contained missing values: education (2409 null records) and the previous year’s rating (4124 null records). Both features were imputed using modal values. In Dataset 2, the qualification feature had 1679 null records, which were also filled with modal values to maintain data consistency.
After handling missing data, all categorical features were transformed into numerical representations using one-hot encoding and label encoding techniques. For example, in Dataset 1, features such as gender, KPI, and awards won were converted using one-hot encoding, whereas department, region, education, and recruitment channel were encoded using label encoding. Similarly, in Dataset 2, features such as gender, KPI target met, awards won, foreign schooled, past disciplinary action, and previous intradepartmental movement were transformed through one-hot encoding, whereas division, qualification, recruitment channel, state of origin, marital status, and number of previous employers were processed using label encoding.
3.2 Feature Engineering
This section describes the feature extraction and augmentation processes, as well as the construction of the final combined datasets.
3.2.1 Feature extraction
PCA was used for the feature extraction process. This linear reduction technique transforms the original features into a new set of uncorrelated variables, known as principal components, to reduce dimensionality while capturing the most significant patterns and variation [39, 40]. The number of principal components was chosen just large enough to ensure that the cumulative explained variance ratio was more than 80%.
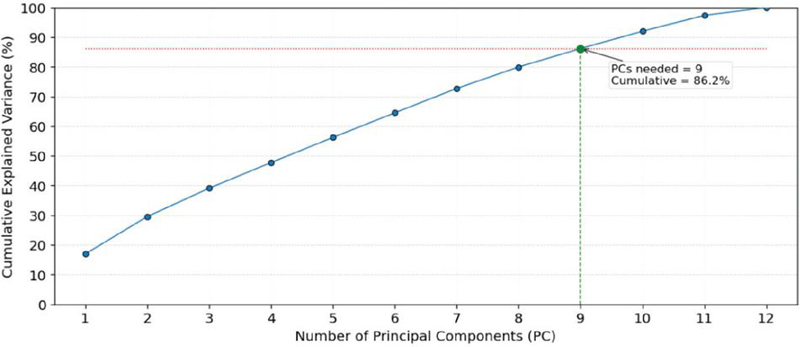
Figure 4 PCA feature selection of Dataset 1.
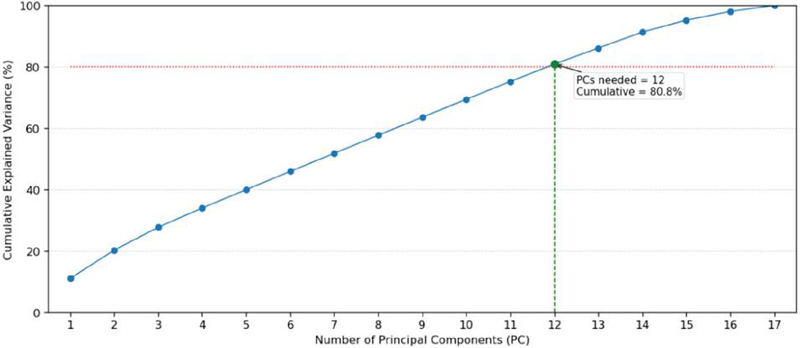
Figure 5 PCA feature selection of Dataset 2.
The cumulative explained variance plots in Figures 4 and 5 demonstrate how the principal components contribute to the total variance in each dataset. In Dataset 1, nine principal components are required to reach the 80% cumulative variance threshold, indicating that the data structure is relatively compact, with high inter-feature correlation and low complexity. In contrast, Dataset 2 requires 12 principal components to achieve the same 80% variance threshold. This implies a more complex data distribution, in which information is spread across a larger number of features.
3.2.2 Feature augmentation
The main goal of this study was to construct a new feature, the GPF, to enhance the performance of clustering models. Specifically, the GPF was designed to provide machine learning models with more relevant and informative data to improve their efficiency. It was developed on the basis of domain knowledge, specifically, that performance features should take priority over personal attributes in employee promotion decisions. To construct the GPF, the PCA loading matrix was used to identify features that contribute significant variance within the dataset. Performance features with an average loading score of at least 0.9 were then selected for GPF creation. As a result, in Dataset 1, the selected features were the number of training sessions, length of service, and awards won, as shown in bold in Table 3. Similarly, for Dataset 2, the selected features were awards won, past disciplinary action, previous intradepartmental movement, and the number of previous employers, as shown in bold in Table 4.
Table 3 Average loading scores of Dataset 1
| No. | Feature | Feature Category | Average Loading Score |
| 1 | Department | Personal | 0.866 |
| 2 | Region | Personal | 0.989 |
| 3 | Education | Personal | 0.913 |
| 4 | Gender | Personal | 0.997 |
| 5 | Recruitment channel | Personal | 0.999 |
| 6 | Number of training sessions | Performance | 0.996 |
| 7 | Age | Personal | 0.899 |
| 8 | Previous year’s rating | Performance | 0.840 |
| 9 | Length of service | Performance | 0.906 |
| 10 | KPI | Performance | 0.837 |
| 11 | Awards won | Performance | 0.989 |
| 12 | Average training score | Performance | 0.876 |
Table 4 Average loading scores of Dataset 2
| No. | Features | Feature Category | Average Loading Score |
| 1 | Division | Personal | 0.865 |
| 2 | Qualification | Personal | 0.527 |
| 3 | Gender | Personal | 0.790 |
| 4 | Recruitment channel | Personal | 0.990 |
| 5 | Training sessions attended | Performance | 0.764 |
| 6 | Year of birth | Personal | 0.883 |
| 7 | Last performance score | Performance | 0.823 |
| 8 | Year of recruitment | Personal | 0.868 |
| 9 | KPI target met | Performance | 0.826 |
| 10 | Awards won | Performance | 0.978 |
| 11 | Training score average | Performance | 0.849 |
| 12 | State of origin | Personal | 0.988 |
| 13 | Foreign schooled | Personal | 0.993 |
| 14 | Marital status | Personal | 0.999 |
| 15 | Past disciplinary action | Performance | 0.996 |
| 16 | Previous intradepartmental movement | Performance | 0.998 |
| 17 | Number of previous employers | Performance | 0.997 |
To construct the GPF, predefined thresholds for all relevant performance-related features were established on the basis of domain expertise. These thresholds serve as benchmarks representing satisfactory to excellent performance levels that influence promotion decisions (e.g., KPI 80%, training score 90). The appropriate thresholds may vary between organizations and contextual settings. The GPF was subsequently derived from the extent to which each feature exceeded its predefined threshold, with only features surpassing these thresholds contributing to the construction of the GPF. The GPF creation process is detailed in Algorithm 1.
Algorithm 1: GPF creation
Input:
dataset: List of data records, each containing a set of feature–value pairs.
performance_features: Subset of performance-related features selected for GPF construction, each with an average loading score 0.9.
target_values: List of predefined threshold values corresponding to each selected performance feature (e.g., KPI 80%, target_values 1).
Output:
gpf: Computed GPF score appended to each record in the dataset.
Procedure:
1. Initialize num_features length(performance_features)
2. Compute score_per_match 100 / num_features
3. For each record dataset do
3.1 Initialize gpf_score 0
3.2 For i 0 to num_features 1 do
a. feature_name performance_features[i]
b. target_value target_values[i]
c. If record[feature_name] target_value then
gpf_score gpf_score + score_per_match
3.3 Assign record[’gpf’] round(gpf_score, 2) # Round to two decimal places
4. Return dataset_with_gpf
The GPF algorithm aggregates multiple performance-oriented features into a single composite score. Each feature is evaluated against its predefined threshold, and scores are accumulated in proportion to the number of features that meet these thresholds. The resulting GPF score represents the overall performance strength of an individual, emphasizing features most relevant to promotion decisions while reducing redundancy among correlated indicators. This should enable models to more accurately identify promotion-eligible employees. From a technical perspective, the composite nature of the GPF sharpens the decision boundaries within clustering or classification tasks, resulting in more cohesive and distinctly separated groups of promotable and non-promotable employees. Consequently, the GPF reduces the ambiguity of decisions and improves the discriminative capability of clustering models.
3.2.3 Combined datasets
After feature extraction and GPF construction, the data combination process was carried out. The selected principal components were combined with the GPF. Samples are shown for Dataset 1 in Table 5 and for Dataset 2 in Table 6. These combined datasets were used to construct the clustering models. A GPF value of 100 indicates that an individual has achieved the predefined thresholds across all principal performance features selected through the PCA process. A GPF value of 0 implies that the individual meets none of these performance criteria. Following the feature combination process, the resulting datasets were standardized to ensure that all features were on a comparable scale for the clustering models.
Table 5 Sample of Dataset 1 after applying PCA and combining with the GPF
| Person | PCA 1 | PCA 2 | PCA 3 | … | PCA 9 | GPF |
| 1 | -5.2184 | 7.5668 | -5.2499 | … | -7.6131 | 100.00 |
| 2 | -5.8452 | -1.3653 | -2.5236 | … | -0.2997 | 66.66 |
| 3 | -5.7413 | -1.9034 | -3.0545 | … | 0.1777 | 33.33 |
| 4 | -3.5715 | -3.3184 | -0.4267 | … | 1.3910 | 0.00 |
Table 6 Sample of Dataset 2 after applying PCA and combining with the GPF
| Person | PCA 1 | PCA 2 | PCA 3 | … | PCA 9 | GPF |
| 1 | -448.315 | -98.4226 | -66.6398 | … | 61.3814 | 100.00 |
| 2 | -450.091 | -98.5547 | -70.6768 | … | 61.2317 | 75.00 |
| 3 | -449.497 | -103.875 | -78.0183 | … | 30.4333 | 50.00 |
| 4 | -450.889 | -104.568 | -78.8663 | … | 28.0983 | 25.00 |
| 5 | -446.980 | -109.987 | -82.7302 | … | 17.3029 | 0.00 |
3.3 Model Construction
Two common clustering models were investigated: K-means and FCM clustering models. K-means clustering ensures that each data point is assigned to a single cluster whose centroid (the mean of all data points within the cluster) is the closest. The number of clusters K is predefined. The algorithm iteratively updates the cluster centroids and reassigns points until convergence. K-means clustering is particularly well suited for datasets that are clearly divided into distinct subgroups, with the data points exhibiting a circular or elliptical distribution or following a linear relationship. Additionally, it is most effective when the number of clusters is known in advance.
The FCM clustering algorithm is a widely used fuzzy clustering method in which each data point can belong to multiple clusters with membership degrees ranging from 0 to 1. The algorithm adjusts membership values on the basis of the distance to cluster centroids, assigning higher values to points closer to a centroid and lower values to those farther away. Fuzzy clustering is particularly suitable for datasets in which group divisions are not clearly defined or data points overlap across multiple clusters.
Before creating clustering models, all features were normalized using Z-scores so that each feature had a mean of 0 and a standard deviation of 1. K-means clustering was performed across a range of K values . The results were evaluated using the elbow method and the silhouette score; they consistently indicated that provided the most stable and interpretable clustering structure after applying the GPF and PCA. Therefore, was selected as the optimal number of clusters for K-means clustering. FCM clustering was also performed with two clusters, representing promotion and non-promotion clusters. Multiple combined datasets were examined for Datasets 1 and 2 to determine which combination yielded the best employee promotion models for both datasets.
3.4 Performance Evaluation
The metrics used to evaluate the promotion clustering model were RI, MI, V, and FMI. The details of each are provided below.
RI measures the similarity between two clusterings by comparing whether data points are assigned to the same cluster. Higher RI values indicate greater similarity between the clustering results and the ground truth. RI is determined as follows:
| (1) |
where is the number of true positives (pairs of data points that are assigned to the same cluster by the algorithm and in the ground truth), is the number of true negatives, is the number of false positives, and is the number of false negatives.
MI measures the mutual dependence between the clustering results and the true labels of the data. It quantifies the shared information between two label assignments, with higher MI values indicating that the clustering provides more information about the true labels. MI is calculated as follows:
| (2) |
where is the mutual information score, with denoting class labels and cluster labels, is the entropy of the class labels, and is the conditional entropy of the class labels given the clustering .
V-measure evaluates the agreement between two independent cluster assignments on the same dataset. It combines homogeneity and completeness into a single score. Homogeneity measures how well the assigned points within a cluster belong together according to the ground truth, whereas completeness assesses how well all data points from the same class are grouped into a single cluster. A higher V-measure indicates better clustering performance overall. V-measure is calculated as follows:
| (3) |
where is the V-measure, measures the extent to which each cluster contains only data points from the same class, and measures the extent to which all data points from a given class are assigned to a single cluster.
FMI is an external evaluation metric that measures the similarity between the clusters produced by an algorithm and the ground truth, calculated as the geometric mean of precision and recall. It is calculated using the following equation:
| (4) |
4 Results and Discussion
4.1 Employee Promotion Model with K-means Clustering
The performance measures of all constructed K-means clustering models with different data combinations are listed in Tables 7 and 8 for Datasets 1 and 2. In these tables, the original dataset is the dataset containing raw data that has undergone the data preprocessing process.
Table 7 Model performance comparison of K-means clustering for Dataset 1
| Performance Matrix | ||||
| Dataset 1 | RI | FMI | MI | V |
| Original dataset | 0.5234 | 0.6714 | 0.0000 | 0.0000 |
| Original dataset with GPF | 0.5096 | 0.6584 | 0.0002 | 0.0005 |
| PCA-transformed dataset | 0.5767 | 0.7182 | 0.0000 | 0.0000 |
| PCA-transformed dataset with GPF | 0.8395 | 0.9125 | 0.0108 | 0.0540 |
Table 8 Model performance comparison of K-means clustering for Dataset 2
| Performance Matrix | ||||
| Dataset 2 | RI | FMI | MI | V |
| Original dataset | 0.5222 | 0.6691 | 0.0046 | 0.0097 |
| Original dataset with GPF | 0.5909 | 0.7291 | 0.0011 | 0.0027 |
| PCA-transformed dataset | 0.8359 | 0.9099 | 0.0102 | 0.0496 |
| PCA-transformed dataset with GPF | 0.8411 | 0.9134 | 0.0113 | 0.0567 |
The datasets incorporating both PCA and the GPF achieved the highest clustering performance under the K-means model. For Dataset 1, the PCA and GPF configuration achieved the best clustering performance, showing substantial improvements across all evaluation metrics compared with other configurations. The RI and FMI values increased sharply to 0.8395 and 0.9125, respectively, compared with 0.5234 and 0.6714 in the original dataset, indicating significantly enhanced cluster compactness and separation. The MI and V values also improved to 0.0108 and 0.0540, suggesting stronger alignment between the identified clusters and the true promotion categories. In contrast, the dataset using only the GPF showed minimal improvement, and PCA alone enhanced the performance by a moderate amount (RI 0.5767, FMI 0.7182).
For Dataset 2, the PCA and GPF configuration also achieved the best overall clustering performance across all evaluation metrics. The RI and FMI values increased to 0.8411 and 0.9134, respectively, compared with 0.5222 and 0.6691 in the original dataset, demonstrating substantial improvement in cluster compactness and separability. Similarly, the MI and V values rose to 0.0113 and 0.0567, indicating stronger correspondence between the identified clusters and the actual promotion categories. The dataset using only the GPF showed modest enhancement (RI 0.5909, FMI 0.7291), whereas the one with PCA alone provided a significant performance boost (RI 0.8359, FMI 0.9099).
These results confirm that integrating PCA and the GPF produces the most refined feature representation, leading to clearer, more cohesive, and interpretable clusters that effectively capture the underlying promotion-related performance patterns.
4.2 Employee Promotion Model with FCM
The performance of each constructed FCM clustering model for Datasets 1 and 2 is detailed in Tables 9 and 10, respectively. Unlike with K-means clustering, substantially different behaviors can be seen for the two datasets.
Table 9 Model performance comparison of FCM clustering for Dataset 1
| Performance Matrix | ||||
| Dataset 1 | RI | FMI | MI | V |
| Original dataset | 0.5049 | 0.6542 | 0.0000 | 0.0000 |
| Original dataset with GPF | 0.5008 | 0.6504 | 0.0002 | 0.0006 |
| PCA-transformed dataset | 0.5386 | 0.6840 | 0.0012 | 0.0006 |
| PCA-transformed dataset with GPF | 0.5344 | 0.6800 | 0.0017 | 0.0026 |
Table 10 Model performance comparison of FCM clustering for Dataset 2
| Performance Matrix | ||||
| Dataset 2 | RI | FMI | MI | V |
| Original dataset | 0.5047 | 0.6537 | 0.0125 | 0.0256 |
| Original dataset with GPF | 0.5097 | 0.6582 | 0.0040 | 0.0082 |
| PCA-transformed dataset | 0.5103 | 0.6585 | 0.0063 | 0.0129 |
| PCA-transformed dataset with GPF | 0.5162 | 0.6636 | 0.0065 | 0.0133 |
For Dataset 1, the PCA-transformed dataset achieved a slightly higher structural clustering performance (RI 0.5386, FMI 0.6840) than the PCA and GPF configuration (RI 0.5344, FMI 0.6800). This suggests that the PCA transformation alone effectively enhanced cluster compactness and separation by reducing noise and dimensional redundancy. However, when the GPF was added, the MI and V values increased (from 0.0012 to 0.0017 and from 0.0006 to 0.0026, respectively), indicating better correspondence between the generated clusters and the true class structure. These results suggest that PCA strengthens the structural quality of clustering, whereas the GPF contributes to improved interpretability and semantic alignment with the underlying promotion categories, even if it compromises the compactness slightly.
For Dataset 2, the PCA and GPF configuration improved the structural quality of clustering, as reflected by the higher RI (0.5162) and FMI (0.6636) values compared with the original dataset (RI 0.5047, FMI 0.6537). However, the alignment with the original class labels slightly decreased, with MI dropping from 0.0125 to 0.0065 and the V-measure from 0.0256 to 0.0133. This indicates that although the combined features helped create tighter and more distinct clusters, the resulting groups did not fully correspond to the predefined promotion categories. This suggests that the model may have uncovered latent performance patterns not entirely represented in the existing promotion labels, which could help to identify previously unrecognized employee subgroups that traditional evaluation methods might overlook.
4.3 Discussion
4.3.1 Analytical framework
Across both datasets and clustering models, a consistent pattern was observed: the use of both PCA and the GPF markedly enhanced clustering quality compared with using either method alone. PCA consistently improved structural compactness and separation by reducing noise and dimensional redundancy, as reflected in the higher RI and FMI values for both K-means and FCM clustering. Meanwhile, the GPF strengthened the interpretability and semantic alignment of clusters, often improving MI and the V-measure. The K-means model demonstrated greater sensitivity to these feature improvements, achieving substantially higher scores across all metrics, whereas the FCM model benefited only moderately because of its fuzzy methodology, which allows partial overlaps between clusters. Nevertheless, the consistent improvement observed in both models confirms that the GPF and PCA complement each other. To further improve clustering performance, future work could focus on optimizing the weighting scheme of the GPF or adapting fuzzy membership functions that better capture the refined feature space introduced by PCA and the GPF.
4.3.2 GPF
The findings suggest that the GPF provided more interpretable data, improving the performance of both K-means and FCM clustering models. From a technical perspective, the GPF is an additive transformation of multiple performance-oriented features into a single composite dimension. This enhances the distinctness of decision boundaries in clustering models by consolidating redundant dimensions into one meaningful axis that aligns with the intrinsic variance structure of the data. As a result, the augmented dataset exhibited clearer separation between promoted and non-promoted employee clusters, thereby improving model interpretability in terms of cluster cohesion and boundary sharpness. In practical terms, the GPF simplifies decision-making by summarizing overlapping performance indicators into a single composite score that reflects overall employee performance potential. This score makes the results easier to understand, communicate, and justify in real-world HR decision-making.
Additionally, the GPF was designed to reflect the principle of fairness by being constructed exclusively from performance-oriented features, excluding any personal or demographic features. This ensures that the model’s clustering and promotion analysis are driven purely by objective performance indicators, minimizing potential bias in decision outcomes. However, a more detailed evaluation of fairness should be a high priority in future research. In particular, analyzing the demographic breakdown of the promoted and non-promoted clusters generated by the best-performing model could provide valuable evidence to support or challenge the fairness of the approach.
4.3.3 Practical implementation of the proposed framework
From an implementation perspective, the proposed framework can be integrated into an HR analytics system to support transparent, data-driven promotion decisions. The input features can include both personal and performance-oriented features, depending on the organization’s data availability and policies. The GPF is constructed using a predefined set of successful performance indicators, which can be customized by HR departments to reflect their organization’s goals and promotion criteria. The output clusters represent groups of employees with similar performance profiles, ranging from high promotion readiness to those needing further development. This flexibility allows organizations to tailor the framework to their specific context while ensuring transparency in how promotion decisions are derived, fostering greater fairness and accountability in HR decision-making.
For decision-makers, the resulting clusters provide actionable business intelligence that directly supports strategic HR planning and workforce optimization. Clusters with high average GPF values typically represent employees demonstrating strong promotion readiness, enabling HR departments to identify top-performing talent for leadership succession or advanced career progression. Intermediate clusters point to employees with some potential who could benefit from targeted training, mentoring, or performance improvement initiatives, ensuring systematic and equitable talent development. In contrast, clusters with lower GPF values indicate individuals or teams that may require reskilling, competency enhancement, or performance support, allowing proactive measures to be taken before productivity gaps widen. These clustering outcomes can be used by HR departments to align promotion decisions, development programs, and workforce planning within a transparent, fair, and data-driven framework, enhancing both organizational effectiveness and equity in employee advancement.
4.3.4 Limitations and future work
Although the findings of this study demonstrate the potential and applicability of the proposed framework, several limitations could be addressed in future research. First, the use of a public Kaggle dataset offers a solid foundation for methodological exploration; however, validation with real organizational data would be needed to demonstrate the framework’s generalizability and contextual relevance. Future studies should also investigate alternative clustering models to improve the robustness and adaptability of the proposed approach to diverse datasets and organizational settings. Second, the framework simplifies career progression through a binary promotion assumption (promoted vs. non-promoted). Future research could extend this assumption to multi-level promotion pathways or dynamic performance trajectories. Additionally, the GPF could be refined by incorporating feature-specific weightings derived from data-driven measures to better capture the varying influence of performance factors. Finally, the PCA variance threshold was fixed at 80%, and the minimum average loading for selecting performance features was fixed at 0.9; these can both affect the feature representation and GPF generation. A lower threshold may exclude key features, whereas a higher one may retain redundant or noisy components, reducing cluster clarity. Likewise, a strict loading cutoff may limit feature diversity and overemphasize dominant features. Future work should consider adaptive or data-driven criteria for determining optimal variance thresholds and feature loadings to ensure stable and interpretable GPF construction across datasets.
5 Conclusion
This study presents an effective and interpretable framework for employee promotion clustering by integrating PCA with the proposed GPF. This combination of feature extraction and augmentation improves data quality, enhances cluster separability, and strengthens the overall generalizability of clustering-based promotion models. Experimental results on two public datasets confirmed that the framework achieves consistent performance gains across multiple evaluation metrics, with K-means clustering models outperforming FCM models. Notably, K-means clustering achieved superior performance to FCM clustering across all metrics and datasets. The proposed approach has demonstrated a strong potential for supporting fair, transparent, and data-driven promotion decisions. Future research will aim to enhance the effectiveness of the GPF and improve the robustness and generalizability of the proposed framework by evaluating it with alternative clustering models and diverse HR datasets.
Acknowledgements
This work was supported by the Computer and Communication Engineering for Capacity Building Research Center (CCC). The publication was supported by Mae Fah Luang University.
References
[1] Yildirmaz, A., C. Ryan, and J. Nezaj. 2019. 2019 State of the Workforce Report: Pay, Promotions and Retention. p. B4–B7.
[2] Jay, S. 2023. What is a (good) promotion rate and how to calculate it. Retrieved from https://www.aihr.com/blog/promotion-rate/#what
[3] Yiğit, F. 2023. A three-stage fuzzy neutrosophic decision support system for human resources decisions in organizations. Decis. Anal. J. 7: 100259. doi: 10.1016/j.dajour.2023.100259.
[4] Ligare, B. S., K. W. Wanyama, and V. L. Aliata. 2020. Job promotion and employee performance among the Administration Police in Bungoma County, Kenya. Cross Curr. Int. J. Econ. Manag. Media Stud. 2: 34–41.
[5] Noori, R. 2023. The state of promotions at work: How companies can fuel employee growth in 2023. Retrieved from https://nectarhr.com/blog/workplace-promotion-statistics.
[6] Liu, J., T. Wang, J. Li, J. Huang, F. Yao, and R. He. 2019. A data-driven analysis of employee promotion: The role of the position of organization. 2019 IEEE International Conference on Systems, Man and Cybernetics (SMC). p. 4056–4062.
[7] Alqahtani, F. A., and A. Almaleh. 2022. Analysis and prediction of employee promotions using machine learning. 2022 5th International Conference on Data Science and Information Technology (DSIT). p. 1–9.
[8] Long, Y., J. Liu, M. Fang, T. Wang, and W. Jiang. 2018. Prediction of employee promotion based on personal basic features and post features. International Conference on Data Processing and Applications. p. 5–10.
[9] Pahmi, S., S. Saepudin, N. Maesarah, U. I. Solehudin, and Wulandari. 2018. Implementation of CART (classification and regression trees) algorithm for determining factors affecting employee performance. 2018 International Conference on Computing, Engineering, and Design (ICCED). p. 57–62.
[10] Priyanka, R., K. Ravindran, B. Sankaranarayanan, and S. M. Ali. 2023. A fuzzy DEMATEL decision modelling framework for identifying key human resources challenges in start-up companies: Implications for sustainable development. Decis. Anal. J. 6: 100192. doi: 10.1016/j.dajour.2023.100192.
[11] Tang, A., T. Lu, Z. S. Lynch, O. Schaer, and S. Adams. 2020. Enhancing promotion decisions using classification and network-based methods. 2020 Systems and Information Engineering Design Symposium (SIEDS). p. 1–6.
[12] Kaewwiset, T., and P. Temdee. 2022. Promotion classification using decision tree and principal component analysis. 2022 Joint International Conference on Digital Arts, Media and Technology with ECTI Northern Section Conference on Electrical, Electronics, Computer and Telecommunications Engineering (ECTI DAMT & NCON). p. 489–492.
[13] Ilwani, M., G. Nassreddine, and J. A. Younis. 2023. Machine learning application on employee promotion. Mesop. J. Comput. Sci. 2023: 100–114.
[14] Sahinbas, K. 2022. Employee promotion prediction by using machine learning algorithms for imbalanced dataset. 2022 2nd International Conference on Computing and Machine Intelligence (ICMI). p. 1–5.
[15] Dang, Q., M. Truong, and M. Huynh. 2021. Studying the fuzzy clustering methods to understand employee performance. 2021 4th International Conference on Artificial Intelligence and Big Data (ICAIBD). p. 541–544.
[16] Mousavian, S.A., A. Haeri, and F. Moslehi. 2021. Providing a hybrid clustering method as an auxiliary system in automatic labeling to divide employee into different levels of productivity and their retention. Iran. J. Manag. Stud. 15: 207–226.
[17] Todeschini, B. V., C. M. Rodrigues, M. J. Anzanello, and G. L. Tortorella. 2016. Clustering tool usage to align a company strategy to its talent management needs. Eur. J. Appl. Bus. Manag. 2.
[18] Sun, Q., T. Wu, and J. Hua. 2022. Design of distributed human resource management system of Spark framework based on fuzzy clustering. J. Sens. 2022: 1–9.
[19] Liu, Y., C. Xie, X. Chen, Q. Zhu, and Y. Sun. 2023. Intelligent collection system of human resource information based on clustering algorithm. International Conference on Signal Processing and Communication Technology (SPCT 2022). p. 126151Z.
[20] Sun, H., and Q. Li. 2019. Research on application of PCA and K-means clustering in enterprise human resources. Proceeding of the 24th International Conference on Industrial Engineering and Engineering Management 2018. p. 695–705.
[21] Zhao, Y. 2020. Application of K-means clustering algorithm in human resource data informatization. Proceedings of the 2020 International Conference on Cyberspace Innovation of Advanced Technologies. p. 12–16.
[22] Sarker, A., S. M. Shamim, M. S. Zama, and M. A. Rahman. 2018. Employee’s performance analysis and prediction using K-means clustering & decision tree algorithm. Glob. J. Comput. Sci. Technol. 18: 1–5.
[23] Thakur, D., A. Guzzo, and G. Fortino. 2021. t-SNE and PCA in ensemble learning based human activity recognition with smartwatch. 2021 IEEE 2nd International Conference on Human-Machine Systems (ICHMS). p. 1–6.
[24] Petkov, P. N., H. Helgason, and W. Kleijn. 2012. Feature set augmentation for enhancing the performance of a non-intrusive quality predictor. 2012 Fourth International Workshop on Quality of Multimedia Experience. p. 121–126.
[25] Duan, Y., X. Niu, and G. Nie. 2018. Data augmentation based on interest points of feature. International Conference on Digital Image Processing. p. 108060B.
[26] Bagdadli, S., Q. M. Roberson, and F. Paoletti. 2006. The mediating role of procedural justice in responses to promotion decisions. J. Bus. Psychol. 21: 83–102.
[27] Gathungu, E., M. Iravo, and S. Namusonge. 2015. Effect of promotion strategies on the organizational commitment of banking sector employees in Kenya. IOSR J. Humanit. Soc. Sci. 20: 36–45. doi: 10.9790/0837-201013645.
[28] Klaauw, B. V., and A. Dias da Silva. 2006. Wage dynamics and promotions inside and between firms. J. Popul. Econ. 24: 1513–1548.
[29] Huang, Y. B. 2009. Study of college human resources data mining based on the SOM algorithm. 2009 Asia-Pacific Conference on Information Processing. p. 324–327.
[30] Isaac, R. G., W. J. Zerbe, and D. C. Pitt. 2001. Leadership and motivation: The effective application of expectancy theory. J. Manag. Issues 13: 212.
[31] Silva, I. E., and R. A. Krohling. 2018. A fuzzy sociometric approach to human resource allocation. 2018 IEEE International Conference on Fuzzy Systems (FUZZ-IEEE). p. 1–8.
[32] Liu, Y. 2021. Analysis of human resource management mode and its selection factors based on clustering algorithm. 2021 IEEE International Conference on Advances in Electrical Engineering and Computer Applications (AEECA). p. 535–538.
[33] Ouyang, J., and H. Ge. 2020. Data analysis framework of human resource estimation system based on MySQL-SAAS and fuzzy clustering. 2020 International Conference on Smart Electronics and Communication (ICOSEC). p. 417–420.
[34] Wang, Z. 2021. Research on digital economy and human resources based on fuzzy clustering and edge computing. Secur. Commun. Netw. 2021: 5583967.
[35] Peng, F., M. Guo, C. Zheng, S. Wang, X. Wang, and M. Xu. 2023. An assessment model of digital literacy for the students in vocational education based on principal component analysis in machine learning. 2023 IEEE 6th Information Technology, Networking, Electronic and Automation Control Conference (ITNEC). p. 1382–1386.
[36] Guo, Z., and Y. Zhang. 2010. The third-party logistics performance evaluation based on the AHP-PCA model. 2010 International Conference on E-Product E-Service and E-Entertainment. p. 1–4.
[37] Kumar, S. 2020. HR analysis case study. Retrieved October 1, 2022, from https://www.kaggle.com/shivan118/hranalysis.
[38] Sulaiman, M. 2019. Data science staff promotion prediction. Retrieved October 1, 2022, from https://www.kaggle.com/datasets/behordeun/data-science-staff-promotion-prediction
[39] Liu, L., Q. Wang, M. Dong, Z. Zhang, Y. Li, Z. Wang, and S. Wang. 2020. Application of K-means ++ algorithm based on t-SNE dimension reduction in transformer district clustering. 2020 Asia Energy and Electrical Engineering Symposium (AEEES). p. 74–78. doi: 10.1109/aeees48850.2020.9121438.
[40] Pal, K., and M. Sharma. 2020. Performance evaluation of non-linear techniques UMAP and t-SNE for data in higher dimensional topological space. 2020 Fourth International Conference on I-SMAC (IoT in Social, Mobile, Analytics and Cloud) (I-SMAC). p. 1106–1110. doi: 10.1109/I-SMAC49090.2020.9243502.
Biographies

Theeramet Kaewwiset received his B.Eng in Software Engineering from Mae Fah Luang University and his M. Eng in Computer Engineering from Mae Fah Luang University. He is currently studying for a Ph.D. in Computer Engineering at School of Applied Digital Technology, Mae Fah Luang University. His research interests include artificial intelligence and machine learning.

Punnarumol Temdee received her B.Eng. in Electronic and Telecommunication Engineering, M. Eng in Electrical Engineering, and Ph.D. in Electrical and Computer Engineering from King Mongkut’s University of Technology Thonburi. She is currently a lecturer at School of Applied Digital Technology, Mae Fah Luang University, Chiang Rai, Thailand. Her research interests are social network analysis, artificial intelligence, software agent, context-aware computing, and ubiquitous computing.
Journal of Mobile Multimedia, Vol. 21_6, 1167–1194.
doi: 10.13052/jmm1550-4646.2167
© 2025 River Publishers