A Real-time Data-driven Multimedia Platform Integrating Public Data and AI-based Facial Generation for Personalized Interaction
Jungjo Na, Miso Kim and Hyeon Gyu Kim*
Duksung Women’s University, Republic of Korea
E-mail: jungjona@duksung.ac.kr; 927kmss@gmail.com; hgkim@duksung.ac.kr
*Corresponding Author
Received 17 September 2025; Accepted 05 November 2025
Abstract
This study proposes a data-driven interactive multimedia platform that integrates real-time environmental and demographic data visualization with AI-based facial generation to deliver dynamic and immersive user experiences. The system combines image generation AI with data visualization in a unified framework, enabling real-time, personalized interaction. Real-time weather and demographic data are collected and processed through public APIs provided by Seoul Metropolitan Government, and these data streams are mapped to visual parameters such as sky color, cloud density, and background environments to reflect local conditions dynamically. Facial generation is carried out using a fine-tuned stable diffusion model trained on a Korean facial dataset categorized by age and gender. The generated face meshes are refined using detailed expression capture and animation (DECA) and implemented as MetaHuman characters within Unreal Engine to produce expressive real-time avatars. The platform adopts a client–server architecture and leverages cloud-based asset management to efficiently handle real-time data and 3D resources. This approach demonstrates a novel form of interactive media experience that merges real-time public data with AI-driven personalization and presents new opportunities for interdisciplinary HCI research that bridges art, design, urban data, and artificial intelligence.
Keywords: Real-time data visualization, AI-based facial generation, stable diffusion, public data APIs, interactive multimedia platform, human–computer interaction (HCI), urban data integration.
1 Introduction
1.1 Background and Motivation
With the rapid advancement of urban environments and digital technologies, research on interactive systems driven by real-time data has gained increasing attention, and these systems are evolving into more complex and dynamic forms [1]. Data-rich cities offer individuals diverse behavioral options based on continuous social interactions [2]. In particular, within the context of smart city development, digital twin systems utilize physics-based models combined with machine learning to perform predictive analytics and simulations, enabling real-time reflection of urban dynamics. Such systems require continuous data updates and synchronization [3].
Collecting, analyzing, and visualizing various public datasets – such as weather, transportation, and demographic information – in real time makes data more engaging, useful, and understandable, which highlights the growing need for advanced visualization techniques to improve citizens’ quality of life [4]. Recent studies on data visualization are largely categorized into static and interactive approaches. Static charts only present the results visually without allowing users to manipulate or interact with the data [5]. In contrast, interactive visualization allows users to explore or adjust visual elements to uncover hidden patterns and gain deeper insights. However, many existing studies still rely on static outputs or provide only limited interaction, which constrains their ability to deliver personalized analyses or user experiences [5]. For example, while urban data are often presented as maps or graphs, such methods rarely offer dynamic visualization or immersive interactions directly connected to user experience.
Meanwhile, AI-based facial generation technologies have gained attention with the development of GAN (generative adversarial networks) and Autoencoder-based models. Early GAN-based approaches, such as StyleGAN, achieved remarkable results in producing realistic and high-resolution facial images, yet they suffered from limitations like training instability and mode collapse [6]. More recently, diffusion models have addressed these issues by generating high-quality facial images through a gradual noise removal process, offering greater stability and precision [7]. In this study, Stable Diffusion – a representative diffusion-based model – was employed to generate high-resolution facial images, which were then used to create personalized avatars. Korean facial features were learned using Stable Diffusion combined with DreamBooth, and the generated images were reconstructed into animated 3D avatars through DECA (Detailed Expression Capture and Animation), enabling real-time facial animation and interaction [8].
The real-time datasets used in this study were obtained from public data APIs provided by the Seoul Metropolitan Government and the Korea Meteorological Administration (KMA) [9]. Real-time population data were sourced from major Korean telecommunications companies (KT and SKT) [10, 11], which estimate crowd levels in major Seoul areas based on mobile signal activity. These datasets include information on public transportation boarding and alighting counts, location-specific visitor statistics, and the ratio of residential to non-residential populations, as well as gender and age distributions. From this data, the dominant gender and age group at each location were identified and used to generate corresponding facial images and 3D meshes. These meshes were imported into Unreal Engine and connected with MetaHuman to produce personalized avatars.
Additionally, ultra-short-term weather observation data from the KMA were used to adjust environmental parameters such as sky brightness, color tones, cloud density, and movement speed, enabling real-time environmental rendering within Unreal Engine.
This study aims to develop a data-driven multimedia platform that integrates real-time public datasets with AI-based facial generation. In this platform, users can explore interactive infographics and personalized avatars that reflect real-time public data from their selected region. This approach goes beyond conventional visualization or AI face generation techniques, providing an immersive experience from an HCI perspective. Accordingly, this research highlights the necessity and potential of interdisciplinary studies that bridge art, design, urban data, and artificial intelligence.
1.2 Research Objectives and Contributions
The primary objective of this study is to design and implement a personalized interactive multimedia platform that integrates real-time environmental and demographic data with AI-based facial generation technologies. This platform aims to deliver data-driven personalized experiences and to present new opportunities for interdisciplinary research that bridges human–computer interaction, urban data, and generative media technologies. The main contributions are as follows:
Development of a platform integrating real-time environmental/demographic data with AI-based facial generation:
The platform collects and processes real-time weather and demographic data from public APIs provided by the Seoul Metropolitan Government. These data streams are mapped to visual parameters such as sky color, cloud density, and background environments, enabling dynamic visual representations of selected regions. Furthermore, the system generates personalized avatars by combining a fine-tuned Stable Diffusion model for AI-based face generation with DECA and MetaHuman technologies, which reflect the dominant demographic characteristics of each selected area. This approach provides an immersive and interactive environment that goes beyond conventional information delivery or static data visualization.
Implementation of a data-driven personalized interaction model:
The platform is designed with a client–server architecture and uses cloud-based 3D asset management to support real-time interaction. The system dynamically responds to user selections and environmental changes, allowing users to actively manipulate their experience. Unlike traditional visualization systems or stand-alone AI face generation tools, this approach enables user-driven exploration and immersion, presenting a novel interaction model from an HCI perspective.
Introducing an interdisciplinary framework linking HCI, media art, and urban data:
By integrating artistic expression, media art, urban public data, and AI technologies, the proposed platform creates opportunities to expand interdisciplinary research. The combination of real-time data with AI-generated avatars supports both urban data visualization and interactive media art experiences, enhancing user immersion and engagement. Moreover, the design principles and integration strategies developed in this process may serve as a foundation for future applications in smart cities, interactive exhibitions, education, and entertainment contexts.
1.3 Structure of the Paper
The remainder of this paper is structured as follows.
Section 2 provides an overview of the related literature, examining previous studies on data-driven interactive visualization platforms, AI-based facial generation techniques, and generative media art, as well as existing applications of real-time public data within smart city contexts.
Section 3 outlines the research methodology employed for developing the proposed platform. This section details the overall system architecture, procedures for data collection and processing, and the design of the core functional components, including the data visualization module, the AI-based facial generation module, and the client–server framework.
Section 4 presents the implementation of the proposed system, describing the real-time visualization process, the integration of AI-driven facial transformation with MetaHuman characters, and the incorporation of personalized interaction features, while also addressing technical challenges encountered during development.
Finally, Section 5 discusses the experimental results, highlights the limitations of the current work, and suggests potential directions for future research.
2 Related Work
2.1 Interactive Platforms Based on Data Visualization
Hydro Tasmania energy portal:
Hydro Tasmania, a public corporation responsible for hydropower and renewable energy operations in Tasmania, Australia, developed a real-time data-driven interactive portal to enhance the efficiency of energy management. This platform continuously collects and visualizes data on power generation by plant, energy consumption patterns, reservoir levels, and weather conditions. It provides intuitive graphs and dashboards that enable both administrators and citizens to monitor the status of energy production and consumption in real time, supporting more informed and timely decision-making. By combining data visualization with user experience design, the portal moves beyond static information delivery and establishes an interactive environment for managing energy resources [12].
Monash Health Interactive Timeline Tool:
The Monash Health Interactive Timeline Tool, developed by Monash Health in Australia, is an interactive data visualization platform designed to help medical staff and patients understand a patient’s movement and treatment process within the hospital over time. The platform integrates visual components built with HTML, JavaScript, CSS, and Adobe Illustrator to create an interactive dashboard that allows users to explore hospitalization records, diagnostic procedures, and treatment histories in a sequential and intuitive way. By applying user-centered design principles and incorporating interactive functionalities, the system enables medical staff to efficiently manage treatment plans while allowing patients to track and comprehend their medical journeys in real time. This case demonstrates how real-time interactive visualization can extend beyond static data presentation to provide personalized insights and support clinical decision-making [13].
The Pudding: Wine data modeling:
The Pudding project visualizes wine attribute data in an interactive format, allowing users to intuitively explore and analyze complex datasets. Using a dataset of 1600 Portuguese wines, the platform combines data storytelling techniques with interactive visual design to help users directly navigate the dataset and visually identify patterns and correlations. This approach illustrates the potential of user-centered exploration and highlights the importance of interactive experiences in effectively communicating complex information [14].
2.2 AI-based Facial Generation and Generative Media Art
Integration of Stable Diffusion and DECA:
Recent studies have demonstrated approaches that combine a fine-tuned Stable Diffusion model with DECA (Detailed Expression Capture and Animation) to generate personalized 3D avatars. This method precisely captures facial structures and subtle expressions from real individuals, enabling avatars to maintain personal identity while exhibiting expressive variations across different poses and viewing angles. DECA reconstructs both facial geometry and expressions, allowing AI-generated avatars to remain visually consistent while conveying natural emotional states. These technical characteristics contribute to enhancing immersion and user engagement in interactive environments [15].
MetaHuman-based personalized avatars:
By integrating AI-generated facial data with MetaHuman characters, researchers have enabled real-time avatar animation in virtual environments. This combined approach links generative AI with real-time animation, allowing users to experience personalized interactions while dynamically reflecting individual identity. Such systems present innovative potential for use in entertainment, education, and creative content domains [16].
Applications in generative media art:
AI-based facial generation technologies have also been applied to generative media art installations, offering participants dynamic and personalized experiences. These projects combine algorithmically generated content with artistic expression, allowing each viewer to have a unique interactive experience. By mapping facial attributes into interactive visualizations, artists and designers can deliver immersive content that responds in real time to participant input. These examples demonstrate that generative AI can not only create realistic avatars but also produce emotionally engaging art experiences that merge technology with human creativity [17].
2.3 Applications of Real-time Public Data in Smart Cities
Pimpri Chinchwad Municipal Corporation CHDC initiative:
The Pimpri Chinchwad municipal government in India established the City Hub Data Center (CHDC) initiative to centralize urban data and adopt AI-based analytics systems to improve the efficiency of public services. By collecting and analyzing traffic, environmental, public facility, and civil complaint data in real time, the project has reduced response times and enhanced operational management. It also supports data-driven policy-making and administrative service improvement. This initiative contributes to building a participatory and intelligent urban environment by providing real-time information accessibility to both citizens and city administrators [18].
Peachtree Corners smart city deployment:
Peachtree Corners in the United States has implemented a smart city infrastructure based on IoT-enabled 5G networks and AI-driven traffic management systems. The city integrates data from traffic sensors, public services, and environmental monitoring to enable real-time observation, reduce congestion through AI-based analysis, and enhance public safety. Residents can access real-time traffic, service status, and local event information through mobile applications and web portals, while city officials can make data-informed operational decisions. This case illustrates the potential of smart city platforms that combine IoT, AI, and data visualization technologies [19].
City of Las Vegas smart solutions:
Las Vegas operates a smart solution system that integrates and analyzes diverse urban datasets – including traffic, energy consumption, and public safety – in real time. By leveraging AI-based traffic analytics and cloud services, the city reduces congestion, strengthens emergency response, and enhances public safety. In particular, its dashboard-based interactive platform enables both administrators and citizens to monitor the operational status of the city in real time, fostering transparent and participatory urban management. This system highlights the practical value of real-time public data utilization in smart city operations [20].
3 Methodology
3.1 System Overview and Design Objectives
The proposed system is a data-driven multimedia platform that integrates real-time public data with AI-based personalized facial generation. The platform requires three key capabilities to operate effectively: real-time data collection and preprocessing, utilization of large-scale AI models, and real-time 3D rendering and interaction on the client side. To meet these requirements, the overall system was designed using a client–server architecture that separates data processing from visualization, thereby improving operational efficiency.
On the server side, weather, traffic, and demographic data are retrieved from public APIs, processed, and then used to generate avatar facial images and 3D meshes via Stable Diffusion and DECA. The resulting assets are stored in Amazon S3 cloud storage. The client application retrieves these resources (e.g., avatar meshes and textures) as needed and applies them within the platform. It operates within the Unreal Engine environment, handling avatar visualization, environmental rendering, and real-time user interaction. This architecture reduces the computational burden on client devices by offloading resource-intensive AI inference tasks to the server, while enabling lightweight rendering-focused operations on the client side.
The system also leverages Amazon S3 as a reliable object storage service to manage large-scale assets efficiently. Fine-grained access control ensures secure resource management, while server-side caching strategies keep content up to date. This setup allows the platform to maintain scalability and deliver stable data and 3D assets even under concurrent user access, minimizing storage requirements on client devices and supporting stable real-time processing and visualization.
The design of the proposed system is guided by three primary objectives.
First, to overcome the limitations of conventional static data visualization, the platform dynamically updates visual elements – such as sky color, environmental backgrounds, and non-player characters (NPCs) – based on real-time urban data including weather, traffic, and demographic information.
Second, the system generates facial images from urban demographic data using Stable Diffusion, converts them into 3D meshes through DECA, and applies them to MetaHuman characters to produce personalized avatars.
Third, when users select a specific region, its associated data are immediately reflected in both the environment and the avatars, enabling real-time interactive experiences.
Through these objectives, the platform presents an HCI-based multimedia system that merges real-time public data visualization with AI-driven personalized facial generation, supporting both dynamic visual storytelling and user-centered interaction.
3.2 Data Collection and Processing
To collect urban data, this study utilized public APIs provided by the Seoul Metropolitan Government and the Korea Meteorological Administration (KMA). Real-time population data were retrieved from the Seoul Open Data Plaza’s population API, which supplies information at approximately 5-minute intervals for 120 major locations. These data include mobile signal-based estimates of floating population levels, congestion indices, age group and gender distributions, and the ratio of residential to non-residential populations. Weather data were obtained from the KMA’s ultra-short-term observation service, which provides updates every 10 minutes on detailed elements such as temperature, humidity, precipitation type, precipitation amount, wind direction, and wind speed.
All data requests were made through RESTful calls, and responses were received in JSON format. The raw responses were preprocessed by removing unnecessary fields and converting measurement units before being reformatted into a structure compatible with Unreal Engine’s visualization module. For weather data, the API requests included parameters such as base date (base_date), base time (base_time), and grid coordinates (nx, ny). The responses contained the base date/time, coordinates, weather element codes (category), and observed values (obsrValue). From these, the system extracted temperature (T1H), humidity (REH), precipitation type (PTY), precipitation amount (RN1), wind direction (VEC), and wind speed (WSD). The precipitation type field, for example, uses the code PTY with numerical values such as 0 (none), 1 (rain), 2 (rain/snow), and 3 (snow). Additionally, the ultra-short-term forecast API was used every hour to retrieve the sky condition (SKY) parameter.
The population API requests included parameters such as authentication key (KEY), response format (TYPE), service name (SERVICE), query range (START_INDEX, END_INDEX), and area name (AREA_NM). The response contained fields such as area name (AREA_NM) and code (AREA_CD), congestion level (AREA_CONGEST_LVL), minimum and maximum population indices, gender ratio (MALE_PPLTN_RATE, FEMALE_PPLTN_RATE), age-group ratios (PPLTN_RATE_0 to PPLTN_RATE_70), residential and non-residential population ratio, and data timestamp (PPLTN_TIME). From these, this study utilized congestion level, gender ratio, and age-group ratio to generate avatars and drive data visualizations. For example, if the highest proportion of visitors in an area were in their 20s, a corresponding 20s avatar was generated and its gender was adjusted according to the gender distribution.
To ensure real-time performance, the server was designed to poll the weather API every 10 minutes and the population API every 5 minutes. In the event of a failed request, cached data from the previous cycle were used to maintain system continuity. A relational database was implemented to manage these datasets efficiently. The schema included an Area table for basic location information, a WeatherData table for real-time weather observations, and a WeatherForecast table for short-term predictions. A Population table was built to store real-time population data, and an AssetData table was designed to manage the URLs and metadata of avatar meshes and textures generated by AI and stored on Amazon S3.
Through this database-driven management structure, the system achieves real-time responsiveness, reliability, and scalability, enabling users to experience avatar generation and environmental visualization based on the most current urban data available.
3.3 Data Visualization Module
The collected population and weather data were mapped onto various visual elements in Unreal Engine to represent user-selected locations (Figure 1). From the weather API responses, temperature, humidity, sky condition, precipitation type, precipitation amount, wind direction, and wind speed were used (Table 1).
Table 1 Mapping of weather data attributes to visual elements in unreal engine
| Linked | |||||
| Visualization | |||||
| Elements in | |||||
| Data Item | Data Code | Data Type | Data Range | Visual Representation Logic | Unreal Engine |
| Temperature | T1H | Float (C) | 30 to 40 | High temperatures produce warm tones and strong lighting; low temperatures produce cooler bluish tones with softer lighting | Directional light |
| Sky condition | SKY | Categorical (code) | Clear 1, partly cloudy 3, overcast 4 | Clear skies use low cloud density and strong light; overcast skies use high cloud density and low-light environments | Volumetric clouds, PostProcessVolume |
| Humidity | REH | Float (%) | 0 to 100 | High humidity blurs cloud boundaries and reduces contrast (hazy view); low humidity sharpens boundaries and increases contrast | Exponential HeightFog, SkyAtmosphere, Volumetric clouds |
| Precipitation amount | RN1 | Float (mm) | 0 to 50 | Controls the density and intensity of rain/snow particles | Niagara particle |
| Precipitation type | PTY | Categorical (code) | None 0, rain 1, rain/snow 2, snow 3, drizzle 5, sleet 6, snow flurry 7 | Selects appropriate visual effects based on precipitation type | Niagara particle (activation) |
| Wind direction | VEC | Float () | 0 to 360 | Determines the movement direction of clouds and precipitation particles | Niagara particle, volumetric clouds |
| Wind speed | WSD | Float (m/s) | 0 to 30 | Controls the movement speed of clouds and the falling velocity of precipitation particles | Niagara particle, volumetric clouds |
Temperature (T1H) was mapped to the sky’s color tone and the intensity of directional lighting – producing warmer tones and stronger lighting under higher temperatures, and cooler bluish tones with softer lighting under lower temperatures. Humidity (REH) affected cloud contrast; high humidity blurred cloud boundaries and reduced overall contrast, creating a hazy view, while low humidity sharpened cloud edges and increased contrast for clearer distant visibility.
Sky condition was categorized into three levels (clear, partly cloudy, overcast) to control cloud density and sunlight intensity. Clear conditions yielded a bright blue sky and strong light, while overcast conditions reduced contrast to create a dim environment. Precipitation type (PTY) codes were used to render rain, snow, mixed precipitation, drizzle, or snow flurries, while precipitation amount (RN1) determined the intensity. Wind direction (VEC) and wind speed (WSD) were applied to control the movement of clouds and the fall direction and velocity of rain or snow particles.
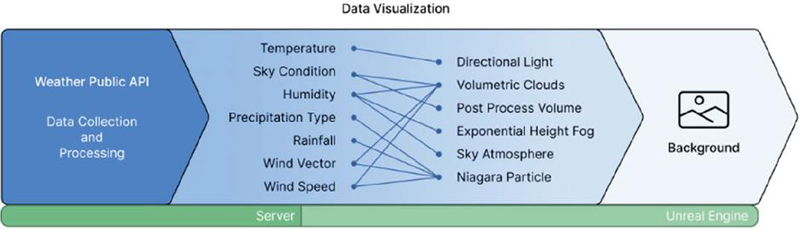
Figure 1 System architecture of the data visualization.
3.4 AI-based Facial Generation Module
Based on the collected population data, the system generates avatars that reflect the dominant age group and gender distribution of each location. For example, if young women in their 20s represent the largest population share at a given site, the system generates a female avatar in her 20s; if men in their 30s are dominant elsewhere, a corresponding male avatar is generated.
To achieve high realism, a specialized training strategy was adopted: rather than using a single model for all demographic conditions, separate models were trained for each age–gender group (Figure 2). Unlike condition-based training, which feeds all conditions into a single model, this approach isolates datasets for each demographic and trains a dedicated model optimized for the salient features of that group. This enables each model to capture age- and gender-specific facial traits – such as skin texture, bone structure, and facial proportions – more accurately, resulting in more realistic and immersive avatars.
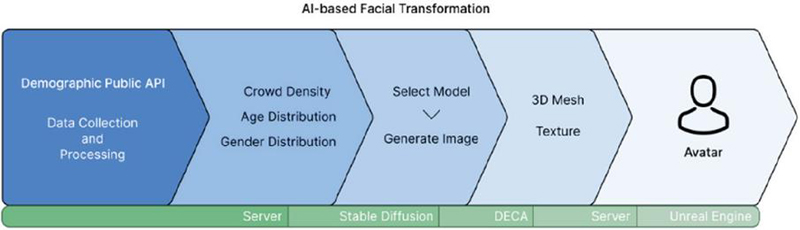
Figure 2 System architecture AI-based facial generation modules.
For training, a Korean facial dataset with clearly labeled age and gender information was required. The AI Hub Korean Family Face Dataset was selected, as it contains annotated age and gender attributes suitable for this study’s specialized model training. The base model was Stable Diffusion, and to enhance its performance on frontal facial images, the majicMIX checkpoint (optimized for portrait synthesis) was used. This base model was further fine-tuned using the DreamBooth method to incorporate Korean-specific facial features and demographic conditions. DreamBooth enables a pre-trained diffusion model to learn new domain-specific concepts from a small set of images, embedding them into the model’s concept space. By training the model with age- and gender-labeled Korean faces, the system could generate avatars that accurately reflect the demographic characteristics of each location.
After generating 2D facial images, DECA (Detailed Expression Capture and Animation) was used to reconstruct 3D facial meshes from the images. DECA extracts facial geometry, expression details, and skin textures, producing high-resolution 3D models that capture subtle wrinkles and micro-expressions. The output included OBJ meshes along with base color maps and normal maps. The base maps provide color information (skin tone, lips, eyes), while the normal maps encode fine surface details and high-frequency shading cues, ensuring realistic rendering under varying lighting conditions.
These textured meshes were applied to Unreal Engine’s MetaHuman characters, significantly enhancing visual realism and immersion beyond basic mesh-based rendering. The resulting 3D assets were stored on Amazon S3 and streamed on demand to the client’s Unreal Engine environment, enabling real-time deployment without relying on local storage and ensuring system scalability.
4 System Implementation
4.1 Real-time Data Visualization
The real-time data visualization module was implemented within the Unreal Engine client environment. The client periodically sends API requests to the server, which either queries public APIs (weather, population) for fresh data or returns the most recent data cached in its database. This approach ensures data continuity by allowing the server to poll public APIs at fixed intervals. Data are transmitted in JSON format, parsed on the client side using C++ to extract core parameters – such as temperature, humidity, wind speed, and precipitation type – which are then mapped to corresponding visual components through a central WeatherController actor blueprint.
The WeatherController manages core environmental assets including Directional light, sky atmosphere, volumetric clouds, and Niagara particle systems.
• Temperature was mapped to light color and intensity using Unreal’s use temperature property of directional light. Higher temperatures reduced the color temperature to 5000 K (warm tones) and increased light intensity up to 12.0 lux, while lower temperatures increased color temperature to 8000 K (cool tones) and reduced intensity to 8.0 lux.
• Sky condition was implemented by customizing Unreal’s volumetric cloud material. The additive mask contribution parameter was dynamically adjusted: 5 for clear skies (sparse clouds), 2.5 for partly cloudy conditions, and 0 for overcast skies. PostProcess volume contrast values were also adapted, producing sharper skies in clear weather and low-contrast hazy visuals in overcast conditions.
• Humidity affected both fog and cloud edge sharpness. Exponential height fog density (0.001–0.1) and sky atmosphere Mie scattering (0.01–0.1) were increased under high humidity, while CloudDensity in volumetric clouds was decreased to blur cloud boundaries.
• Precipitation type controlled activation of Niagara systems: code 0 (none) disabled particles; 1/5 triggered rain effects; 3/7 triggered snow; 2/6 activated both for mixed precipitation. The Niagara blueprints were modified to dynamically respond to precipitation codes and amounts from the API.
• Precipitation amount adjusted particle density and size. For rain, parameters such as RainAmount (5–100) and RainSpeed (0.5–1.5) scaled droplet density and fall speed; for snow, SpawnRate (1000–10000) and SnowSpeed (0.5–1.0) controlled flake frequency and velocity. Mixed precipitation blended both systems at reduced intensity to achieve natural coexistence of fast-falling rain and slowly drifting snow.
• Wind direction and speed influenced cloud drift and particle trajectories. Wind direction values from the API were mapped to the Niagara WindDirection parameter, while SkyDisplacementDensity (0–5) and WindStrength (0–6) adjusted cloud and particle movement speed.
• Time of day effects were incorporated by adjusting the pitch of the directional light to simulate solar movement, producing bright overhead sunlight during the day and warm-toned low-angle light with long shadows at sunset.
This design allowed dynamic, data-driven weather rendering, transforming static visualization into immersive real-time environmental feedback.
4.2 AI-based Facial Generation and MetaHuman Character Integration
To generate avatars that reflect the demographic profile (age and gender) of the selected region, the system combined Stable Diffusion-based DreamBooth fine-tuning with DECA (Detailed Expression Capture and Animation) for 3D facial mesh reconstruction, which were then applied to MetaHuman characters in Unreal Engine.
4.2.1 AI-based facial generation and MetaHuman integration
When a user selects a specific region, the server queries the corresponding demographic API to obtain and analyze the local distributions of age groups and gender. Based on these results, it selects a pre-trained, condition-specific DreamBooth model and generates facial images with Stable Diffusion. DreamBooth training utilized the AI Hub “Korean Family Face” dataset, which includes frontal, profile, and 45 views under diverse lighting conditions (indoor, outdoor, and spotlighted dark backgrounds), making it well suited for facial synthesis and recognition tasks. For this study, we curated frontal images with dark backgrounds and organized them by age brackets for training. Because the API’s “teens” and “70” categories were overly broad and yielded ambiguous facial features, we constrained those ranges to 14–19 years for adolescents and 70–79 years for older adults during model training.
4.2.2 DreamBooth training and execution environment
DreamBooth training was conducted within an Anaconda virtual environment, using majicmix_diffusers as the base model, which is widely recognized for its strong performance in human image generation and has been downloaded over 1.1 million times on the CivitAI platform. Because this study aimed to generate avatars reflecting age- and gender-specific characteristics from Korean demographic data, a model capable of representing East Asian facial features more reliably than conventional Stable Diffusion variants – primarily trained on Western faces – was required. MajicMIX realistic, known for its strength in producing photorealistic Asian faces, was therefore selected as the base model to suit the objective of generating age- and gender-specific Korean avatars.
Training data were separated into instance and class images, each stored in separate directories. Instance images were real Korean faces representing specific age and gender conditions, while class images were generic faces generated by the MajicMIX realistic model under matching conditions derived from the same textual prompts. Unlike conventional DreamBooth practices that often use generic face categories for class images, this study ensured that both instance and class images shared identical conditions. This design helped reinforce consistency in condition-specific representation, reducing training instability caused by condition mismatch. It also allowed the model to learn distinctive features for each demographic group while preserving typical facial structures for those categories, enabling the construction of a model specialized in Korean faces.
All images were preprocessed to 512 512 resolution, matching the Stable Diffusion input size to maximize training efficiency. Fifty instance images and one hundred class images were used per condition. To capture demographic-specific features more precisely, the dataset included a larger number of instance images than typically used in DreamBooth training, and the ratio of class to instance images was set at 2:1 to prioritize realistic Korean facial characteristics over generalization. The learning rate – a key parameter controlling the step size for parameter updates – was set to 1e-5. This value balanced gradual incorporation of condition-specific features while preventing overfitting and preserving the base model’s prior capabilities, which was appropriate given the modest dataset size. The training was capped at 2000 steps, a range generally recommended in DreamBooth studies, to ensure that the model could learn condition-specific features without degrading the base model’s representational ability. Checkpoints were saved periodically, enabling recovery to earlier states if overfitting or performance degradation was detected.
To improve GPU memory efficiency, FP16 mixed-precision computation and the 8-bit Adam optimizer were used, along with xFormers-based memory-efficient attention. Additionally, prior loss weighting was applied to prevent the model from becoming overly biased toward specific conditions. With this configuration, the resulting model effectively incorporated stable age- and gender-specific characteristics while accurately representing realistic Korean facial features.
4.2.3 DECA-based 3D mesh reconstruction
The generated facial images were converted into 3D meshes using DECA (Detailed Expression Capture and Animation). DECA was executed within a separate Anaconda virtual environment to prevent library conflicts with the DreamBooth training environment. During execution, the input images and output directories were specified, and the option to export both textures and 3D meshes simultaneously was enabled. The computation device was set to CUDA to ensure GPU-accelerated processing. This setup allowed the system to reconstruct 3D facial meshes containing expressions, skin details, and normal maps from simple 2D images (Figure 3).
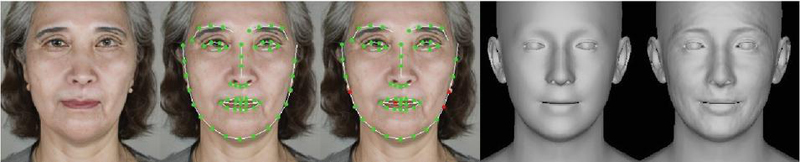
Figure 3 Results of AI-based facial generation.
4.2.4 Pipeline integration and Unreal Engine application
Because Stable Diffusion and DECA require different library versions, they were executed in separate virtual environments through subprocess calls within a FastAPI server. The Python subprocess module enables external programs to run as independent processes while linking their outputs and inputs back to the parent process. This setup allowed the system to safely invoke training and inference tasks from isolated environments without dependency conflicts and to immediately pass the results (such as images and mesh files) to the subsequent processing pipeline. This separation effectively prevented version-related library conflicts between the Stable Diffusion training environment and the DECA execution environment.
Image generation and mesh conversion were integrated at the folder level: once Stable Diffusion generated images and saved them to a designated folder, DECA accessed the same folder to produce 3D meshes and textures. The resulting outputs were initially exported in .obj and texture formats and then converted to .glb during post-processing to provide a lighter format optimized for real-time downloading and application within Unreal Engine. Because DECA’s default mesh scale appeared much smaller than MetaHuman characters, the meshes were uniformly scaled up by approximately 100 during conversion, allowing them to align naturally with MetaHuman body proportions and become immediately usable within the real-time pipeline.
The post-processed meshes and textures were uploaded to Amazon S3 cloud storage, and the server returned their URL links to the Unreal Engine client. The client downloaded these resources directly from S3 using a C++ module. To handle large resources efficiently, the system adopted a queue-based asynchronous download structure and used FHttpModule to prevent blocking the rendering thread. Response code checks and log recording were also implemented to enable error tracing in case of network issues. This architecture helped maintain real-time interactivity even under heavy resource transfer loads.
On the Unreal Engine side, a dedicated blueprint actor was created to attach the downloaded facial meshes to the neck bone of the MetaHuman skeleton. Through this approach, data-driven personalized faces were seamlessly combined with MetaHuman rigging to create realistic avatars. Ultimately, the entire pipeline delivered a fully automated workflow – from new data input to image generation, 3D mesh conversion, cloud upload, URL transmission, client download, and MetaHuman application – enabling end-to-end integration without manual intervention. This fully automated workflow – covering image generation, mesh reconstruction, cloud upload, client download, and MetaHuman integration – enabled real-time creation of personalized avatars from live demographic data while maintaining scalability and interactive responsiveness (Table 2).
Table 2 AI model training and comparative performance
| Item | Value |
| Base model | majicMIX realistic (Stable Diffusion-based) |
| DreamBooth training targets | 10 models by age and gender conditions |
| Number of images (per model) | 50 instance images/100 class images |
| Resolution | 512 512 |
| Learning rate/steps | 1e-5/2000 |
| Optimizer | 8-bit Adam |
| Memory optimization | FP16 + xFormers |
| Pruning/quantization | 15% U-Net channel pruning / INT8 quantization |
Table 3 Model performance comparison
| Condition | ArcFace | SSIM | PSNR | Inference Time (ms) |
| Original model | 0.322 | 0.905 | 27.4 | 1320 |
| Pruning only | 0.341 | 0.899 | 27.0 | 1025 |
| Quantization only | 0.328 | 0.901 | 27.1 | 890 |
| Pruning + quantization | 0.335 | 0.900 | 27.0 | 675 |
Table 3 demonstrates that the proposed pruning and quantization strategies reduced model size and inference time while maintaining image quality within 1–2% degradation, satisfying the requirements for real-time performance.
4.3 Interaction Functionality
The proposed system supports real-time interaction by dynamically adapting both the avatar and environmental elements in response to user input. Within the client environment, users can select a specific location through a map-based interface, and the selected location information is immediately transmitted to the server. The server retrieves demographic and weather data for the chosen coordinates through public APIs, performs preprocessing, and returns the processed data to the client. This data is then mapped to the visualization and avatar generation modules in Unreal Engine, ensuring that the selected region’s characteristics are instantly reflected on the interface.
From a UI/UX perspective, the system combines a map-based interface with menu-based selection to facilitate intuitive user operation. The UI is designed as a HUD-style visual overlay: the top of the screen displays the region name and temperature, while the upper-left corner visualizes demographic distributions by gender and age group. Congestion levels for each location are represented using a staged scale (e.g., “low–moderate–slightly crowded–crowded”), and weather elements such as temperature, humidity, wind speed, and wind direction are shown as line graphs at the bottom left. This layout allows users to intuitively grasp regional data while the background dynamically depicts urban landscapes and weather environments, enhancing immersion.
Avatars and background environments change dynamically based on the regional data. Avatars are generated to reflect the predominant age and gender characteristics from demographic data, while the background environments represent 120 major locations classified into five categories: historical and cultural heritage sites, tourist districts, parks, commercial hubs, and high-density residential areas. Each category is mapped to a representative urban landscape that embodies the region’s socio-cultural context and is visually augmented with real-time weather data. Weather parameters such as temperature, humidity, precipitation amount, precipitation type, wind direction, wind speed, and sky condition are converted into visual elements and applied to the background environment. This approach reconstructs real weather conditions in the virtual environment, enhancing comprehension of numerical data that would otherwise be abstract.
A typical interaction scenario can be illustrated as follows: when a user selects the Jongno district on the Seoul map, the server retrieves the area’s demographic and weather data and sends it to the client. The client then renders traditional architecture representing the “historical and cultural heritage” category as the urban background, while the HUD displays demographic graphs, weather curves, congestion levels, and temperature data. Simultaneously, an avatar is generated to reflect the dominant demographic group (age and gender), and if the weather data indicates “clear,” the environment is rendered with bright lighting and a blue sky. This allows users to experience the socio-environmental characteristics of Jongno in an immersive manner rather than simply viewing numerical statistics.
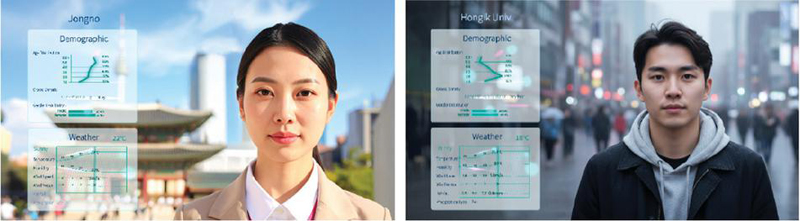
Figure 4 Real-time visualization demo screen.
Additionally, a cloud-motion transition effect is applied during region changes. Clouds sweep across the screen to obscure the current scene, pause at a set moment, and then reveal the new urban environment and avatar. This transition leverages real-time cloud movement data to maintain thematic consistency, conceal potential loading delays, and increase visual focus during scene changes (Figure 4).
In summary, by integrating real-time location-based data with both graphical UI elements and immersive Unreal Engine visualizations, the system enables users to go beyond passive data viewing and engage in an interactive experience that immersively conveys the unique characteristics of their selected region.
4.4 Technical Challenges and Optimization Strategies
The implemented system involves multiple computationally intensive processes – including real-time data integration, AI-based avatar generation, and Unreal Engine-based visualization – which can introduce technical bottlenecks. To ensure stable real-time performance, several targeted optimization strategies were applied as follows.
Minimizing real-time data latency and errors
Due to the inherent nature of public APIs, response delays occasionally caused temporary data unavailability. To address this, the server was configured to query APIs at 5-minute intervals, storing the latest results in the database so they could be instantly returned to clients on demand. For weather data specifically, a time-to-live (TTL) policy was implemented: if updates were unavailable for over an hour, the system retrieved forecast values stored in the WeatherForecast table. If even forecast data was depleted, an error message was returned to prevent outdated information from being served.
Because population data does not provide predictions, it was configured to return an error if not updated within 30 minutes to ensure reliability. Additionally, unnecessary fields were removed from the JSON payload to minimize network load, and asynchronous requests were adopted on the client side to prevent blocking the rendering thread. These measures ensured delivery of the freshest available data during network delays or API outages, while also returning controlled errors during extended failures to preserve user experience continuity.
Optimizing 3D rendering performance
The simultaneous rendering of weather elements (volumetric clouds, exponential height fog, Niagara particle systems) and avatars in Unreal Engine significantly increased CPU and GPU load. Instead of simply reducing cloud coverage or particle counts – which would degrade visual fidelity – the focus was on maintaining data-driven weather visualization while enhancing efficiency.
Volumetric clouds retained their full coverage but applied resolution scaling and temporal upsampling to reduce computation. Precipitation particles used GPU-based simulations combined with distant impostor rendering to preserve the impression of rainfall or snowfall while lowering processing costs. The WeatherController updated weather parameters at fixed intervals rather than every frame, interpolating values between updates to preserve visual continuity.
Additionally, post process volume effects were applied conditionally: contrast and color corrections were emphasized only near the camera and central view while being reduced in distant regions, lowering unnecessary post-processing load without sacrificing perceived quality. These strategies maintained realistic, data-driven weather visuals while achieving real-time rendering performance.
Improving AI model inference time
Stable Diffusion and DECA are large-scale models with millions of parameters, requiring substantial computation during inference. To accelerate processing, CUDA-based GPU acceleration, FP16 mixed-precision computation, and xFormers memory-efficient attention were applied, improving both speed and memory utilization. The DreamBooth training pipeline was also optimized by organizing data into condition-specific class/instance structures, minimizing redundant training.
Additionally, structural pruning was applied to the U-Net layers of Stable Diffusion, globally removing 10–15% of low-importance channels while excluding shallow upsampling blocks and I/O boundary layers to preserve facial detail. After pruning, fine-tuning with a learning rate of 1e-6 over 2000 steps re-aligned the model’s parameter distribution. At inference, INT8 static quantization was applied to the U-Net while retaining FP16 precision for the VAE and text encoder to maintain image quality. Calibration used diverse front-facing facial samples with age and gender labels to align model behavior with real-world distributions.
This combined pruning–quantization approach reduced the model size by approximately 40% and improved average inference speed by about 50%, while limiting quality degradation to within 1–2% based on ArcFace and CLIPScore metrics. Furthermore, all input images were standardized to 512 512 resolution to control computational cost, and sampling step counts were optimized using efficient samplers (DDIM, latent cache model) to accelerate image generation. DECA was enhanced with batch processing, enabling simultaneous 3D reconstruction of multiple faces.
These techniques collectively mitigated data latency, GPU load, and AI computation delays, ensuring the system could maintain real-time interactivity while delivering a stable and immersive user experience.
Performance evaluation
These results confirm that the system maintains near real-time performance (60 FPS) and stable memory usage even under concurrent user loads, supporting its scalability and responsiveness (Tables 4 and 5).
Table 4 Average processing latency
| Stage | Average Latency (ms) | Std. Dev. |
| API request server preprocessing | 280 | 35 |
| S3 upload URL transmission | 190 | 20 |
| Client download | 220 | 40 |
| Unreal engine parsing and rendering | 310 | 50 |
| Total | 1000 |
Table 5 Real-time rendering performance
| Concurrent Users | Average FPS | Memory Usage (MB) |
| 1 user | 58 | 2310 |
| 5 users | 54 | 2450 |
| 10 users | 49 | 2710 |
5 Results and Discussion
5.1 Implementation Results
In this study, real-time environmental elements that vary according to location and time were rendered in Unreal Engine based on weather data collected from the Seoul Metropolitan Government’s public APIs. The weather data were directly mapped to visual parameters such as sky color, cloud density, and background imagery, enabling users to visually experience conditions resembling those of actual urban environments. Figure 5 illustrates representative visualizations produced using data from three distinct settings: Hongdae at 06:00, Gangnam at 12:00, and Jongno at 18:00.
For instance, the Hongdae data at 06:00 indicated a temperature of 20.6C, humidity of 92%, a sky condition code of 3 (partly cloudy), and no precipitation. The wind was blowing from the northeast at approximately 1 m/s. The most notable feature in this case was the high humidity (92%), which increased the FogDensity and FogHeightFalloff parameters of the ExponentialHeightFog actor in Unreal Engine, thereby intensifying the fog effect. Simultaneously, the CloudDensity parameter in the CloudMaterial applied to VolumetricCloud was elevated, causing cloud boundaries to appear indistinct. The DirectionalLight was adjusted to match the early morning sun angle, while the light color temperature was shifted to a cooler tone suitable for 20.6C, and the light intensity was lowered to 9.0 lux, thereby reproducing the damp and misty atmosphere characteristic of a humid dawn.
In contrast, the Jongno data at 18:00 showed a temperature of 25.9C, humidity of 66%, a sky condition code of 4 (overcast), and no precipitation, with westerly winds at 2 m/s. This represented relatively warm conditions for evening hours, combined with overcast skies that could slow the cooling process. To reflect the sunset ambiance, the DirectionalLight angle was adjusted to produce a low solar elevation, and the light color temperature was shifted toward warmer tones. The light intensity was reduced to 8.0 lux to match the dimness of overcast conditions. Additionally, the AdditiveMaskContribution and CloudCoverage parameters in VolumetricCloud were modified to increase cloud density, while ExponentialHeightFog and the CloudDensity parameter in CloudMaterial were tuned to soften cloud edges and emphasize the slightly elevated humidity. These adjustments collectively created an atmospheric scene resembling an actual sunset while conveying the heavy, subdued mood of an overcast evening.

Figure 5 Visualization of real-time data integration.
Based on real-time population data collected from the Seoul Metropolitan Government’s public APIs, avatars were generated to represent the demographic characteristics of individuals present at each location. These avatars visually embody the age and gender distributions of people in the selected area, transforming abstract numerical data into tangible social representations. Figure 6 illustrates an avatar generated from the population data of the Jongno district at 11:00 a.m. The demographic data for this time and location indicated that 47.1% of the population were male and 52.9% were female, with the following age group distribution: 0% under 10 years, 0.9% in their teens, 16.3% in their twenties, 18.7% in their thirties, 20.9% in their forties, 22.1% in their fifties, 12.8% in their sixties, and 8.2% aged 70 or older. As the largest demographic group was females in their fifties, the system selected a model pre-trained for that condition to generate a corresponding facial image. The generated image was processed with DECA (Detailed Expression Capture and Animation) to produce a 3D mesh and texture, which were then uploaded to Amazon S3 and applied within Unreal Engine.
This approach demonstrates that environments generated from specific temporal and meteorological datasets do more than simply present numerical values; they provide users with an immersive experience that conveys the ambience and weather of real locations. The application of actual data highlights distinctive regional differences and temporal transitions. By continuously collecting real-time weather data and reflecting it within the virtual environment, the system enables users to intuitively experience environmental conditions as if they were physically present. Furthermore, avatars generated from population data visually embody the presence of people who constitute the space, transforming abstract demographic statistics into perceivable social entities. This allows users to feel a stronger sense of connection between themselves and the represented space, fostering an extended and immersive experience.
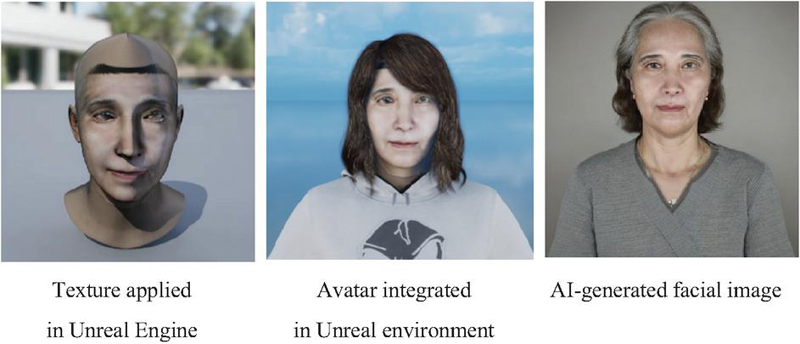
Figure 6 Avatar generation based on real-time data.
5.2 Contributions of this Study
This research introduces an interactive multimedia platform that combines real-time environmental and demographic data visualization with AI-driven facial transformation, aiming to deliver personalized and engaging user experiences. Public APIs from Seoul are used to collect live weather, traffic, and demographic data, which are then dynamically mapped to visual components such as sky color, cloud density, and background scenery. Personalized facial outputs are produced through a Stable Diffusion model fine-tuned on age- and gender-labeled Korean face datasets. The resulting facial meshes are refined via Detailed Expression Capture and Animation (DECA) and implemented as MetaHuman characters within Unreal Engine for expressive, real-time rendering.
To achieve real-time responsiveness, the system employs CUDA-based GPU acceleration, FP16 mixed-precision operations, and xFormers-based memory optimization. In addition, structural pruning of the U-Net backbone and INT8 static quantization reduced the model size by about 40% and accelerated inference by roughly 50%, while keeping visual quality loss within 1–2%. These results represent a notable technical step forward in adapting large-scale AI models to real-time interactive environments.
Beyond the technical architecture, the platform is designed to provide an immersive, user-focused experience rather than static data visualization. A map-based interface, intuitive UI/UX layout, and region-aware background transitions encourage users to actively explore and interact with the system. The combination of real-time avatar generation and dynamic environmental responses embodies user-centered design principles and enhances the sense of presence and engagement.
In summary, this study demonstrates a novel integration of real-time public data visualization and AI-based facial transformation in a single platform. By addressing current challenges related to model efficiency, user-centered interaction design, and data scalability, this framework contributes to advancing interdisciplinary research across HCI, generative media art, and urban data science. Furthermore, it lays a foundation for future technological paradigms such as smart cities, digital humans, and immersive media environments.
5.3 Limitations
This study proposed a personalized interactive multimedia platform that integrates real-time public data with AI-based facial transformation techniques. Despite its contributions, several limitations remain.
First, the data used in this study were limited to public datasets from Seoul, including weather, traffic, and demographic information, which restricts the generalizability of the findings to other regions or countries. In addition, the facial transformation model was trained exclusively on a dataset of Korean faces, and its applicability to users from other ethnic and cultural backgrounds has not yet been thoroughly verified.
Second, the Stable Diffusion and DECA-based facial transformation pipeline requires high-performance GPUs and substantial memory resources, which poses challenges for achieving real-time responsiveness. In particular, the client–server architecture may experience latency due to the transmission and rendering of large-scale 3D assets.
Finally, this study did not provide an in-depth discussion of ethical considerations such as personal data protection, potential algorithmic bias, and issues related to the responsible use of demographic and facial data.
5.4 Future Research Directions
Based on the findings of this study, future work can be pursued in the following two main directions.
First, expanding the diversity and scalability of both datasets and models is essential. Future work could incorporate a wider range of real-time public datasets from various regions and countries – such as weather, traffic, demographic, and cultural data – to enhance the platform’s generalizability. Including multiethnic and multicultural facial datasets will also help build a more inclusive facial transformation model that is applicable to a global user base. Furthermore, optimizing and lightweighting the current Stable Diffusion and DECA-based pipeline through techniques such as model quantization, pruning, and memory optimization will be crucial for achieving real-time performance on low-resource devices, while streaming and caching mechanisms could reduce latency during 3D asset delivery.
Second, further efforts are needed to strengthen user experience validation and ethical considerations. Large-scale, long-term user studies should be conducted to evaluate usability, immersion, and user acceptance more comprehensively. In parallel, future research should address ethical challenges related to personal data protection, algorithmic fairness, and transparency in the use of demographic and facial data. Developing an ethical framework that includes explicit user consent procedures, data anonymization, and mechanisms that give users control over their data will be an important step toward ensuring responsible and trustworthy deployment of the platform.
Acknowledgment
This research was financially supported by Duksung Women’s University in 2025 and the authors sincerely appreciate their support.
References
[1] K. Iranshahi, J. Brun, and T. Arnold, “Digital twins: Recent advances and future directions in engineering fields,” Intelligent Systems with Applications, vol. 26, 200516, 2025.
[2] B. Rajasekaran, T. Brahmani, and C. Reshma, “Spatial personality for human space interaction,” in Beyond Codes and Pixels: Proceedings of the 17th International Conference on Computer-Aided Architectural Design Research in Asia, T. Fischer et al. (Eds.), pp. 69–78, Hong Kong: Association for Computer-Aided Architectural Design Research in Asia, 2012.
[3] H. Xu, A. Berres, S. Yoginath, H. Sorensen, P. Nugent, J. Severino, S. Tennille, A. Moore, W. Jones, and J. Sanyal, “Smart mobility in the cloud: Enabling real-time situational awareness and cyber-physical control through a digital twin for traffic,” IEEE Transactions on Intelligent Transportation Systems, vol. 24, pp. 3145–3156, 2023.
[4] B. Ansari, “Enhancing the usability and usefulness of open government data: A comprehensive review of the state of open government data visualization research,” Government Information Quarterly, vol. 39, 101664, 2022.
[5] K. N. Mahajan and L. A. Gokhale, “Comparative study of static and interactive visualization approaches,” International Journal of Computer Science and Engineering (IJCSE), vol. 10, no. 3, pp. 85–91, 2018.
[6] T. Karras, S. Laine, and T. Aila, “Analyzing and improving the image quality of StyleGAN,” in Proceedings of the IEEE/CVF Conference on Computer Vision and Pattern Recognition (CVPR), 2020, pp. 8107–8116.
[7] X. Li, X. Hou, and C. C. Loy, “When StyleGAN Meets Stable Diffusion: a Adapter for Personalized Image Generation,” arXiv preprint, 2023.
[8] Y. Feng, V. Choutas, M. J. Black, and T. Bolkart, “DECA: Detailed Expression Capture and Animation from a Single Image,” in Proceedings of the IEEE/CVF Conference on Computer Vision and Pattern Recognition (CVPR), Nashville, TN, USA, 19–25 June 2021, pp. 20311–20320.
[9] Seoul Metropolitan Government, “Seoul Open Data Plaza,” Available online: https://data.seoul.go.kr/ (accessed on 1 September 2025).
[10] KT Corporation, “KT Public Data API Portal,” Available online: https://apilink.kt.co.kr/ (accessed on 1 September 2025).
[11] SK Telecom, “SK Open API Portal,” Available online: https://openapi.sk.com/ (accessed on 1 September 2025).
[12] Data Labs Agency, “Hydro Tasmania Energy Portal Case Study,” Available online: https://www.datalabsagency.com/case-studies/ (accessed on 15 August 2025).
[13] Data Labs Agency, “Monash Health Interactive Timeline Tool,” Available online: https://www.datalabsagency.com/case-studies/ (accessed on 15 August 2025).
[14] Vev Design, “The Pudding: Wine Data Modeling,” Available online: https://www.vev.design/blog/interactive-data-visualization-examples/ (accessed on 15 August 2025).
[15] Y. Choi, “SVAD: From single image to 3D avatar via synthetic data generation with video diffusion and data augmentation,” arXiv, 2025. https://arxiv.org/abs/2505.05475.
[16] Pegasus Project, “Personalized generative 3D avatars with composable attributes,” in Proceedings of the IEEE/CVF Conference on Computer Vision and Pattern Recognition (CVPR), 2024.
[17] Vocal Media, “How face changing tech is shaping creativity in visual arts,” Available online: https://vocal.media/art/how-face-changing-tech-is-shaping-creativity-in-visual-arts (accessed on 10 August 2025).
[18] Times of India, “Pimpri Chinchwad Municipal Corporation takes the tech route to propel civic solutions,” Available online: https://timesofindia.indiatimes.com/city/pune/pimpri-chinchwad-municipal-corporation-takes-the-tech-route-to-propel-civic-solutions/articleshow/123265739.cms (accessed on 12 August 2025).
[19] IoT Network Certified, “Peachtree Corners Smart City Deployment,” Available online: https://iotnetworkcertified.com/case-study-smart-cities/ (accessed on 15 August 2025).
[20] NTT Data, “City of Las Vegas Smart Solutions,” Available online: https://us.nttdata.com/en/case-studies/city-of-las-vegas-client-story (accessed on 15 August 2025).
Biographies

Jungjo Na is a professor in the Department of Virtual Reality Convergence at Duksung Women’s University. She received her Ph.D. in Media Studies from Soongsil University. Her research focuses on the development of AI-based VR and XR content, with a particular interest in creating convergent media experiences. Her work aims to implement art therapy for users through immersive and interdisciplinary content.
Miso Kim is currently a master’s student in ICT Convergence Engineering (Media Convergence Major) at Duksung Women’s University. She graduated with a bachelor’s degree in IT Media Engineering from Duksung Women’s University.

Hyeon Gyu Kim received his B.Sc. and M.Sc. degrees in computer science from University of Ulsan in 2000, and his Ph.D. degree in computer science from Korea Advanced Institute of Science and Technology, Daejeon, South Korea, in 2010. From 2001 to 2011, he was a Chief Research Engineer with LG Electronics. From 2012, he was an Associate Professor with the Division of Computer Science and Engineering at Sahmyook University, Seoul, South Korea. Since 2025, he has been an Associate Professor with the Department of VR Convergence Engineering at Duksung Women’s University, Seoul, South Korea. His research interests include artificial intelligence, machine learning, and big data processing.
Journal of Mobile Multimedia, Vol. 21_6, 1135–1166.
doi: 10.13052/jmm1550-4646.2166
© 2025 River Publishers