Tutorial on UAVs: A Blue Sky View on Wireless Communication
Evgenii Vinogradov*, Hazem Sallouha, Sibren De Bast, Mohammad Mahdi Azari and Sofie Pollin
KU Leuven, Department of Electrical Engineering – ESAT, Leuven, Belgium
E-mail: evgenii.vinogradov@kuleuven.be
∗Corresponding Author
Received 03 November 2018; Accepted 27 November 2018;
Publication 24 December 2018
Abstract
The growing use of Unmanned Aerial Vehicles (UAVs) for various applications requires ubiquitous and reliable connectivity for safe control and data exchange between these devices and ground terminals. Depending on the application, UAV-mounted wireless equipment can either be an aerial user equipment (AUE) that co-exists with the terrestrial users, or it can be a part of wireless infrastructure providing a range of services to the ground users. For instance, AUE can be used for real-time search and rescue and/or video streaming (surveillance, broadcasting) and Aerial Base Station (ABS) can enhance coverage, capacity and energy efficiency of wireless networks. In both cases, UAV-based solutions are scalable, mobile, easy and fast to deploy. However, several technical challenges have to be addressed before such solutions will become widely used. In this work, we present a tutorial on wireless communication with UAVs, taking into account a wide range of potential applications. The main goal of this work is to provide a complete overview of the main scenarios (AUE and ABS), channel and performance models, compare them, and discuss open research points. This work is intended to serve as a tutorial for wireless communication with UAVs, which gives a comprehensive overview of the research done until now and depicts a comprehensive picture to foster new ideas and solutions while avoiding duplication of past work. We start by discussing the open challenges of wireless communication with UAVs. To give answers to the posed questions, we focus on the UAV communication basics, mainly providing the necessary channel modeling background and giving guidelines on how various channel models should be used. Next, theoretical, simulation- and measurement-based approaches, to address the key challenges for AUE usage, are presented. Moreover, in this work, we aim to provide a comprehensive overview on how UAV-mounted equipment can be used as a part of a communication network. Based on the theoretical analysis, we show how various network parameters (for example coverage area, power efficiency, or user localization error of ABSs) can be optimized.
Keywords
- UAV
- drone
- A2G
- ABS
- AUE
- aerial
- channel modeling
- shadowing
1 Introduction
Unmanned Aerial Vehicle (UAV)-enabled solutions, systems, and networks are considered for various applications ranging from military and security operations to entertainment and telecommunications [11,24,41,43,54,71,72, 74, 105, 109, 120]. UAVs (or drones) are becoming more and more popular owing to their flexibility and potential cost efficiency in comparison with conventional aircrafts. Business Insider Intelligence (UK) published results of their market research (
The global UAV (including military drones) payload market value is expected to reach $3 billion by 2027 (the payload consists of all equipment carried by UAVs such as cameras, sensors, radars, communications equipment, and others). Radar and communication equipment dominate the global UAV payload market with a market share of close to 80%, followed by cameras and sensors segment with around 11% share (
Since drones become more functional, reliable, and affordable, UAV-based solutions for new markets start being competitive. In (
The market size and dynamics resulted in a significant interest from the academia and industry in UAV-based solutions. In this work, we give a comprehensive overview of the progress and challenges that drone-enabled wireless communications face nowadays.
1.1 Aerial Wireless Communication
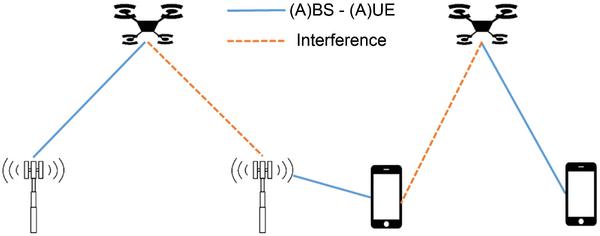
Figure 1 Aerial User Equipment and Aerial Base Station scenarios.
Drones can act as flying User Equipment (UE) (see Figure 1, left side). For instance, a UAV equipped with a camera (and other necessary sensors) can provide a cost efficient solution for surveillance, inspection, and delivery. In this case, so-called Aerial User Equipment (AUE) has to co-exist with ground users and exploit existing infrastructure (such as cellular networks) to transfer collected information to the operator on the ground with certain reliability, throughput, and delay, depending on the application requirements.
On the other hand, the use of a UAV-mounted Base Station (BS) is an alternative future technology that can provide power-efficient wireless connectivity for ground users (see Figure 1, right side). Due to its mobility and flexibility, an Aerial Base Station (ABS) can dynamically provide additional capacity on-demand. This solution can be used by service providers both for dynamic network densification, fast network deployment in an emergency situation, or temporary coverage of an area. Moreover, due to the favorable propagation conditions the localization service precision can be significantly improved. Note that the interference to the ground infrastructure also has to be taken into account.
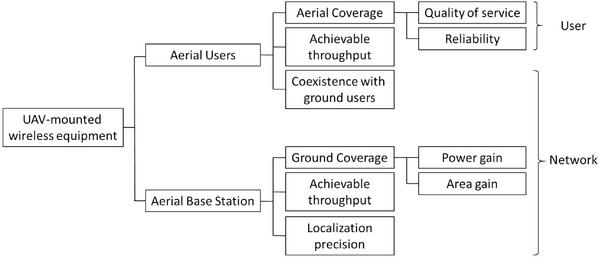
Figure 2 Important performance metrics for different UAV-enabled wireless communication systems.
UAV-enabled wireless communication networks have to be studied taking into account appropriate channel models1, antenna configurations, (A)UE and (A)BS densities, and other network parameters. A coverage and reliability analysis is very different in both scenarios (see Figure 2).
The first scenario requires a good link from the AUE to at least one of the BSs deployed, typically at the rooftop level. At the same time, the other BSs become interferers and cause a performance drop. In this scenario, the main focus is at the AUE performance, however, its coexistence with the terrestrial UEs and the network infrastructure has to be studied.
The second scenario requires a good link between all of the ground UEs to one of the multiple ABSs. The radio wave propagation conditions are completely different for aerial channels when compared with the terrestrial channels. Moreover, due to the aforementioned difference in the ground nodes (BS and UE) height for the AUE and ABS scenarios, the propagation conditions significantly change. Another important issue is that the aggregate interference to and from the air is different. Consequently, the techniques and services designed for classical wireless networks (e.g. localization) have to be adapted to the new 3D paradigm. It is obvious that completely different approaches are necessary for AUE and ABS performance analysis.
Table 1 UAV-related works
| PL: With LOS/NLOS Separation | PL: Without LOS/NLOS Separation Fixed PLE |
||||
| Fixed PLE | 3D Variant PLE | SS-Fading | Measurement-Based | ||
| Channel modeling | [114, 115] | [3, 7] [8, 56] [73, 104] |
[61-64] [97, 98] |
[3, 56] [61-64] [73, 94] [97, 98] [104, 118] |
[3, 56] [61-64] [73, 94] [97, 98] [104, 118] |
| AUE | [16] | [21, 22] [58] |
[59, 76] | [16, 21] [22, 58] |
[11, 12] [35, 36] [76, 83] |
| ABS | [15, 18] [19, 44] [69, 70] [72] |
[14, 28] [35, 111] [119, 121] |
[14, 15] [18, 19] [35, 44] |
[28] | |
1.2 Literature Review and Important Research Questions
UAV communication performance analysis has attracted a large body of research so far. Papers focus on the channel modeling only, or on system performance evaluation both for AUEs or ABSs. A detailed overview of the published research is given in Table 1. We can broadly classify the approaches: the theoretical analysis (e.g. using the published channel models as a tool for AUE or ABS performance estimation) versus measurement based research.
The channel model should accurately reflect the environment seen by the wireless link to ensure a correct and accurate performance analysis of the AUE and ABS communication. As it can be seen, the main trend is to develop and use channel models differentiating two kinds of propagation: Line-of-Sight (LOS) LOS and Non-Line-of-Sight (NLOS). Moreover, the most elaborated of these models use an altitude-dependent Path Loss Exponent (PLE). Several AUE and ABS performance analysis papers consider SS-fading, which indeed makes those works more complete and realistic. Here we highlight main research challenges, summarize the previously published literature, and discuss its limitations.
1.2.1 Channel modeling
Channel modeling is one of the fundamental issues for designing any wireless technology. Ground-to-ground networks are understood and modeled very well. In contrast, aerial communication channels have been investigated much less. The main challenge in Air-to-ground (A2G) channel modeling is the complexity of 3D environments and a large set of parameters that must be considered: PL, LS-fading, and SS-fading behavior depends on the environment type (urban, rural, etc.), transmitter (Tx) and receiver (Rx) heights, incident and/or elevation angles, the carrier frequency, LOS probability, etc. Future techniques like millimeter wave (mmWave) and Massive-Multiple-In-Multiple-Out (MaMIMO) still need to be studied in depth to improve their channel models in the aerial context.
The aeronautical channel models survey in (
Several models of an aerial channel for lower heights have been proposed in literature (see Table 1). Well-known log-distance and two-ray PL models were parameterized via measurement campaigns. Some works (e.g. in (
In this tutorial, we provide a comprehensive overview of existing channel models that can be directly used for practical UAV applications as well as for research. We draw an explicit separation between different propagation slices (or echelons): the ground level (below 10 m and 22.5 m for suburban and urban environments, respectively), obstructed A2G channel (10–40 m and 22.5–100 m), and high-altitude A2G channel (40–300 m and 100–300 m). Then we provide the model parameters for each slice. Moreover, we show examples of the practical implementation of these models for simulation based performance estimation of several drone-enabled scenarios.
1.2.2 Aerial user equipment
AUE performance investigation is needed since the majority of wireless technologies are not designed to operate in A2G links. Therefore, the performance is unpredictable in such peculiar environments. Recent reports have concluded that interference is the main source of AUE performance degradation Consequently, the main challenge is to estimate the performance taking into account a complex propagation channel (see above) and the terrestrial network topology (BS density and location, Tx power, 3D antenna patterns). Furthermore, coexistence of AUE with ground UE must be investigated.
Numerous research activities in this topic are well summarized in the surveys [35, 41, 46, 54, 57, 58] where the requirements for quality-of-service, data, connectivity, adaptability, security etc. were quantified. In (
While existing literature considers many important issues, it has some limitations. The surveys are limited to isolated UAV application use-cases, so that the information is fragmented. A work that considers all possible aspects and approaches to the AUE wireless communication performance estimation (from theoretical analysis to experimental results) is missing, to the best of our knowledge. This knowledge is the key to optimize future cellular networks while considering aerial usersnodes.
In this tutorial we give an overview of the theoretical state-of-the-art. We proceed with the simulation based performance estimation of a cellular network serving an AUE. Next, we complete the study by giving an overview of relevant measurement campaigns detailing the currently achieved UAV communication for existing communication technologies such as LTE and Wi-Fi. We show that by considering the impacts of the altitude, environments, antenna configuration, and network density, the UAV position potentially can be optimized in order to achieve the highest coverage possibility.
1.3 Aerial Communication Infrastructure
ABSs, aerial relays on ad hoc networks, and are a promising addition to the conventional wireless networks. It is vital to understand whether the use of ABSs is beneficial. Consequently, the main challenge is to propose guidelines for the optimal 3D positioning, ABS deployment density, and path-planning (when the UAV carrying the communication equipment is mobile) maximizing the advantages of ABS over the conventional terrestrial BSs. The complete analysis should take into account the complex propagation channel, antenna patterns, practical limitations (e.g. power consumption, weight or maximum flight altitude) or required network performance metrics.
Multiple papers listed in Table 1 consider mostly specific use cases and/or communication aspects without providing a theoretical framework that could be used for a complete analysis of an aerial communication network. Survey (
In this work, we aim to provide a comprehensive overview on how UAV-mounted user equipment can be used as a part of the communication network. Based on the theoretical analysis, we show how one can optimize the coverage area of ABSs. The size of this area is a function of several parameters, e.g. UAV height, transmit power and antenna tilt. The presented framework allows estimating the effect of these parameters on the ABS system and optimal deployment configuration. Moreover, the influence of multiple ABSs can be investigated. Similar to terrestrial BSs, multiple ABSs interfere with each other. Therefore, the density of these ABSs must be studied to maximize the coverage of the network, while minimizing the interference.
Additionally, the parameters important for ABS’s deployment is studied to optimize the localization service they will provide. For example, we analyze how the height of the UAV influences the positioning error of the localization system.
1.4 Tutorial Organization
Summarizing, the main contributions of this article is the overview and tutorial on the wireless communications for UAV. Our purpose is to provide an introduction of the UAV wireless communications to the reader not working in this topic but interested in getting a general introduction to the subject. This tutorial also targets researchers wishing to get a comprehensive background before working on the subject. The main goal is to gather and systematize the vast, but fragmented state-of-the-art research contributions regarding most important aspects of UAV-enabled wireless communications networks.
The tutorial is structured as follows:
- Section 2 provides an overview of the motivating UAV applications for both scenarios: UAV as the UE or UAV as integral part of the communication system.
- Section 3 is focused on the UAV communication basics, mainly giving an overview of the main Air-to-air (A2A) and A2G channel models taking into account PL, LS-fading, and SS-fading. These models consider the 3D location of both terminals, environment, frequency, and other important physical link parameters. The guidelines on how the models can be applied are given.
- Section 4 discusses the communication performance for UAVs as an AUE scenarios, focusing on analytical, simulation, and measurement results.
- Section 5 discusses two promising UAV applications when they are a part of the network infrastructure. First, we present an analytical communication performance estimation for ABSs followed by performance simulations. Next, we discuss the localization performance, for scenarios where the UAV is a part of a localization system.
- Section 6 provides an overview of the future research directions and challenges.
- Section 7 concludes the paper.
2 Wireless Communication for UAVs: Use Cases
A wide range of use cases can be imagined for UAVs.
When analyzing the performance of UAV communication, it is important to divide the use cases in two classes of scenarios, one where the UAV is used as a mobile terminal and the second one where the UAV is a part of the wireless communication infrastructure. In the first case, the UAV is considered as an AUE, where the data generated by the payload of the UAV needs to be transmitted to serve an application. In the second case, the UAV is exploited as a part of the communication system, for example, as a mobile base station or anchor for localization of Internet of Things (IoT) devices. Below, we first describe some scenarios where the UAV is a mobile wireless terminal, and then we focus on scenarios where the UAV is part of the infrastructure.
2.1 Unmanned Aerial Vehicles as User Equipment
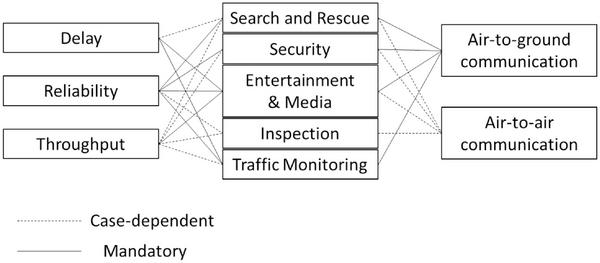
Figure 3 Qualitative requirements for various use-cases when UAV acts as an UE.
Naturally, drones can act as users of the wireless infrastructure. To properly use drones as AUE, the requirements for the communication between drones and ground infrastructure should be adapted to the considered application (see Figure 3). For instance, it is obvious that for search and rescue, the reliability is vital. In the case when the UAV-mounted camera is used to help a ground-based operational center, the delay and throughput requirements are high. However, due to the possibility of augmenting the UAV with autonomous on-board functionality such as positioning and person detection, the drone can also only transmit the coordinates of the person.
Many studies are dedicated to the feasibility of AUE usage in existing cellular networks (see Table 1). It turns out that the interference becomes the main limiting factor for the wide deployment of the cellular-connected drones due to the fact that current cellular networks were designed for ground users whose operations, mobility, and traffic characteristics are substantially different from the AUE.
There are key differences between drone-mounted and ground UEs. The propagation conditions for A2G and terrestrial channels are completely different due to nearly LOS communications between ground BSs and AUEs. On one hand, it improves the received signal level, but in return the interference from the other BSs also grows. Moreover, the ground users are in general less dynamic than UAVs, therefore, the techniques used currently in the cellular networks might require significant modification to enable the highly mobile users.
In the case of an AUE, it may need to transfer the information about to the security operation center. This information might vary from telemetry-like signals to a more demanding video stream. Let us describe the most promising AUE applications.
2.1.1 Search and rescue
Drones have been used for searching victims (
2.1.2 Security
UAVs are able to optimize their path quickly and complete complex missions due to their high mobility, which makes them attractive for various security and safety-related applications. Equipped with the right sensors and actuators, UAVs can monitor an area for illegal activities via video surveillance. For surveillance purposes, (
2.1.3 Entertainment and media
The entertainment business was one of the first businesses to widely use drones for the production of TV shows and movies. But for these applications, the video is stored on board on the UAV. In the future, there are plans to use drones for live broadcasting and AR/VR applications (
Another option is to use drones as broadcasting relays. For big sports events, like bikes races, motorcycles are used to film the athletes. The stream gets relayed via a helicopter to the control station of the TV station. Operating this helicopter is not cost efficient, therefore an UAV could be equipped with relaying infrastructure (
Another example of an entertainment application for drones comes from Intel, which uses drones to make animated light shows (
The next application for entertainment purposes came from Dolce & Gabbana. During their Winter 2018 showcase in Milan, they demonstrated their handbags and purses by flying them down the catwalk using drones (
2.1.4 Inspection
Autonomous UAV can easily take over when highly repetitive flights (such as a periodic industrial infrastructure inspection) have to be performed. An example is the inspection of wind turbine blades for damage and wear. When checking the blades of an entire wind turbine park, the pilot can loose the concentration. This leads to dangerous situations where the pilot could crash or miss a damaged spot on the turbines blades. Autonomous drones rely on cameras and software to do these routine inspections and do not have the problem of fatigue, therefore the inspections will become more secure and effective. The same procedure can also be applied on other big industrial installations e.g. petrochemical plants and cooling towers (
2.1.5 Traffic monitoring
Owing to their dynamic and multidisciplinary characteristics, drones have become increasingly popular for traffic monitoring. This interest resulted in several research activities. One of the first related surveys (
The main functions that an aerial-based traffic monitoring system should have are i) object (pedestrian, car etc.) detection [10,29], ii) tracking (
2.2 Unmanned Aerial Infrastructure

Figure 4 Aerial Base Station use cases. Top: Future communication networks; Bottom, Left: Localization service; Bottom, Right: disaster scenario.
2.2.1 Aerial base stations: Future telecommunication networks
The demand for high-speed wireless access has been incessantly growing last years. Smart-phone traffic will exceed PC traffic by 2021: traffic from wireless and mobile devices will account for more than 63 percent of total IP traffic by 2021 (
We believe that UAV-mounted base stations will become an important component of the 5G environment due to the ability of providing on-demand connectivity to the users at little additional cost (
2.2.2 Aerial base stations: Public safety during natural disasters
Natural disasters such as earthquakes, fires, and floods often yield to severe damage or complete destruction of the existing terrestrial communication networks. In particular, cellular base stations and ground communication infrastructure is often damaged and overloaded during natural disasters (see Figure 4, bottom right). It is obvious that there is a need for public safety communication solutions for search and rescue operations. The potential broadband wireless technologies for public safety scenarios include 4G Long Term Evolution (LTE), Wi-Fi, satellite communications and dedicated public safety systems (
An ABS can be seen as a part of a robust, fast, and capable emergency communication system enabling effective communications during public safety operations(
2.2.3 Aerial anchors: Positioning for ground users
Another advantage of using drones as part of the wireless infrastructure, is that they can be used for localization of terrestrial nodes (see Figure 4, bottom left). Aerial positioning systems have the advantage of having a higher LOS-probability than a terrestrial BS, which increases the possible positioning-accuracy. (
3 Fundamentals of UAV Communication
In wireless communication networks, the propagation channel is the medium between the transmitter and the receiver. It is obvious that its properties influence the performance of wireless networks. Next generation UAV-enabled networks design (i.e., algorithms development) is impossible without the knowledge of the wireless channel. Consequently, radio channel characterization and modeling in such innovative architectures becomes crucial to evaluate the achievable network performance.
The vast majority of the channel modeling efforts is dedicated to terrestrial radio channels. Unfortunately, wireless communication with UAVs cannot rely on these models. The nature of A2G channels implies a higher probability of LOS propagation. This results in a higher link reliability and lower transmission power. Even for NLOS links, power variations are less severe than in the terrestrial communication networks due to the fact that only the ground-based side of the link is surrounded by the objects that affect the propagation. Figure 5 illustrates A2G propagation channel and introduces the main geometrical parameters as well as drawing the important distinction between LOS and NLOS channels2. On the other hand, the UAV mobility causes high rates of change. Modeling of these changes is challenging due to arbitrary mobility patterns and complex operational environment. Doppler shift caused by the UAV motions has to be taken into account as well.
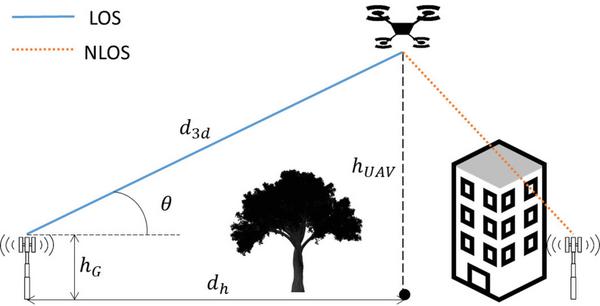
Figure 5 Air-to-Ground propagation.
Apart from the channel itself, there are other factors that influence the received power strength such as: airframe shadowing, self-interference from the on-board devices and antenna characteristics.
An accurate channel model of A2G channels is vital for design and optimal deployment of the communication networks including UAVs as its nodes. In this section we will discuss a number of research questions and recent efforts dedicated to this important issue.
3.1 Background
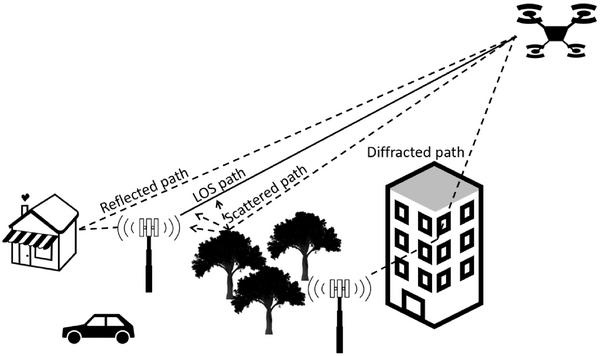
Figure 6 Air-to-ground propagation.
The transmitter radiates electromagnetic waves in several directions. Waves interact with the surrounding environment through various propagation phenomena before they reach the receiver. As illustrated in Figure 6, different phenomena such as specular reflections, diffraction, scattering, penetration or any combination of these can be involved in propagation (
Typically, radio channels can be represented as a superposition of several separate fading mechanisms:
where, Λ is the distance dependent PL, XLS is the LS-fading (also known as shadowing) consisting of large scale power variations caused by the environment, and XSS is the SS-fading (see Figure 7).
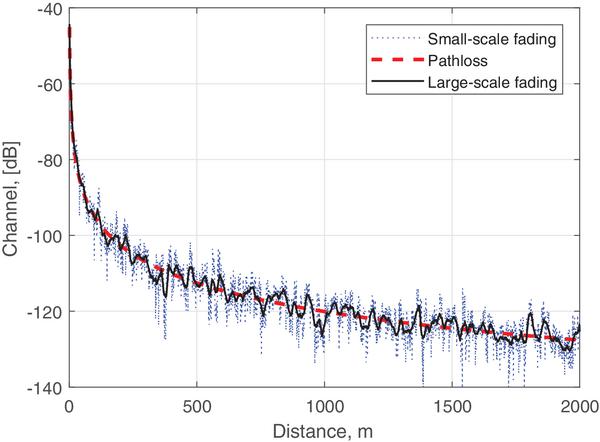
Figure 7 Channel components.
Depending on the altitude, different channel models (or their parameters such as PLE or LOS probability) must be used due to the obvious difference in experienced propagation conditions. The airspace is often separated into three propagation slices (or echelons):
- Ground level: below 10 m or 22.5 m for suburban and urban environments, respectively (
3 ). These channels can be modeled by using terrestrial channel models since the aerial node altitude is below the rooftop level. Mostly the NLOS propagation is expected. - Obstructed A2G channel: 10–40 m and 22.5–100 m for suburban and urban environments, respectively. These channels experience a higher LOS probability than the ground channels, however, it is not 100%. Consequently, a large variation of the received power around the mean Signal-to-Noise-Ratio (SNR) levels is observed.
- High-altitude A2G channel: 40–300 m and 100–300 m. Above certain altitude (depending on the environment), all channels are in LOS, so the propagation is close to the free-space case. Consequently, only LOS channel model can be used. Moreover, no LS-fading is expected.
Additionally, A2A channels are mostly experiencing LOS propagation and similar to the high-altitude A2G channels. Note that in this case, the UAVs mobility can be significantly higher which causes larger Doppler shifts.
Next, let us describe models of the components presented in (1) separately.
3.1.1 Path loss and Large-scale fading
3.1.1.1 Air-to-Air channels
The simplest path-loss model assumes a LOS link between the Tx and Rx and propagation in free space. This assumption represents well the situation when two UAVs communicating with each other (so-called A2A channels) at a relatively high altitude (above the rooftop level). In this case, the received signal power is given as (
where PT is the transmitted power, GT and GR are the transmit and receive antenna gains, respectively, λ is the carrier wavelength, and d is the distance between the Tx and Rx3. Note that the PLE η (the power of the distance dependence) in this equation is 2 for free-space propagation. So that the path loss can be expressed for a generalized case as
3.1.1.2 Air-to-Ground channels
Unfortunately, the signals in real-life A2G wireless communications do not experience free space propagation. In the majority of literature, the well-known log-distance PL model with free-space propagation reference is used for PL (in dB) modeling:
where Λ0 is the PL at reference distance d0 (Λ0 can be specified or calculated as free space PL ).
When the deterministic path-loss is removed, mean power, averaged over about 10–40 wavelengths, itself shows fluctuations over time. These random variations of locally averaged received power over large distances, typically on the order of a few tens or hundreds wavelengths, are known as LS-fading, due to large obstacles such as buildings, vegetation, vehicles, the UAV’s airframe etc. The obstacles affecting the propagation of radio signal can be very different from each other, resulting in large-scale variations at different locations, while having approximately the same Tx-Rx distance. At any distance d, LS fading XLS measured in dB is usually modeled as a normal random variable with a variance σ, which takes into account random variations of the received power around the path loss curve. This model is attractive since it is widely used (with different parameters) for modeling of classical terrestrial channels.
Another common PL model used in the literature [3, 8, 15, 19, 71, 72], separates the path loss into two components namely LOS and NLOS:
where ΛLOS,NLOS are the path loss for the LOS and NLOS cases, respectively, PLOS denotes the probability of having a LOS link between the UAV and the ground node. An advantage of this model is that PLOS calculation can be adapted to different heights of the communicating terminals so that we can take into account the difference between the scenarios when the aerial node communicates with a node located at low altitudes (≤ 2 m) or with a BS, which typically are deployed higher.
3.1.2 Small-scale fading
Small-scale fading describes the random fluctuations of the received power over short distances, typically a few wavelengths, due to constructive or destructive interference of MPCs impinging at the receiver. Different distributions are proposed to characterize the random fading behavior of the signal envelope, suitable for different wireless systems and propagation environments. The Rayleigh and Rice distributions, both based on a complex Gaussian distribution, are the most commonly used models. Considering a large number of MPCs with amplitudes and random phases, the signal envelope of small-scale fading thus follows a Rayleigh distribution (
Small-scale fading models apply to narrow-band channels or taps in tapped delay line wideband models. Due to the stochastic nature of these signal variations, fading is usually modeled using statistical approaches and its models are obtained through measurements or through geometric analysis and simulations. The most popular type of small-scale models is Geometry-Based Stochastic Channel Models (GBSCM) (
3.2 Important Results
Now, let us present the parameters of the most popular models so that one can choose the appropriate modeling approach.
3.2.1 Path Loss and Large-Scale Fading Modeling
3.2.1.1 Log-distance models
In Table 2, the parameters of the PL log-distance model presented in (4) as well as the standard deviation for the Normal distribution 𝒩(0,σ2) describing LS-fading can be found. Note that these results are valid for the frequency ranges and environments considered for the measurement campaigns used to parameterize the model. For mmWave, atmospheric absorption and rain attenuation can also lead to a significant power loss. For example, at 28 GHz, the attenuations caused by atmospheric absorption and heavy rain over a distance of 200 m are about 0.012 dB and 1.4 dB as reported in (
In the case when the distinction between LOS and NLOS situations is made (i.e. when (5) is used), the critical point is the LOS probability PLOS modeling. In (
where we have
is the horizontal distance between the UAV and the ground node, hUAV and hG are the terminal heights, ς is the ratio of land area covered by buildings compared to the total land area, ξ is the mean number of buildings per km2, and Ω is the scale parameter of building heights distribution (assumed to follow Rayleigh distribution (
Table 2 Parameters of Pathloss and Large-scale fading models
| Scenario | Frequency, GHz | η | Λ0, dB | σ, dB | Reference |
| Suburban, Urban, Open field | 2.54-3.037 | 21.9-34.9 | 2.79-5.3 | [56] | |
| 2.2-2.6 | [114] | ||||
| 2.01 | [115] | ||||
| 4.1 | 5.24 | [75] | |||
| 2-2.25 | [104] | ||||
| 0.968 | 1.6 | 102.3 | [62] | ||
| 5.06 | 1.9 | 113.9 | [62] | ||
| 0.968 | 1.7 | 98.2-99.4 | 2.6-3.1 | [63] | |
| 5.06 | 1.5-2 | 110.4-116.7 | 2.9-3.2 | [63] | |
| Over sea | 1.4-2.46 | 19-129 | [65] | ||
| Mountains | 1-1.8 | 96.1-123.9 | 2.2-3.9 | [97] | |
| Urban (LOS) | 28 | 2.1 | 3.6 | ||
| Urban (NLOS) | 28 | 3.4 | 9.7 | ||
| Urban (LOS) | 38 | 1.9-2 | 1.8-4.4 | ||
| Urban (NLOS) | 38 | 2.2-2.8 | 4.1-10.8 | [60] | |
| Urban (LOS) | 73 | 2 | 4.2-5.2 | ||
| Urban (NLOS) | 73 | 3.3-3.5 | 7.6-7.9 |
3.2.1.2 Ground level channel models
When the airspace is divided into slices, the channel is modeled in different ways depending on the UAV altitude. The ground level (1.5 m < hUAV ≤ 10) is the one providing the richest choice of possible channel models since the well-known models designed for conventional cellular networks can be used. In this tutorial, let us describe just one of the options provided by 3rd Generation Partnership Project (3GPP) for macro-cell networks deployed in rural environments4 in [3, 6].
Again, since the LOS and NLOS cases are treated separately, the LOS probability has to be calculated. It is expressed as
As soon as the LOS probability is known, the PL and LS-fading can be calculated. The altitude dependent LS-fading can be modeled as 𝒩(0,σ2) with the parameters listed in Table 3.
Table 3 Large-scale fading model parameters
| σ, dB | Applicability |
| 4 | LOS, Ground level, 10m ≤ dh ≤ d2 |
| 6 | LOS, Ground level, d2m ≤ dh ≤ 10km |
| 8 | NLOS, Ground level |
| 4.2exp(-0.00046hUAV) | LOS, Obstructed LOS and High-altitude A2G |
| 6 | NLOS, Obstructed LOS A2G |
It has been pointed out that the PL changes with the position of the communication nodes and can be calculated as:
where
In the expressions above fc, hB, W, c are the carrier frequency, average building height, the average street width, and the speed of light, respectively.
3.2.1.3 Obstructed air-to-ground channel models
The next air-space slice considers the UAV altitudes 10 m < hUAV ≤ 40 m, where the LOS probability in macro-cell networks in rural environments is calculated as in (
where
Next, the PL for LOS and NLOS cases can be calculated as
3.2.1.4 High-altitude air-to-ground channel models
For the 40 m < hUAV ≤ 300 m, the LOS probability equals 1 and PL can be calculated as in (11).
3.2.2 Small-Scale Fading Modeling
As previously noted, the most common small scale fading distribution for A2G propagation is the Ricean (
In (
Note that the PL, LS-fading and SS-fading models and their parameters for urban and micro-cell scenarios can be found in [3, 6].
3.2.3 Conclusions
The choice of an adequate channel model depends on the targeted result. When an approximate result is needed for a large set of areas, it is practical to apply a simple channel model that will reproduce the general propagation trends. For instance, the log-distance model with a fixed PLE is an appropriate choice. However, in the case when a more specific environment is to be investigated, a more complex channel model might be necessary. The most complete air-to-ground channel models consider:
- Path loss, large- and small-scale fading mechanisms,
- Propagation slice (ground, obstructed A2G, high-altitude A2G),
- Different environment types (urban, suburban, rural, open),
- Separate parameterization of LOS and NLOS models.
In this section we presented the whole spectrum of statistical channel models that can be applied depending on the final goal.
4 Aerial User Equipment Communication Performance
In this Section, we detail the state-of-the-art results in the communication performance analysis for UAV networks, in scenarios where the UAV is considered to be a UE or mobile terminal. We start with an overview of the theoretical state-of-the-art, mainly concentrating on the the analytical works using the channel models described in Section 2, or more precisely we develop our performance analysis framework based on the channel model separating LOS and NLOS propagation cases. Next, we present the performance estimation of an LTE cellular network serving an UAV based on a simulator consisting of a realistic 3-dimensional urban environment combined with semi-deterministic channel models. We proceed by giving an overview of all relevant measurement campaigns detailing the currently achieved UAV communication for existing communication technologies such as LTE and Wi-Fi.
4.1 Theoretical Performance Analysis
The feasibility of LTE-based UAV communication is often examined via field trials and simulations. Such a focus on the experimental studies results in a highly fragmented picture of the issues related to the cellular-based communication with drones. Surprisingly, the analytical investigation of AUE scenarios is not widely studied in literature. We believe that the theoretical frameworks to analyze the coexistence of the aerial and ground users (
Here we aim to address theoretically the following important questions:
- are the current and future cellular networks capable of providing adequate quality of service for AUEs?
- what are the major factors that may limit the network performance for AUEs?
- how does the flexibility of UAV design help to achieve better performance?
4.1.1 Network Architecture

Figure 8 Network geometry.
4.1.1.1 System architecture
We consider a cellular network consisted of ground BSs, UE, and AUE. A homogeneous Poisson point process (HPPP) Φ with density λ BSs/Km2 was used to model to BSs locations. The BSs’ heights are denoted as hG as in (6).
Users are assumed to be located hUAV meters above the ground (note that for ground users h =1.5 m). The horizontal distance dh separates a BS and a specific UE’s projection on the ground 0 (see Figure 8). The BS antenna radiation pattern is imitating a realistic deployment (the antennas are vertically directional and horizontally omnidirectional). The network is assumed to be optimized for the terrestrial users so that the antennas are tilted down (
We consider that AUE is able to control the antenna tilt (mechanically or electrically). The AUE antenna is characterized by its opening angle ϕB and tilt angle ϕt, as illustrated in Figure 8. We assume that the UAV antenna gain is GUE = 29000/ϕB2 within the main lobe and zero outside of the main lobe (
4.1.1.2 Channel model
The approach presented in Section 2, Equation (5) is used so that the LOS and NLOS components are treated separately with the probability of LOS modeled as in (6). Note that the LOS probability of different communication links are assumed to be independent. When the LOS probability is known, path loss is calculated as in (4) with the reference loss ΛL,N and PLE ηL,N for LOS and NLOS links, respectively.
For modeling of the small-scale fading XSS, ( is chosen depending if the link is LOS or NLOS) we use the Nakagami-m distribution, which contains a wide range of fading types as specific cases (
where mυ is the fading parameter assumed to be a positive integer for the sake of analytical tractability. Note that the larger mυ corresponds to lighter fading.
If a BS transmits with a power level PTx, the corresponding received power is given by
where G = GBS GUE represents the cumulative effect of transmitter and receiver antenna gains.
4.1.1.3 Performance metrics
The system performance is estimated using three metrics derived from Signal-to-Interference-and-Noise-Ratio (SINR) expressed as
The performance is affected by many system parameters including the AUE altitude, hUAV. Therefore, all the metrics are dependent on these parameters, even if it is not expressed explicitly.
Coverage Probability denoted by Pcov reflects the reliability of the link between a UE and its associated BS in satisfying the target requirement and it is defined as
which can be written as Pcov = Pcov (hUAV, T) as SINR depends on hUAV. The target value T is determined based on the user requirement and is related to the target rate RTx by T = 2RTx/BW - 1, where BW is the bandwidth allocated to each user. Additionally, this metric is useful to evaluate the reliability of a command and control link.
Channel Capacity denoted by ℛ is the highest bit rate achievable by a UE in the network. This metric can be calculated as
which is the user altitude hUAV and the BS density λ dependent, and hence can be written as ℛ = ℛ(hUAV,λ). While the coverage is useful to characterize the quality of service and reliability, the throughput ℛ quantifies performance in terms of average raw throughput. In other words, ℛ and Pcov are complementary for the BS to UE link quality estimation.
Area Spectral Efficiency (ASE) denoted by 𝒜, is a network-level performance metric that reflects the achievable data-rate per square meter. Let us denote the ratio of UE to AUE numbers as ρ. In a given area, the densities of BSs serving AUEs and ground users are λρ and λ(1 -ρ), respectively. Therefore, the average throughput per square meter can be calculated as
where ℛ(1.5,λ) and ℛ(hUAV,λ) corresponds to ground users at altitude of 1.5 m and aerial users at altitude of hUAV, respectively. This metric provides an insight into the overall effect of adding aerial users in the network and how the overall spectrum efficiency changes when network resources are shared between ground and aerial users.
4.1.2 Important Results
4.1.2.1 Performance analysis
Below, we present several results for the performance metrics described above. Note that this tutorial contains only the expressions for the most popular practical cases (i.e. omnidirectional AUE antenna is considered), for more generalized results refer to (
Coverage Probability – First, we present the expression for the downlink coverage probability of a cellular-connected UAV equipped with an omnidirectional antenna in the case when the AUE is flying higher than the serving BS. Given the system model and performance metrics defined earlier, it is obtained as
where f(d′) ≈ λP(d′) ⋅ e-2λℐ1LL is the probability density function (PDF) of the serving BS′s distance dh at an arbitrary angular coordinate within C,
Channel capacity and ASE – The achievable throughput of a typical UE can be obtained as
where the last equation is an approximation to facilitate numerical calculations. Note that parameter K has to be chosen large enough for a high accuracy of the approximation (
Finally, ASE is obtained by a direct substitution of ℛ(hUAV,λ) from (21) into (18).
4.1.2.2 Representative case-studies
Considering a typical UAV served by the ground cellular network in downlink, the following results can be observed:
Altitude Impact – Figure 9 shows that for the scenario when an omnidirectional antenna is used at the AUE, the performance of the network at relatively high altitude is very low. This is due to the growing number of BSs in LOS seen by the UAV when increasing its altitude (
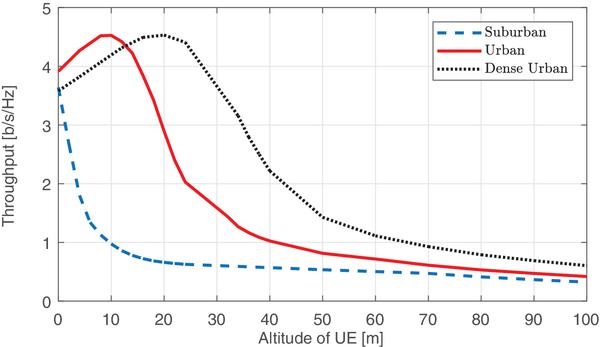
Figure 9 The impact of UAV altitude and environment on the performance of network.
Environment Impact – Figure 9 illustrates the effect of different type of urban areas. When the area is more dense, the AUE at relatively high altitudes benefit from more interference blocking and hence its performance is higher. As can be seen, the optimum altitude is also higher for more obstructed areas. For a suburban area, the UAV should fly as low as possible for better performance.
UAV Antenna Configuration – As it was mentioned above, the low performance of the network for aerial UEs can be compensated by using a tilted directional antenna on the UAV. In this manner, the UAV can attenuate the signals coming from the interfering BSs and hence boost the SINR levels. Figures 10 and 11 demonstrate the potential benefits of the optimum antenna configuration in terms of beamwidth and tilt angle. Interestingly, the performance of the AUE at the optimum point is even higher than a ground UE. The optimum angle depends on the altitude of flying UAV and density of the network. As can be seen, tilting the UAV antenna is not beneficial for very dense networks since the number of the interferers is too high.
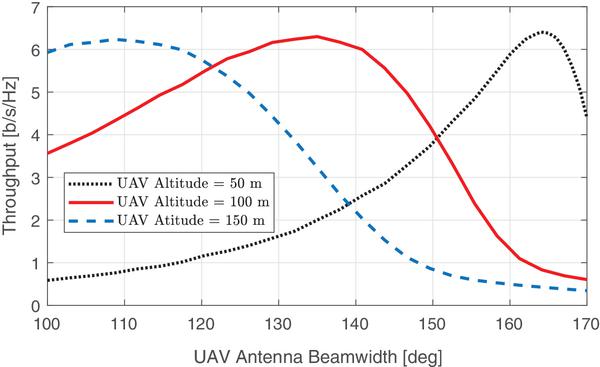
Figure 10 The impact of UAV antenna beamwidth on the performance of network.
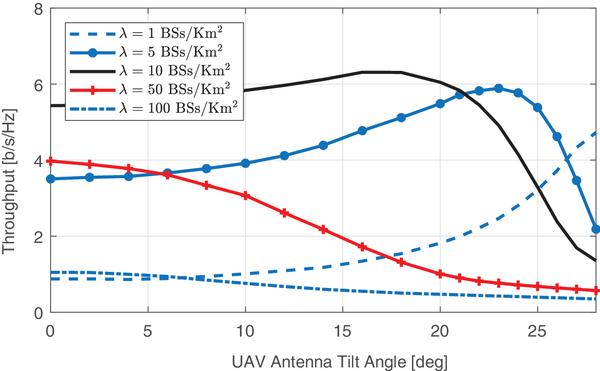
Figure 11 The impact of UAV antenna tilt angle on the performance of network.
Network Densification – As the network becomes more dense, the performance of UEs first increases due to higher probability of LOS with the serving BS. However, further densification causes the performance degradation due to a higher number of interfering BSs. As can be seen, an AUE is capable of achieving higher performance when its antenna is configured optimally. In any case, for ultra dense networks the performance converges to zero. Finally, from Figure 12 we note that, in order to mitigate the interference effect and increase the performance, a UAV flying altitude should be lower when the network density increases.
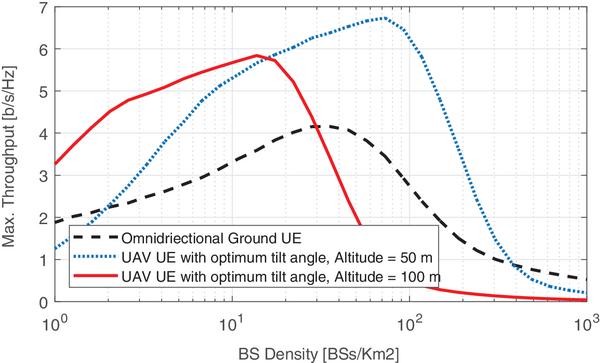
Figure 12 The impact of network density on the UEs performance.
A more detailed discussion on this topic can be found in [16, 21, 22].
4.2 Simulation of LTE Networks Performance
In order to study the interference influence on the network performance, we designed a semi-deterministic downlink simulator combining multi-band channel models with a 3D map of a real Belgian city. Table 4 contains the main simulation parameters.
Table 4 Simulation parameters
| Parameters | Values |
| Carrier frequencies | 1.8 GHz |
| Signal bandwidth, B | 20 MHz |
| White noise power density, No [5] | -174 dBm/Hz |
| UE noise figure, F [5] | 9dB |
| Noise power, N | -122 dB |
| Active user density, ρ | 20 users/km2 |
| # iterations | 100 |
4.2.1 Simulator
4.2.1.1 Environment
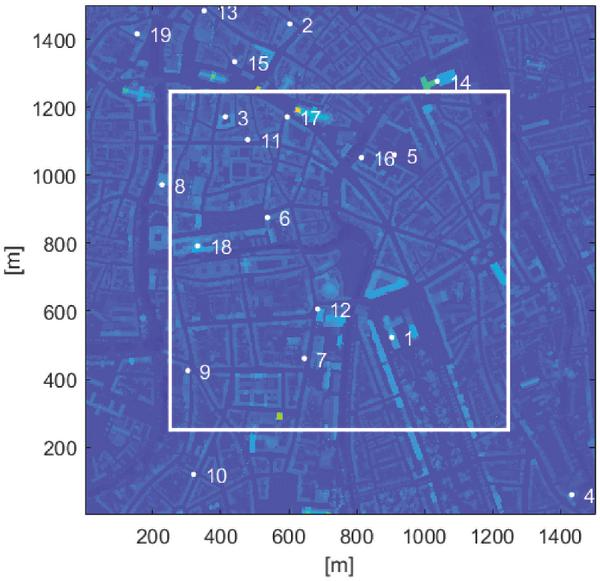
Figure 13 Surface map of Ghent city considered for the simulations.
For all simulations, a measured urban 3D environment was used. The 3D surface of Flanders, Belgium (
Real locations of the macro BS of a single operator provided by (
Figure 13 shows the map with the region of interest marked by the white lines and the base station locations marked as white dots.
4.2.1.2 Channel modeling
Let us now describe all the components of the used link model.
Antenna patterns – The BS antennas are modeled following (
Line-of-sight – To check whether the (A)UE is in LOS with a BS, a line is drawn between the basestation and the user in the 3D environment. Analyzing the intersections with the 3D environment the link between user and basestation is considered LOS or NLOS.
SINR calculation – For the SINR calculations, all sectors from all BSs are assumed to be transmitting. Thus the received power from every sector is calculated as:
where Prx is the received power, Ptx is the constant transmitted power, Gtx and Grx are respectively the transmitting and receiving antenna gains in the direction of the user and Λ is the corresponding path loss for that location, with all parameters in dB.
Let A be the collection of all sectors. SINR levels are calculated for a given location as follows:
where N = N0BF (N0 is white noise density, B is signal bandwidth and F is noise figure) is the noise power (values in Table 4) and Ia is the interference power considering a is the serving sector, which is defined as follows:
The serving sector for every location is thus chosen as the one with the highest SINR value. After performing the simulations taking into account all parameters described above, a 3D sector assignment map that shows the sector assignment in a geographical area is generated. Two slices of this assignment map at different heights are shown in Figure 14.
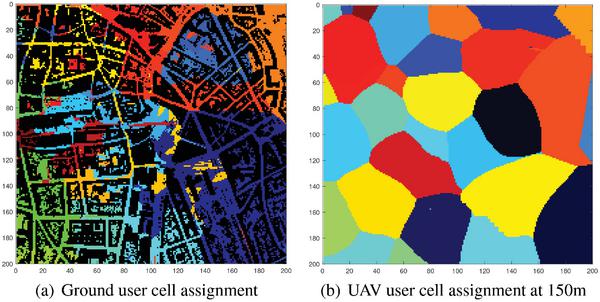
Figure 14 Cell assignment at different heights.
Coverage – The link performance is estimated using the coverage probability, which is the probability that a target SINR is achieved (as function of UAV altitude) similar to Section 4.1. As it was mentioned above, the target SINR depends on the throughput requirement. In the case of command and control downlink, this results in an estimated data rate of only 60–100 kbps for the downlink (
4.2.2 Simulation Results
4.2.2.1 Environment characterization
First of all, some characterization and analysis of the environment is done. Basic parameters such as building height and LOS probability are calculated for later use in the channel model.
A comparison between the resulting building height distribution and the Rayleigh distribution suggested in (

Figure 15 Distribution of building height in Ghent compared to a Rayleigh distribution.
The LOS probability is also calculated to characterize the environment: it is presented as a function of AUE height and indicates whether the users is in line of sight with any basestation. When determining whether a ground or aerial user is in LOS with a basestation the 3D map is used, as explained in Section 4.2.1.2. The resulting line of sight probability can be seen in Figure 16. Around a height of 30 m AGL a UAV is a 100% certain to be in LOS of at least one basestation.

Figure 16 Probability of line of sight with at least one basestation depending on height.
4.2.2.2 Performance estimation
First, let us analyze how the SINR levels change with the flight altitude. Figure 18 shows the altitude dependent behavior of the mean SINR: it is significantly lower for high UAV altitudes because of the interference. A peak is observed for the rooftop level. The mean SINR is positive for the heights lower than 40 m, however, the performance is rather defined by the SINR distributions. The cumulative distribution function (CDF) shown in Figure 17 confirms that SINR drops for high UAV altitudes, and the best performance is achieved at rooftop level. The possible explanation of this behavior is given by the fact that the probability of having a LOS connection with the serving basestation is high at the rooftop level, while all interfering eNbs, which are at a larger distance from the user, will still be in NLOS. This finding is confirming the results presented in Section 4.1.
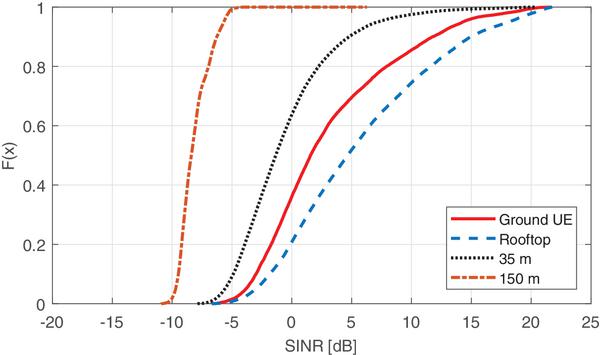
Figure 17 Cumulative Distribution Function of SINR levels for different AUE altitudes.

Figure 18 Mean SINR for different AUE altitudes.
By analyzing the SINR distribution, we defined the coverage probability as a function of the AUE altitude as presented in Figure 19. It turns out that the current network configuration allows to use LTE for the UAV command and control link only for relatively low heights (up to 30–35 m) of the flying terminal.
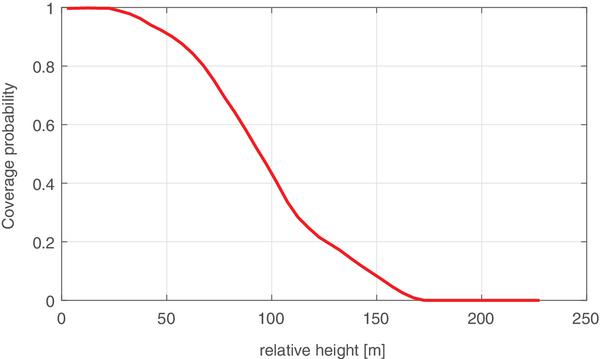
Figure 19 Coverage probability vs AUE altitudes.
4.3 Measurement Based Performance Estimation
The theoretical and simulation-based analysis given above help to investigate the potential performance achievable by cellular networks. However, it is hard to predict how the existing technologies perform in real-life network deployments due to several factors. The most important ones are: i) the difference between terrestrial and A2G channels discussed in Section 2; ii) often the real network configuration is not available. (
First of all, the understanding of the communication requirements is necessary. Next, we can decide which technology (or mix of technologies) can suit the communication requirements. Let us define these requirements. For example, for collision avoidance, it is important to have a reliable communication with a moderate amount of information to be exchanged. If the purpose of the mission is to stream high quality video (or photos) which is a very common use of UAV nowadays, then the bitrate requirements are much higher, but losing a packet here and there is not a real issue. Following requirements are found in literature:
- Command and Control: 4.8 kbaud, reliable link with delay of 50–100 ms (
90 ). - Image transfer: 1 Mbps, reliable link with delay of 50–100 ms (
53 ). - Video streaming: 2 Mbps, reliable link with delay of 50–100 ms (
37 ).
4.3.1 Wi-Fi Connected Drones
A very common technology, used especially in amateur drones, is Wi-Fi. It is very cheap to implement because a typical smartphone or laptop can be used as remote controller. Practice proves that it also works quite well in Visual Line-of-Sight (VLOS) flight at very low altitude and short distances. However, for longer distances the changing propagation conditions must be taken into account. Table 5 presents the most valuable results obtained via various measurement campaigns for UAV communication by means of Wi-Fi (as well as Zigbee, for comparison). It can be seen that potentially Wi-Fi is able to satisfy the requirements shown above for short distances.
Table 5 Comparison of wireless technologies
| Technology | Standard PHY Rate | Measured Throughput |
| Zigbee (802.15.4) | 250 kbps | up to 250 kbps (500–1500 m) ( |
| Wi-Fi (802.11a) | 54 Mbps | UDP: 14 Mbps (350 m), 29 Mbps (50 m) ( |
| TCP: 10 Mbps (500 m), 17 Mbps (100 m) ( |
||
| Wi-Fi (802.11b) | 11 Mbps | 14 Mbps (2 km)( |
| Wi-Fi (802.11n) | 600 Mbps | TCP: 10 Mbps, 100 Mbps (100 m) ( |
| Wi-Fi (802.11ac) | 6933 Mbps | TCP: 5 Mbps (300 m), 220 Mbps (50 m) ( |
4.3.1.1 Important results
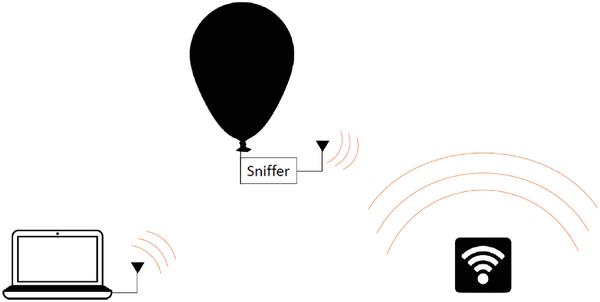
Figure 20 The wireless scanner is carried by a helium balloon.
We designed a very lightweight Wi-Fi packet sniffer that can be used on almost any UAV, including helium balloons (
To further verify this, the received signal strength of an access point is analyzed. Typically, the access point is detected when the balloon and that AP are in line-of-sight. As seen on Figure 21 (bottom) the RSSI, when detected, remains almost constant. This is another verification that LOS and NLOS cases must be treated separately as it was stated in Section 2.
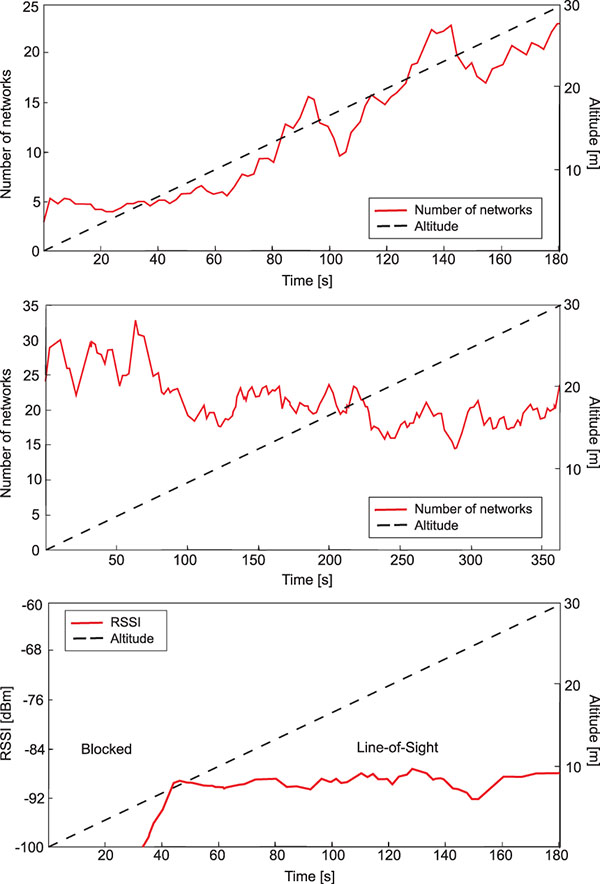
Figure 21 Altitude-dependent top: The number of detected networks for open space; middle: The number of detected networks for high buildings; bottom: Received signal strength of access point.
4.3.2 LTE Connected Drones
The viability of LTE commercial mobile networks for UAVs was supported by Qualcomm (
The measurements in [35,58,76,83] show that the interference is the main limiting factor for different environments. In (
4.3.2.1 Important results
We have performed several measurement campaigns to quantify the interference to an LTE terminal as a function of altitude (
For lower altitudes (0–120 m), a quadrotor UAV was used at KU Leuven, Belgium. Due to weight constraints, part of the UAV measurements were done using an off-the-shelf LTE-capable cell phone (OnePlus One) running an LTE cell tracking application. The used application was G-MoN for Android. Additional ground measurements (with RTL-SDR) were used as a reference.
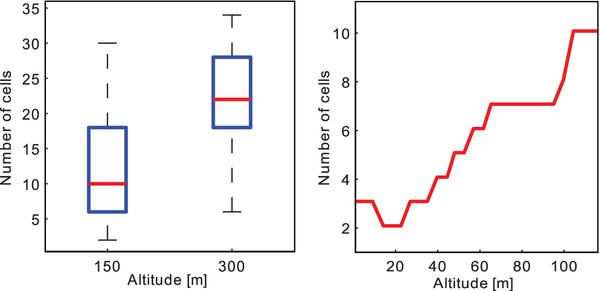
Figure 22 Number of cells seen vs. receiver altitude.
In Figure 22 one can see the number of cells that are visible to the receiver at different altitudes. The left plot shows the measurements performed by the UAV, while the right plot shows the results found along the coast using the airplane. To be able to compare inland and coastal measurements, taking into account that there are no base stations in the sea, the number of base stations seen at the coast has been multiplied by two.
The number of the identified base stations increases significantly with altitude. On one hand, the airborne receiver has a high probability of being covered by the ground network. As a result, on the other hand, inter-cell interference is significantly increasing with altitude. This leads to a decreased SINR at the airborne receiver.
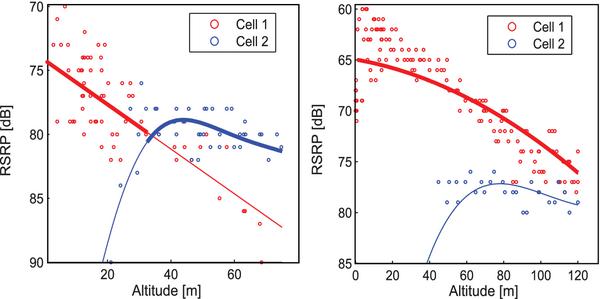
Figure 23 The signal level as a function of the receiver altitude.
Figure 23 shows the reference signal received power (RSRP) signal level of the two best cells observed from a hovering UAV as a function of the altitude. It can be seen that the signal from the best cell at ground level decreases with altitude, but signals from interfering base stations increase because of the varying propagation conditions. Due to the fact that the networks are optimized to serve terrestrial users, the signal level from the cell that was optimal at ground level decreases. As the altitude increases, the signal level from the weaker cells (cell 2) increases as well due to the elimination of obstacles between the eNodeBs and the AUE. At a certain point, the attenuation caused by the obstacles is completely overcome. This results in a flooring of the RSRP level in Figure 23.
The measurements confirm the conclusions drawn by the theory and simulations: the downlink signal level received by the UAV from ground eNodeBs is determined by LOS propagation path loss and the base station antenna gain pattern.
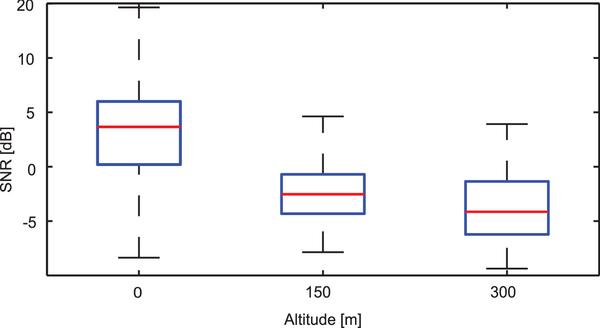
Figure 24 SINR measured on the synchronization symbols of the best cell vs. receiver altitude (816 MHz).
Next, the SINR, measured on the synchronization symbols, is compared at three different altitudes: ground, 150 m, and 300 m, as shown in Figure 24. At least 36 measurements have been taken at each altitude. It can be seen that the SINR of the best cell seen at each of those specific altitudes is much lower than the SINR witnessed at ground level. There is a further slight decrease between 150 m and 300 m. This is explained by a combination of two factors: i) increase of the distance-dependent path loss, and ii) the dramatic increase in interference levels. While the signal strength of the best cell at ground level does go down, as shown above, the received signal form other cells might become stronger than the signal from the initial cell; thus, an UAV will handover while increasing the altitude. Cumulative power received from all the additional cells visible at a high altitude results in high interference.
4.4 Conclusions
Concluding the discussion above, we underline that the analytical approach to the AUE performance estimation is very elegant and gives the valuable information for practical network deployment. However, certain real-life aspects (e.g., real BS locations and buildings surrounding the BS) cannot be considered. On the other hand, the measurement-based performance estimation by definition takes the real environment and network configuration into account, however, naturally, this approach has several practical limitations (e.g. it cannot explore dense AUE scenarios, altitude is a limitation, and you cannot fly in all environments due to the current regulation constraints). Simulation based approach is able to overcome the aforementioned limitations since realistic 3D maps (including the existing communication infrastructure and its parameters) are becoming available. The possible problem of simulations is that they rely on channel models. So that the appropriate channel modeling is extremely important for this approach.
Summarizing this section, we would like to emphasize that all analysis (analytical, simulation and measurements) confirms that UAV communication performance is limited by interference.
5 Unmanned Aerial Communication System Performance
In this Section, we detail the state-of-the-art results in the communication performance analysis for UAV communication, in scenarios where the UAV is considered to be a part of the communication network. We start with an overview of the state-of-the-art, mainly concentrating on the theoretical works on optimal ABS deployment based on using the channel models presented in Section 2. We proceed by a detailed description of UAV-enabled localization framework including both theoretical and simulation results.
5.1 Theoretical Performance Analysis
Here we aim to theoretically address the question how multiple degrees of freedom in UAVs networking (including altitude of operation, UAVs density, and their antenna configuration) impact the final performance of ABSs (coverage area, transmit power as well as the ground UE received quality of service).
5.1.1 Network Architecture
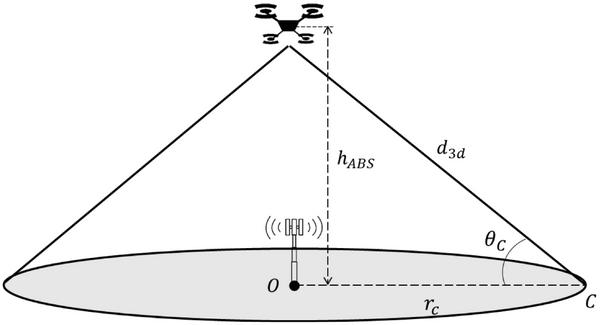
Figure 25 Network geometry.
5.1.1.1 System architecture
We consider a hybrid air-to-ground communication network with an ABS located at an altitude hABS, serving ground users within its coverage area (see Figure 25). The coverage area is a disc of radius rC centered at O, the projection of the ABS on the ground. Note that the signal arrives to ground users located at the area C with elevation angles within a range 𝜃C ≤ 𝜃 ≤ π depending on the distance r from the center of the area, where .
We aim to compare the performance of this network with the case when a conventional terrestrial BS is deployed at the disc center.
5.1.1.2 Channel model
In this section, for obtaining generalized results, let us consider the PL model presented in (3) with the PLE η that can change depending on the targeted environment and the ABS altitude. As it was mentioned in Section 2, the Rician distribution can be used to model the small-scale fading XSS between the ABS and the ground terminal. In Section 2, the K-factor is suggested to be equal to 15, however, it can be beneficial to have a theoretical framework considering more general dependencies, so K-factor is 𝜃-dependent.
5.1.1.3 Performance metrics
The communication link between the ABS and a ground terminal is defined to be in outage when the instantaneous channel SNR falls below a given threshold T
Consequently, the outage dependent on the communication parameters (locations of the nodes, transmit power) can be expressed as
where Q(⋅,⋅) is the first order Marcum Q-function. Note that K,η and G are 𝜃-dependent. Moreover, the communication distance is .
It is known that increasing the BS deployment height results in a larger coverage area, hence, an ABS can either be more power-efficient for serving a fixed area or ensure coverage over a larger area transmitting the same power. Moreover, increasing the SNR in general improves the performance of the network.
Power gain achievable by ABS in comparison with a terrestrial BS for covering the area C can be defined as
where PTx|BS and PTx|ABS are the transmit powers necessary to satisfy (26) when the area C is served by a ground and aerial BSs, respectively.
Coverage radius characterizes the dimensions of the area within which (26) is satisfied.
Sum-rate gain can be calculated when the achievable rates when terrestrial and aerial BSs are compared. The average sum-rate of an ABS with the transmit power Ptx is defined as (
where is the average number of ground nodes within C, W is the transmission bandwidth, and out(hABS,PTx) is the average outage probability Pout(rc,hABS,PTx) over the coverage region C. The average sum-rate gain 𝒢(h) provided by an ABS over a terrestrial one can be expressed as
5.1.2 Important Results
5.1.2.1 Performance analysis
The transmit power required to cover the region C when an ABS is used can be obtained as
where 𝜖 is the minimal tolerable quality of the communication link, which is usually attained at the boundary of the coverage area and Q-1(⋅,⋅) is the inverse Marcum Q-function with respect to its first argument and rc is the radius of C.
Power gain 𝒢P(h) of an ABS over a TBS can be written as
where
and a = 0 or a = 𝜃 for ground and aerial base stations, respectively.
Sum-rate gain 𝒢(h) can be calculated by replacing the transmit power from (31) into (30). For more results and metrics, please refer to [14,15,18,19].
5.1.2.2 Representative case-studies
Considering several degrees of freedom in UAVs networking which include altitude of operation, UAVs density, and their antenna configuration, we study their impacts on UAVs coverage area and transmit power as well as the ground UE received quality of service.
Fixed Coverage Region – Figure 26 shows how altitude of an ABS influences the required transmit power of UAV when the ABS aims to cover a certain given region on the ground. As can be observed, an ABS requires lower transmit power to serve a fixed area in comparison with a ground BS due to favorable LOS propagation conditions (within a certain range of altitudes). Particularly there is an optimum altitude at which a minimum necessary transmit power is obtained. This can be explained by the fact that the link is in LOS yet, at some point, the path loss becomes too high due to the increased link length. The power gain at the optimum altitude grows as the region that needs to be covered becomes larger (
Furthermore, Figure 27 illustrates that, at a certain range of altitudes, an ABS is able to provide higher rate capacity for ground users even though the UAV-mounted BS transmit power is lower (
Finally, we note that due to the absence of interference, the optimum altitudes are normally high (200–1000 m depending on the optimized parameter). However, when considering interference of neighboring ABSs, the optimum altitude might become lower (

Figure 26 Power gain of a UAV BS as compared to terrestrial BS.
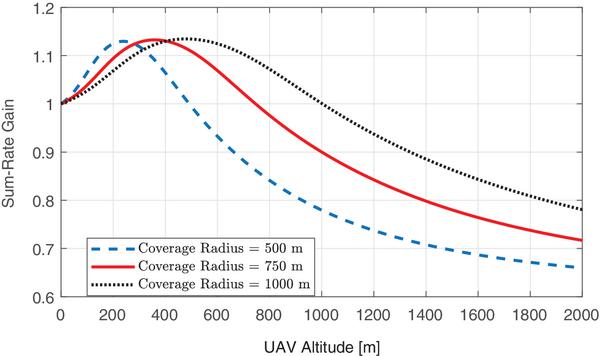
Figure 27 Sum-Rate gain of a UAV BS network as compared to terrestrial BS.
Fixed Transmit Power – When we consider a given transmit power, the overall effect of altitude on the coverage region is noticeable (
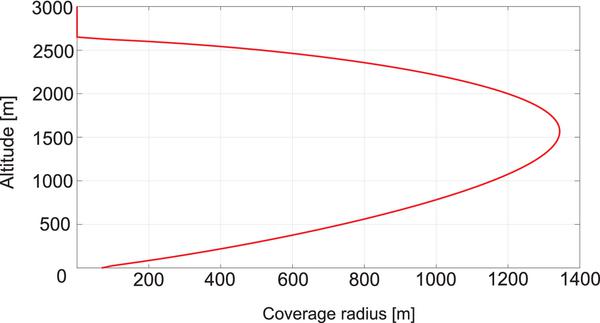
Figure 28 Coverage radius versus altitude.
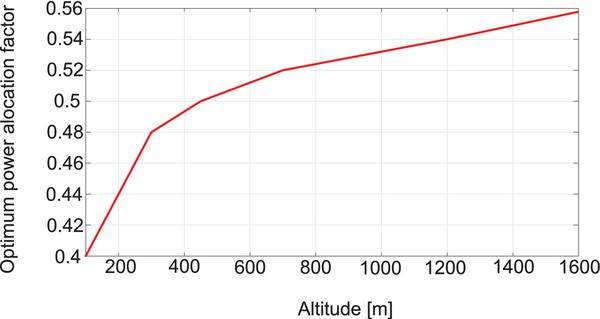
Figure 29 Power allocation ratio versus altitude.
ABS Power Control – When we consider co-channel interference caused by the neighboring BSs, the ABSs in general introduce higher interference due higher probability of having LOS communication. To reduce possible negative effects of this, we would like to lower the transmit power yet guaranteeing a minimum QoS for the ground users in the target region. As a possible solution for this issue, we suggest that cooperative communication can be employed in which a relaying ground user assists the ABS to serve another user (
Multiple ABSs – To serve a number of users distributed over a target region, multiple ABSs may be required as the coverage of a single ABS is limited. In this case, multiple design factors have to be taken into account. In a static case, in which ABSs are stationary, the inter distances of UAVs and 3D placement of them should be well defined to mitigate interference and at the same time to cover the target region (
A similar reasoning justifies the existence of optimum density of ABSs. Moreover, a more obstructed urban area benefits from blocking interfering ABSs and hence the performance is higher for larger densities of ABSs. These discussions are more detailed in [18, 20]. Additionally, specific aspects of the uplink performance analysis of ABSs (omitted in this tutorial) are reported in (
5.2 Localization Services System Requirements
A localization service is acknowledged as a fundamental functionality in modern communication systems. While it is recognized as a complementary service in ordinary scenarios, it is of critical demand in case of emergencies to locate the user and provide relief services efficiently. As all other services, localization services using ground base stations are exposed to damage caused by natural or man-made disasters. Therefore, rapid on-demand deployment of UAVs furnished with radio platforms for serving and localizing ground users has, recently, attracted considerable research focus [17, 77, 86, 87, 96]. In particular, because of the higher LOS probability at high altitudes which results in better localization accuracy compared with ground base stations [86, 87].
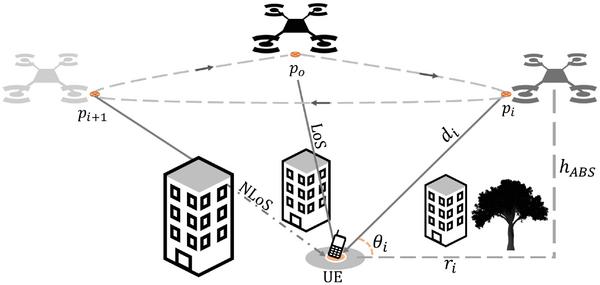
Figure 30 An illustration of UAV(s) at different anchor points to localize a UE.
The multilateration process is the most prominent method in wireless communications for accurately determining the position of the user. It substantially requires estimating the distance to the user from at least three different positions naming anchor points as shown in Figure 30. The distance estimation is typically done using time-based or RSS-based techniques [40, 88]. Time-based techniques estimate the distance by simply multiplying the estimated time of flight by the speed of light. However, defining the time of flight is the bottleneck of these techniques as a very accurate time synchronization is required between the transmitter and the receivers. RSS-based solutions, on the other hand, are known for their intrinsic simplicity and for not requiring any time synchronization. Moreover, RSS estimation functionality is readily available in all chipsets (
RSS-based localization techniques have been extensively studied in the literature for terrestrial cellular networks [33,88,117]. In general, the achieved localization accuracy is limited due to the relatively high shadowing that causes a rather high distance estimation error (
For simplicity, one can assume that the UE is in the coverage range of the UAV at i-th anchor point for all examined values of hABS. Now, following the channel model presented in Section 3.2.1 and assuming that δLOS and δNLOS respectively represent the localization errors corresponding to LOS and NLOS components, the average localization error can be written as
Without loss of generality, we assume that the UE location is (xg,yg,0) whereas the UAV position is (xa,ya,h). Consequently, given the estimated distance ri and known projection (xa(i),ya(i)) of the UAV at the ith anchor point, the position of the UE can be estimated by finding the point (x,ŷ) that satisfies
where , M is the number of anchor points and di is the estimated distance estimated based on the path loss model of LOS or NLOS link. Now, for an estimated location (x ,ŷ) of a UE, the localization error is expressed as
where r = [r1,r2,...,rM], r = [r1,r2,...,rM] and ∥.∥ represents the euclidean distance. Estimating the distance to the UE for different anchor point can be done using single mobile UAV or multi-UAVs hovering are the two possible approaches.
5.3 Simulation Setup
In order to investigate the localization accuracy when using a mobile UAV, simulations have been conducted. In our simulations, we assume 100 UE uniformly distributed in a circular area with a radius of 200 m. We consider a system communication frequency of 2 GHz. The relevant system parameters and their corresponding values are specified in details in Table 6.
Table 6 Parameters List
| Parameter | Description | Value |
| M | Number of anchor points | 3, 4 |
| N | Number of TNs | 100 |
| f | Carrier frequency [GHz] | 2 |
| A | Total area of TNs [km2] | 0.12 |
| δ | Localization error | – |
| lj | anchor points inter distance [m] | – |
| hABS | UAV’s altitude | 200 |
| th | Hovering time [s] | 5 |
| R | Trajectory radius | 120 |
| aLoS | Shadowing constant | 10 |
| bLoS | Shadowing constant | 2 |
| aNLoS | Shadowing constant | 30 |
| bNLoS | Shadowing constant | 1.7 |
| ao | PLOS constant | 47 |
| bo | PLOS constant | 20 |
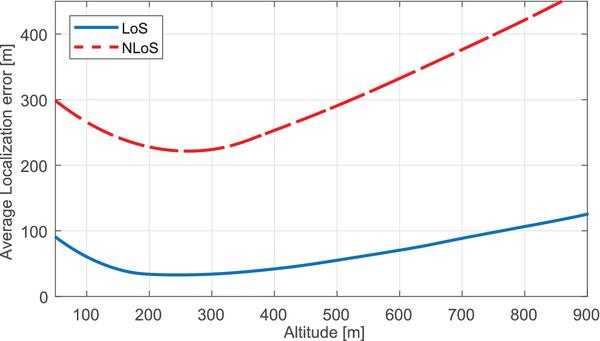
Figure 31 Localization error in case of LoS and NLoS links.
5.3.1 Mobile UAV
Using a mobile UAV for localizing ground users requires careful path planning to ensure a satisfactory localization accuracy and concurrently, maximize the number of users served. Path planning includes choosing flying altitude and the corresponding anchor points. Additionally, the anchor points inter-distance is an essential part of the UAV trajectory as they influence the flying time and hence the energy requirements.
To have a clear insight, in the following we investigate each design parameter individually using our simulations.
Trajectory altitude – Figure 31 presents the localization accuracy as a function of the UAV altitude. The figure shows that the UAV anchor outperforms the ground anchor (i.e., low altitudes) when flying at the optimal altitude. In the figure, the localization error assuming LOS and NLOS for a trajectory with M = 3 is illustrated. It is seen from the figure that, for both LOS and NLOS cases, the error is a convex function of hABS because of the exponentially decreasing variance of the ψj with hABS (
Trajectory radius (R) – In Figure 32 we present how the trajectory radius influences the localization error performance when hABS is fixed. The figure shows that high localization errors occur when R is small (i.e., R = 50). This is due to the fact that, for multilateration, at small distances between the anchor points, a small estimation error in the distance will lead to a large error in the estimated location. Hence, increasing R decreases the localization error from 150 m to 80 m in trajectory with 3 anchor points and from 95 m to 65 m in trajectory with 4 anchor points at optimal R. The cost here, however, is the higher energy required for larger R.
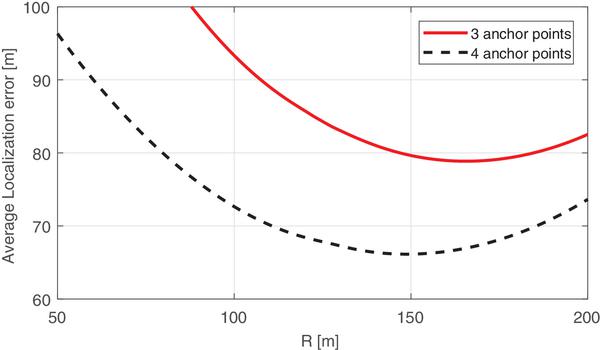
Figure 32 Localization error for 3 and 4 anchor points at different trajectory radius.
Number of anchor points (M) – The localization accuracy with 3 and 4 anchor points is presented in Figure 32. As shown in the figure, having more anchor points increases the localization accuracy. Nevertheless, injecting more anchor points in the trajectory implies a longer total hovering time and longer traveling distances for the UAV, leading to a higher energy consumption.
5.3.2 Multiple Hovering UAVs
The main disadvantage of using one mobile UAV is the delay required to reach at least 3 anchor points before estimating the position of the UE. This challenge becomes even more serious when the UE is moving. An alternate solution here is to use multiple UAVs, one at each anchor points. In this approach, at least 3 UAVs are required to cooperatively defined the location of ground users. Similar to the mobile UAV case, altitude and inter-distance of UAVs are the design parameters that control the system performance. In the case when all UAVs are flying at the same altitude, the results shown in Figure 31 will also hold for the multiple UAVs case. The trajectory radius, moreover, can be simply mapped to the UAVs inter-distance lM using
where is the angle between any two adjacent anchor points. Accordingly, there exists an optimal lM to minimize the location error with same trends presented in Figure 32.
5.4 Conclusions
Using the detailed UAV channel models, we can conclude that systems exploiting UAV for communication or localization services have shown to benefit from the high altitude of the UAV. With respect to interference, a downlink UAV channel is always benefiting compared to the ground-to-ground channel. These results however still need to be verified using realistic simulations or experiments. There is a lack of semi-deterministic (i.e. using realistic environments) simulation studies beyond the statistical ones, as real UAV BS locations are not there yet, so these cannot be simulated as we did before in Section 4.2. With respect to experiments, it is not trivial to put BS equipment on a UAV, and obtain decent experimental evaluations here.
6 Research Directions and Future Work
In this section, we identify the directions of the future research towards more reliable UAV communications. First, we evaluate the missing channel measurements in literature and why these measurements have to be performed. Secondly, we discuss the limitations of the existing channel models and the way to improve them. Next, aerial cellular handovers and their open challenges are discussed. Afterwards we evaluate the open questions for the wireless backhaul for aerial BSs. To end, the challenges related to finite amount of energy stored on the drone are discussed, mainly, path planning in relation to the wireless connectivity and wireless power transfer.
6.1 Channel Measurements
In the future, UAVs will be deployed in a large variety of the environments: not only a typical urban, rural and sub-urban, but also in industrial settings (e.g. for the infrastructure inspection), over water, high-ways, stadiums and similar large public areas etc. Moreover, indoor channel models may be needed for some specific use-cases (
For the potential measurement campaigns, we believe that the listed environments must be considered. To start, future measurement campaigns should take into account various city layouts and building dimensions such as the Manhattan grid or the more irregular layout of European cities. As a result, parametric models can be developed, using these models and the parameters of a specific city we can better model the aerial channel characteristics of that city.
Secondly, there is no channel model for very crucial flight maneuvers such as take-off and landing. Depending on the environment, the UAV can experience severe LS-fading and rich multi-path propagation conditions while executing these important tasks. Measurements during these maneuvers will give us a better understanding about the challenges these maneuvers face, when the UAV transitions between different types of channels, imposes on these systems.
Another set of measurements that can be of great interest is the measurements of A2G for both moving and static aerial nodes. In addition, mobile air-to-air channels measurements can be performed. This will shine a light on how mobility affect UAV communications.
Airframe shadowing and interference from on-board equipment received limited attention from the research community [36, 39]. Indeed, they have to be characterized. Typically, the emitted power is low, but it can have a large impact on the final performance due to the short distance between the interferer and the receiver.
The majority of the published works considers only the first-order statistics of the small-scale fading. Even though in [94,118] the second order statistics of envelope level crossing rate and average fade duration are discussed, unfortunately, the number of works analyzing this vital issue is restricted. Another important issue that has to be investigated via measurements is the stationarity distance and its altitude dependent behavior.
5G-oriented measurements such as mmWave and MaMIMO are of interest as well, since it was pointed out that interference is the main issue for aerial communication using cellular networks. Both of these technologies, mmWave and MaMIMO, are key to lower the amount of interference in the aerial context. MaMIMO is able to relief the interference constraints by using dozens of antennas. These antennas make the technology capable of beam-forming the signals to specific users. On the other hand, mmWave will be able to lower the amount of interference due to its big available bandwidth that can be shared with more users. However, the behavior of these channels may be quite peculiar since even for classical Multiple-In-Multiple-Out (MIMO) the fading is more severe as it was shown in (
6.2 Channel Models
The availability of high-resolution 3D maps makes possible the use of semi-deterministic channel models where some of the models parameters are extracted directly from the map (similar to the well-known COST models for cellular networks (
Potential use-cases, where UAV are used as an assistant for the autonomous cars, can require Air-to-Vehicular (A2V) channel models. In this case, the challenging aerial channels will be paired with a high mobility, this results in a very dynamic aerial context. In order to effectively study this environment, a channel model is needed to simulate the communication between the vehicles and the UAVs.
Another possible challenge is an accurate A2A models taking into account various flight situations. These flight situations range from take-off and landing to hovering and over cruising at a stable speed to making complex movements in the air.
The published models are mostly dedicated to PL and LS-fading modeling. However, an accurate modeling of the first- and second-order statistics of the SS-fading is needed for the future wireless network design and deployment. Moreover, we believe that the most accurate channels model should take into account the non-stationary behavior of the SS-fading. To create such models, the quasi-stationarity distance must be estimated as it was done for indoor and vehicular channels in [25, 47, 50, 106, 107].
6.3 Cellular Handover for Drones
UAVs connected to ground cellular networks are normally capable of detecting several LOS BSs which are radiating their signals through their antennas main-lobe and side-lobes. Accordingly, the pattern of the cells are different in the air. This fact will result in a different handover characteristic for AUEs. Such characteristics are highly dependent on the blockage distribution, height and mobility pattern of the flying UAV. As a matter of fact, more frequent handovers can be expected where some of them might fail due to a low received signal power from side-lobes. In order to establish reliable and safe cellular-connected UAVs, a qualitative and quantitative understanding of such network behavior is of utmost importance. This is still an open problem.
6.4 Wireless Backhaul for UAV BSs
As mentioned in Section 5, using UAVs as aerial communication platforms has several benefits. However, such a platform requires a wireless backhaul link, which is very challenging in comparison with the backhaul of terrestrial infrastructure. Satellite-assisted backhaul links are an expensive solution, moreover, the latency of satellite communication impedes the working of time-constrained services as real-time control and VoIP. Therefore, alternative low-latency and high-throughput solutions are needed urgently. Existing cellular network infrastructure can be reused for this purpose, which is an ongoing active research topic.
6.5 Path Planning
Having communication services mounted on UAVs brings extra flexibility to relevant communication systems in terms of mobility and adapting the services on-demand. However, the altitude-dependent coverage and mobility of energy-constrained UAVs introduce new challenges for the design of UAV-based wireless communications. In general, there are two constraints to consider: the ground nodes distribution and the on-board energy limitations. Consequently, the communication service is optimized according to these constraints. For instance, in (
6.6 Power Allocation and Wireless Power Transfer
The main components of energy consumption of an UAV are the communication related energy and the propulsion energy, which is required for moving and hovering. In general, the communication-related energy is ignorable in comparison to the UAVs propulsion energy, i.e. a few watts versus hundreds of watts. In some specific applications, however, new energy requirements are introduced such as when a UAV is used for wireless power transfer and backscatter data collection. Given the different power requirements for different flying modes and the high power requirements for such applications, a careful allocation of the limited on-board power becomes even more crucial. In (
7 Conclusions
In this work we provided a comprehensive tutorial on the use of UAVs in wireless networks. Contributions of this tutorial:
- Classification of UAV communication research topics
- Mapping of important use cases following the UAV role in the system (aerial user equipment or aerial base station) and also according to performance requirements
- Comprehensive overview of the channel modeling efforts suitable for UAV performance analysis
- Analytical, simulation and experimental evaluation of UAV as UE scenario, highlighting the important impact of interference
- Performance analysis of UAV as BS showing the high potential for this use case and motivating here more research in terms of simulations and experiments
- Summary of the main directions to improve the channel models and performance analysis beyond the metrics already discussed in this paper.
Acknowledgements
PerceEvite This work is part of a project that has received funding from the SESAR Joint Undertaking (JU) under grant agreement No. 763702. The JU receives support from the European Unions Horizon 2020 research and innovation programme and the SESAR JU members other than the Union.
OmniDrone This research was also partly funded by the Research Foundation Flanders (FWO), project no. S003817N OmniDrone.
References
[1] Antennewebsite BIPT. http://www.bipt.be/nl/operatoren/radio/antennes-gedeeld-antennegebruik/antennewebsite-bipt. Last accessed on 2018-07-26.
[2] Standaardproducten Digitaal Hoogtemodel Vlaanderen II. https://download.agiv.be/Producten/Detail?id=966&title=Standaardproducten_Digitaal_Hoogtemodel_Vlaanderen_II, 2015. Last accessed on 2018-07-26.
[3] 3rd Generation Partnership Project (3GPP). 36.777: Study on Enhanced LTE Support for Aerial Vehicles, December 2017.
[4] 3rd Generation Partnership Project (3GPP). 36.814: Evolved Universal Terrestrial Radio Access (E-UTRA); Further advancements for E-UTRA physical layer aspects, March 2017.
[5] 3rd Generation Partnership Project (3GPP). 36.942: Radio Frequency (RF) system scenarios, July 2018.
[6] 3rd Generation Partnership Project (3GPP). 38.901: Study on channel model for frequencies from 0.5 to 100 GHz, June 2018.
[7] A. Al-Hourani, S. Kandeepan, and A. Jamalipour. Modeling air-to-ground path loss for low altitude platforms in urban environments. In 2014 IEEE Global Communications Conference, pages 2898–2904, December 2014.
[8] A. Al-Hourani, S. Kandeepan, and S. Lardner. Optimal LAP altitude for maximum coverage. IEEE Wireless Communications Letters, 3(6): 569–572, December 2014.
[9] J. Allred, A.B. Hasan, S. Panichsakul, W. Pisano, P. Gray, J. Huang, R. Han, D. Lawrence, and K. Mohseni. Sensorflock: an airborne wireless sensor network of micro-air vehicles. In Proceedings of ACM 5th International Conference on Embedded Networked Sensor Systems (SENSYS ’07), pages 117–129, 2007.
[10] N. Ammour, H. Alhichri, Y. Bazi, B. Benjdira, N. Alajlan, and M. Zuair. Deep Learning Approach for Car Detection in UAV Imagery. Remote Sensing, 9(4), 2017.
[11] M. Asadpour, B. Van den Bergh, D. Giustiniano, K. A. Hummel, S. Pollin, and B. Plattner. Micro aerial vehicle networks: an experimental analysis of challenges and opportunities. IEEE Communications Magazine, 52(7):141–149, July 2014.
[12] M. Asadpour, D. Giustiniano, K.A. Hummel, S. Heimlicher, and S. Egli. Now or later?: Delaying data transfer in time-critical aerial communication. In Proceedings of the Ninth ACM Conference on Emerging Networking Experiments and Technologies, CoNEXT ’13, pages 127–132, New York, NY, USA, 2013. ACM.
[13] AT&T. Flying COW (Cell on Wings) Connects Puerto Rico.
[14] M. M. Azari, F. Rosas, K. Chen, and S. Pollin. Optimal UAV Positioning for Terrestrial-Aerial Communication in Presence of Fading. In 2016 IEEE Global Communications Conference (GLOBECOM), pages 1–7, December 2016.
[15] M. M. Azari, F. Rosas, K. Chen, and S. Pollin. Ultra Reliable UAV Communication Using Altitude and Cooperation Diversity. IEEE Transactions on Communications, 66(1):330–344, January 2018.
[16] M. M. Azari, F. Rosas, A. Chiumento, and S. Pollin. Coexistence of terrestrial and aerial users in cellular networks. In 2017 IEEE Globecom Workshops (GC Wkshps), pages 1–6, December 2017.
[17] M. M. Azari, H. Sallouha, A. Chiumento, S. Rajendran, E. Vinogradov, and S. Pollin. Key technologies and system trade-offs for detection and localization of amateur drones. IEEE Communications Magazine, 56(1):51–57, January 2018.
[18] M.M. Azari, Y. Murillo, O. Amin, F. Rosas, M.-S. Alouini, and S. Pollin. Coverage maximization for a poisson field of drone cells. 2017 IEEE 28th Annual International Symposium on Personal, Indoor, and Mobile Radio Communications (PIMRC), pages 1–6, 2017.
[19] M.M. Azari, F. Rosas, K.-W. Chen, and S. Pollin. Joint sum-rate and power gain analysis of an aerial base station. In IEEE Globecom Workshops (GC Wkshps), pages 1–6, December 2016.
[20] M.M. Azari, F. Rosas, A. Chiumento, A. Ligata, and S. Pollin. Uplink performance analysis of a drone cell in a random field of ground interferers. In Wireless Communications and Networking Conference (WCNC), 2018 IEEE, pages 1–6. IEEE, 2018.
[21] M.M. Azari, F. Rosas, and S. Pollin. Cellular connectivity for UAVs: Network modeling, performance analysis and design guidelines. arXiv preprint arXiv:1804.08121, 2018.
[22] M.M. Azari, F. Rosas, and S. Pollin. Reshaping cellular networks for the sky: Major factors and feasibility. In 2018 IEEE International Conference on Communications (ICC), pages 1–7. IEEE, 2018.
[23] C.A. Balanis et al. Antenna theory: analysis and design. John wiley & sons, 2016.
[24] G. Baldini, S. Karanasios, D. Allen, and F. Vergari. Survey of wireless communication technologies for public safety. IEEE Communications Surveys Tutorials, 16(2):619–641, February 2014.
[25] L. Bernadó, T. Zemen, A. Paier, G. Matz, J. Karedal, N. Czink, C. Dumard, F. Tufvesson, M. Hagenauer, A F. Molisch, and C F. Mecklenbräuker. Non-WSSUS vehicular channel characterization at 5.2 GHz – Spectral divergence and time-variant coherence parameters. XXIX General Assembly of the International Union of Radio Science (URSI), August 2008.
[26] T.X. Brown, B. Argrow, C. Dixon, S. Doshi, R.-G. Thekkekunnel, and D. Henkel. Ad Hoc UAV Ground Network ( AUGNet ). 2004.
[27] UK Business Insider Intelligence. Commercial Unmanned Aerial Vehicle (UAV) Market Analysis – Industry trends, companies and what you should know. http://uk.businessinsider.com/commercial-uav-market-analysis-2017-8?r=US&IR=T, 2017.
[28] S. Chandrasekharan, K. Gomez, A. Al-Hourani, S. Kandeepan, T. Rasheed, L. Goratti, L. Reynaud, D. Grace, I. Bucaille, T. Wirth, and S. Allsopp. Designing and implementing future aerial communication networks. IEEE Communications Magazine, 54(5):26–34, May 2016.
[29] Z. Chen, C. Wang, C. Wen, X. Teng, Y. Chen, H. Guan, H. Luo, L. Cao, and J. Li. Vehicle detection in high-resolution aerial images via sparse representation and superpixels. IEEE Transactions on Geoscience and Remote Sensing, 54(1):103–116, January 2016.
[30] Cisco. Cisco visual networking index: Global mobile data traffic forecast update, 2016–2021. https://www.cisco.com/c/en/us/solutions/collateral/service-provider/visual-networking-index-vni/complete-white-paper-c11-481360.pdf.
[31] B. Clerckx and C. Oestges. MIMO Wireless Networks. 2nd ed. Elsevier Academic Press, 2013.
[32] COST Action 231. Digital mobile radio towards future generation systems.
[33] A. Dammann et al. WHERE2 location aided communications. In Wireless Conference (EW), Proceedings of the 2013 19th European, pages 1–8. VDE, 2013.
[34] E. P. de Freitas, T. Heimfarth, I. F. Netto, C. E. Lino, C. E. Pereira, A. M. Ferreira, F. R. Wagner, and T. Larsson. UAV relay network to support WSN connectivity. In International Congress on Ultra Modern Telecommunications and Control Systems, pages 309–314, October 2010.
[35] B. Van den Bergh, A. Chiumento, and S. Pollin. LTE in the sky: trading off propagation benefits with interference costs for aerial nodes. IEEE Communications Magazine, 54(5):44–50, May 2016.
[36] B. Van den Bergh, T. Vermeulen, and S. Pollin. Analysis of Harmful Interference to and from Aerial IEEE 802.11 Systems. In DroNet@MobiSys, 2015.
[37] A. Detti, P. Loreti, N. Blefari-Melazzi, and F. Fedi. Streaming H.264 scalable video over data distribution service in a wireless environment. In 2010 IEEE International Symposium on “A World of Wireless, Mobile and Multimedia Networks” (WoWMoM), pages 1–3, June 2010.
[38] DJI. Drones Rescued At Least 65 People In Previous Year. https://www.dji.com/newsroom/news/drones-rescued-at-least-65-people-in-previous-year, 2018.
[39] F. Fabra, C. T. Calafate, J. Cano, and P. Manzoni. On the impact of inter-UAV communications interference in the 2.4 GHz band. In 2017 13th International Wireless Communications and Mobile Computing Conference (IWCMC), pages 945–950, June 2017.
[40] S. Gezici, Zhi Tian, G. B. Giannakis, H. Kobayashi, A. F. Molisch, H. V. Poor, and Z. Sahinoglu. Localization via ultra-wideband radios: a look at positioning aspects for future sensor networks. IEEE Signal Processing Magazine, 22(4):70–84, July 2005.
[41] L. Gupta, R. Jain, and G. Vaszkun. Survey of important issues in UAV communication networks. IEEE Communications Surveys Tutorials, 18(2):1123–1152, 2016.
[42] M. H. C. Torres H. T. Dinh and T. Holvoet. Dancing UAVs: Using Linear Programming to Model Movement Behavior with Safety Requirements. International Conference on Unmanned Aircraft Systems (ICUAS), June 2017.
[43] M. H. C. Torres H. T. Dinh and T. Holvoet. Sound and complete reactive UAV behavior using constraint programming. ICAPS Workshop on Planning and Robotics, June 2018.
[44] A. M. Hayajneh, S. A. R. Zaidi, D. C. McLernon, and M. Ghogho. Drone empowered small cellular disaster recovery networks for resilient smart cities. In 2016 IEEE International Conference on Sensing, Communication and Networking (SECON Workshops), pages 1–6, June 2016.
[45] S. Hayat, E. Yanmaz, and C. Bettstetter. Experimental analysis of multipoint-to-point UAV communications with IEEE 802.11n and 802.11ac. In 2015 IEEE 26th Annual International Symposium on Personal, Indoor, and Mobile Radio Communications (PIMRC), pages 1991–1996, August 2015.
[46] S. Hayat, E. Yanmaz, and R. Muzaffar. Survey on unmanned aerial vehicle networks for civil applications: A communications viewpoint. IEEE Communications Surveys Tutorials, 18(4):2624–2661, 2016.
[47] M. Herdin. Non-stationary indoor MIMO channels. PhD thesis, Technischen Universität Wien, 2004.
[48] Intel. Intel drones light up the sky. https://www.intel.com/content/www/us/en/technology-innovation/aerial-technology-light-show.html, 2018.
[49] Strategic Defence Intelligence. The global UAV payload market 2017–2027. https://www.researchandmarkets.com/research/nfpsbm/the_global_uav, 2017.
[50] A. Ispas, C. Schneider, G. Ascheid, and R. Thomä. Analysis of the local quasi-stationarity of measured dual-polarized MIMO channels. IEEE Transactions on Vehicular Technology, 64(8):3481–3493, August 2015.
[51] ITU-R. Propagation data and prediction methods required for the design of terrestrial broadband radio access systems operating in a frequency range from 3 to 60 GHz, February 2012.
[52] ITU-R. F.1336: Reference radiation patterns of omnidirectional, sectoral and other antennas for the fixed and mobile service for use in sharing studies in the frequency range from 400 MHz to about 70 GHz. Recommendation F.1336, February 2014.
[53] A. Kandhalu, A. Rowe, R. Rajkumar, C. Huang, and C. Yeh. Real-Time Video Surveillance over IEEE 802.11 Mesh Networks. In 2009 15th IEEE Real-Time and Embedded Technology and Applications Symposium, pages 205–214, April 2009.
[54] K. Kanistras, G. Martins, M. J. Rutherford, and K. P. Valavanis. A survey of unmanned aerial vehicles (UAVs) for traffic monitoring. In 2013 International Conference on Unmanned Aircraft Systems (ICUAS), pages 221–234, May 2013.
[55] M.A. Khan, W. Ectors, T. Bellemans, D. Janssens, and G. Wets. Unmanned aerial vehicle-based traffic analysis: A case study for shockwave identification and flow parameters estimation at signalized intersections. Remote Sensing, 10(3), 2018.
[56] W. Khawaja, I. Guvenc, and D. Matolak. UWB Channel Sounding and Modeling for UAV Air-to-Ground Propagation Channels. In 2016 IEEE Global Communications Conference (GLOBECOM), pages 1–7, December 2016.
[57] S.J. Kim, Y. Jeong, S. Park, K. Ryu, and G. Oh. A Survey of Drone use for Entertainment and AVR (Augmented and Virtual Reality), pages 339–352. Springer International Publishing, 2018.
[58] X. Lin, V. Yajnanarayana, S. D. Muruganathan, S. Gao, H. Asplund, H. Maattanen, M. Bergstrom, S. Euler, and Y. E. Wang. The sky is not the limit: LTE for unmanned aerial vehicles. IEEE Communications Magazine, 56(4):204–210, APRIL 2018.
[59] L. Liu, S. Zhang, and R. Zhang. CoMP in the sky: UAV placement and movement optimization for multi-user communications. arXiv preprint arXiv:1802.10371, 2018.
[60] G. R. Maccartney, T. S. Rappaport, M. K. Samimi, and S. Sun. Millimeter-wave omnidirectional path loss data for small cell 5G channel modeling. IEEE Access, 3:1573–1580, 2015.
[61] D. W. Matolak. Air-ground channels models: Comprehensive review and considerations for unmanned aircraft systems. In 2012 IEEE Aerospace Conference, pages 1–17, March 2012.
[62] D. W. Matolak and R. Sun. Air-ground channel characterization for unmanned aircraft systems: The near-urban environment. In MILCOM 2015–2015 IEEE Military Communications Conference, pages 1656–1660, October 2015.
[63] D. W. Matolak and R. Sun. Air-Ground Channel Characterization for Unmanned Aircraft Systems—Part III: The Suburban and Near-Urban Environments. IEEE Transactions on Vehicular Technology, 66(8):6607–6618, August 2017.
[64] D. W. Matolak and R. Sun. Air–Ground Channel Characterization for Unmanned Aircraft Systems—Part I: Methods, Measurements, and Models for Over-Water Settings. IEEE Transactions on Vehicular Technology, 66(1):26–44, January 2017.
[65] Y. S. Meng and Y. H. Lee. Measurements and Characterizations of Air-to-Ground Channel Over Sea Surface at C-Band With Low Airborne Altitudes. IEEE Transactions on Vehicular Technology, 60(4): 1943–1948, May 2011.
[66] Y. Miao, W. Fan, J. Rodriguez-Pineiro, X. Yin, and Y. Gong. Emulating UAV air-to-ground radio channel in multi-probe anechoic chamber. 2018 IEEE Global Communications Conference: Workshops: 9th International Workshop on Wireless Networking and Control for Unmanned Autonomous Vehicles – Wireless Networking and Control for Unmanned Autonomous Vehicles, 2018.
[67] Microdrones. Fast. Reliable. Safe. Cost-effective: UAV/Drone inspection tools from microdrones. https://www.microdrones.com/en/industry-experts/inspection/, 2018.
[68] A.F. Molisch. Wireless Communications. Wiley – IEEE. Wiley, 2011.
[69] M. Mozaffari, W. Saad, M. Bennis, and M. Debbah. Drone small cells in the clouds: Design, deployment and performance analysis. In 2015 IEEE Global Communications Conference (GLOBECOM), pages 1–6, December 2015.
[70] M. Mozaffari, W. Saad, M. Bennis, and M. Debbah. Drone small cells in the clouds: Design, deployment and performance analysis. In 2015 IEEE Global Communications Conference (GLOBECOM), pages 1–6, December 2015.
[71] M. Mozaffari, W. Saad, M. Bennis, and M. Debbah. Efficient deployment of multiple unmanned aerial vehicles for optimal wireless coverage. IEEE Communications Letters, 20(8):1647–1650, 2016.
[72] M. Mozaffari, W. Saad, M. Bennis, and M. Debbah. Mobile Unmanned Aerial Vehicles (UAVs) for Energy-Efficient Internet of Things Communications. IEEE Transactions on Wireless Communications, 16(11):7574–7589, November 2017.
[73] S.D. Muruganathan, X. Lin, H.-L. Maattanen, Z. Zou, W.A. Hapsari, and S. Yasukawa. An overview of 3GPP release-15 study on enhanced LTE support for connected drones. CoRR, abs/1805.00826, 2018.
[74] K. Namuduri, S. Chaumette, J. H. Kim, and J.P.G. Sterbenz. UAV Networks and Communications. Cambridge University Press, 2017.
[75] W. G. Newhall, R. Mostafa, C. Dietrich, C. R. Anderson, K. Dietze, G. Joshi, and J. H. Reed. Wideband air-to-ground radio channel measurements using an antenna array at 2 GHz for low-altitude operations. In IEEE Military Communications Conference, 2003. MILCOM 2003., volume 2, pages 1422–1427 Vol. 2, October 2003.
[76] H. C. Nguyen, R. Amorim, J. Wigard, I. Z. Kovács, T. B. Sørensen, and P. E. Mogensen. How to ensure reliable connectivity for aerial vehicles over cellular networks. IEEE Access, 6:12304–12317, 2018.
[77] P. Perazzo, F.B. Sorbelli, M. Conti, G. Dini, and C.M. Pinotti. Drone path planning for secure positioning and secure position verification. IEEE Transactions on Mobile Computing, 16(9):2478–2493, 2017.
[78] A.G. Perera, A. Al-Naji, Y. W. Law, and J. Chahl. Human detection and motion analysis from a quadrotor UAV. IOP Conference Series: Materials Science and Engineering, 405(1):012003, 2018.
[79] D. Perez, I. Maza, F. Caballero, D. Scarlatti, E. Casado, and A. Ollero. A ground control station for a multi-UAV surveillance system. Journal of Intelligent & Robotic Systems, 69(1):119–130, January 2013.
[80] C.M. Pinotti, F. Betti Sorbelli, P. Perazzo, and G. Dini. Localization with guaranteed bound on the position error using a drone. In Proceedings of the 14th ACM International Symposium on Mobility Management and Wireless Access, MobiWac ’16, pages 147–154, New York, NY, USA, 2016. ACM.
[81] J.L. Poza-Lujan, J.L. Posadas-Yague, A. Cristobal, and M. Rosa. Indoor drones for the creative industries: Distinctive features/opportunities in safety navigation. Drones and the Creative Industry, pages 129–141, 2018.
[82] Z. Qingling and J. Li. Rain attenuation in millimeter wave ranges. In 2006 7th International Symposium on Antennas, Propagation EM Theory, pages 1–4, October 2006.
[83] Qualcomm. LTE Unmanned Aircraft Systems Trial Report. https://www.qualcomm.com/documents/lte-unmanned-aircraft-systems-trial-report, May 2017.
[84] F. Rosas and C. Oberli. Nakagami-m approximations for multiple-input multiple-output singular value decomposition transmissions. IET Communications, 7(6):554–561, 2013.
[85] A. Rubina and et al. A novel hybrid path planning algorithm for localization in wireless networks. In Proceedings of the 3rd Workshop on Micro Aerial Vehicle Networks, Systems, and Applications, DroNet ’17, pages 13–16, New York, NY, USA, 2017. ACM.
[86] H. Sallouha, M. M. Azari, A. Chiumento, and S. Pollin. Aerial anchors positioning for reliable RSS-based outdoor localization in urban environments. IEEE Wireless Communications Letters, 7(3):376–379, June 2018.
[87] H. Sallouha, M.M. Azari, and S. Pollin. Energy-constrained UAV trajectory design for ground node localization. In IEEE GLOBECOM, pages 1–7, December 2018.
[88] H. Sallouha, A. Chiumento, and S. Pollin. Localization in Long-range Ultra Narrow Band IoT Networks using RSSI. In IEEE International Conference on Communications (ICC), pages 6076–6081, May 2017.
[89] J. Salo, H.M. El-Sallabi, and P. Vainikainen. Statistical analysis of the multiple scattering radio channel. IEEE Transactions on Antennas and Propagation, 54(11):3114–3124, November 2006.
[90] S. Schoenung, S. Dunagan, D. Sullivan, J. Brass, and S. Wegener. UAV over-the-horizon disaster management demonstration projects. In white paper, NASA Ames Res. Center, University Southampton, UK, 2000.
[91] SCI. AeroGuard: Autonomous, rapid-response drone interdiction to stop the 3D threat. http://www.sci.com/aeroguard/, 2018.
[92] S. Shalmashi, E. Björnson, M. Kountouris, K.W. Sung, and M. Debbah. Energy efficiency and sum rate tradeoffs for massive mimo systems with underlaid device-to-device communications. EURASIP Journal on Wireless Communications and Networking, 2016(1):175, July 2016.
[93] M. Silvagni, A. Tonoli, E. Zenerino, and M. Chiaberge. Multipurpose UAV for search and rescue operations in mountain avalanche events. Geomatics, Natural Hazards and Risk, 8(1):18–33, 2017.
[94] M. Simunek, F. P. Fontán, and P. Pechac. The UAV Low Elevation Propagation Channel in Urban Areas: Statistical Analysis and Time-Series Generator. IEEE Transactions on Antennas and Propagation, 61(7):3850–3858, July 2013.
[95] SkySpecs. SkySpecs. http://skyspecs.com/, 2018.
[96] F. B. Sorbelli, S. K. Das, C. M. Pinotti, and S. Silvestri. On the accuracy of localizing terrestrial objects using drones. In 2018 IEEE International Conference on Communications (ICC), pages 1–7, May 2018.
[97] R. Sun and D. W. Matolak. Air-Ground Channel Characterization for Unmanned Aircraft Systems Part II: Hilly and Mountainous Settings. IEEE Transactions on Vehicular Technology, 66(3):1913–1925, March 2017.
[98] R. Sun, D. W. Matolak, and W. Rayess. Air-Ground Channel Characterization for Unmanned Aircraft Systems—Part IV: Airframe Shadowing. IEEE Transactions on Vehicular Technology, 66(9):7643–7652, September 2017.
[99] O. Tekdas, V. Isler, J.H. Lim, and A. Terzis. Using mobile robots to harvest data from sensor fields. IEEE Wireless Communications, 16(1):22–28, 2009.
[100] Cady Lang Time. Dolce & Gabbana Sent Purses Down the Runway Via Drones Because the Future Is Now. http://time.com/5175797/dolce-gabbana-drones-handbags-fashion-show-2018/, 2018.
[101] Greek City Times. Fires burnt 70% of Mati, National Observatory of Athens maps show. https://greekcitytimes.com/2018/08/04/fires-burnt-70-of-mati-national-observatory-of-athens-maps-show/, 2018.
[102] Los Angeles Times. A ‘game changer’ helps California firefighters pierce that haze and target hot spots. http://www.latimes.com/local/wildfires/la-me-ln-california-fires-ferguson-20180808-story.html#, 2018.
[103] T. Tomic, K. Schmid, P. Lutz, A. Domel, M. Kassecker, E. Mair, I. L. Grixa, F. Ruess, M. Suppa, and D. Burschka. Toward a fully autonomous UAV: Research platform for indoor and outdoor urban search and rescue. IEEE Robotics Automation Magazine, 19(3):46–56, September 2012.
[104] H. D. Tu and S. Shimamoto. A Proposal of Wide-Band Air-to-Ground Communication at Airports Employing 5-GHz Band. In 2009 IEEE Wireless Communications and Networking Conference, pages 1–6, April 2009.
[105] K.P. Valavanis and G.J. Vachtsevanos. Handbook of Unmanned Aerial Vehicles. Springer Publishing Company, Incorporated, 2014.
[106] E. Vinogradov, A. Bamba, W. Joseph, and C. Oestges. Physical-statistical modeling of dynamic indoor power delay profiles. IEEE Transactions on Wireless Communications, 16(10):6493–6502, October 2017.
[107] E. Vinogradov, W. Joseph, and C. Oestges. Measurement-based modeling of time-variant fading statistics in indoor peer-to-peer scenarios. IEEE Transactions on Antennas and Propagation, 63(5):2252–2263, May 2015.
[108] E. Vinogradov, D. Kovalev, and S. Pollin. Simulation and detection performance evaluation of a UAV-mounted passive radar. In 2018 IEEE Annual International Symposium on Personal, Indoor, and Mobile Radio Communications (PIMRC), September 2018.
[109] S. Waharte and N. Trigoni. Supporting search and rescue operations with UAVs. In 2010 International Conference on Emerging Security Technologies, pages 142–147, September 2010.
[110] L. Wang, F. Chen, and H. Yin. Detecting and tracking vehicles in traffic by unmanned aerial vehicles. Automation in Construction, 72: 294–308, 2016.
[111] Q. Wu, Y. Zeng, and R. Zhang. Joint trajectory and communication design for multi-UAV enabled wireless networks. IEEE Transactions on Wireless Communications, 17(3):2109–2121, 2018.
[112] Z. Xiao, P. Xia, and X. Xia. Enabling UAV cellular with millimeter-wave communication: potentials and approaches. IEEE Communications Magazine, 54(5):66–73, May 2016.
[113] J. Xu, Y. Zeng, and R. Zhang. UAV-enabled wireless power transfer: Trajectory design and energy optimization. IEEE Transactions on Wireless Communications, 2018.
[114] E. Yanmaz, R. Kuschnig, and C. Bettstetter. Channel measurements over 802.11a-based UAV-to-ground links. In 2011 IEEE GLOBECOM Workshops (GC Wkshps), pages 1280–1284, December 2011.
[115] E. Yanmaz, R. Kuschnig, and C. Bettstetter. Achieving air-ground communications in 802.11 networks with three-dimensional aerial mobility. In 2013 Proceedings IEEE INFOCOM, pages 120–124, April 2013.
[116] F. Yilmaz and M. Alouini. A unified MGF-based capacity analysis of diversity combiners over generalized fading channels. IEEE Transactions on Communications, 60(3):862–875, March 2012.
[117] A. Zanella. Best practice in RSS measurements and ranging. IEEE Comm. Surveys & Tutorials, 18(4):2662–2686, 2016.
[118] L. Zeng, X. Cheng, C. Wang, and X. Yin. Second Order Statistics of Non-Isotropic UAV Ricean Fading Channels. In 2017 IEEE 86th Vehicular Technology Conference (VTC-Fall), pages 1–5, September 2017.
[119] Y. Zeng and R. Zhang. Energy-efficient UAV communication with trajectory optimization. IEEE Transactions on Wireless Com., 16(6): 3747–3760, 2017.
[120] Y. Zeng, R. Zhang, and T. J. Lim. Wireless communications with unmanned aerial vehicles: opportunities and challenges. IEEE Communications Magazine, 54(5):36–42, May 2016.
[121] C. Zhan, Y. Zeng, and R. Zhang. Energy-efficient data collection in UAV enabled wireless sensor network. IEEE Wireless Communications Letters, 7(3):328–331, 2018.
Biographies

Evgenii Vinogradov received the Dipl. Engineer degree in Radio Engineering and Telecommunications from Saint-Petersburg Electro-technical University (Russia), in 2009. After several years of working in the field of mobile communications, he joined UCL (Belgium) in 2013, where he obtained his Ph.D. degree in 2017. His doctoral research interests focused on multidimensional radio propagation channel modeling. In 2017, Evgenii joined the electrical engineering department at KU Leuven (Belgium) where he is working on wireless communications with UAVs and UAV detection.

Hazem Sallouha received the B.Sc. degree in electrical engineering from Islamic University of Gaza (IUG), Palestine, in 2011, the M.Sc. degree in electrical engineering majoring in wireless communications from Jordan University of Science and Technology (JUST), Jordan in 2013. Currently he is a Ph.D. candidate at the Department of Electrical Engineering, KU Leuven, Belgium. His main research interests are localization techniques, communications with unmanned aerial vehicles, Internet of things networks and machine learning algorithms for localization.

Sibren De Bast obtained his B.Sc. degree in Electrical Engineering and Computer Science from KU Leuven, Belgium in 2015. Afterwards, he gained his M.Sc. degree in Electrical Engineering from KU Leuven in 2017. During his master thesis, he researched wireless streaming of stereoscopic video from aerial nodes to a ground station, with the focus on low latency. Currently, he is pursuing the Ph.D. degree at KU Leuven. He is focusing on AI-enhanced wireless communication with UAVs, regarding Massive MIMO and low-latency, high-throughput connections.

Mohammad Mahdi Azari received his B.Sc. and M.Sc. degrees in electrical engineering from University of Tehran, Tehran, Iran. He is currently a doctoral research fellow at the department of electrical engineering, KU Leuven. He worked for Huawei prior to KU Leuven. His current research interests include hybrid terrestrial-aerial communication networks, 5G and heterogeneous cellular networks, cooperative communications, and coding and network coding theory.

Sofie Pollin obtained her PhD at KU Leuven in 2006. She continued her research on wireless communication at UC Berkeley. In November 2008 she returned to imec to become a principal scientist in the green radio team. Since 2012, she is professor at the electrical engineering department at KU Leuven. Her research centers around Networked Systems that require networks that are ever more dense, heterogeneous, battery powered and spectrum constrained. She has been working on drone communication since 2012, given various invited talks on the topic, and authored invited book chapters, journals and tutorials related to UAV communication. She is also co-founder of the ACM workshop DroNET, focusing on drone communication and networks. Prof. Pollin has experience with tutorials at academic conferences such as ICC or Crowncom, or mixed industry/academic fora such as Embedded Silicon West or the SDR forum.
Journal of Mobile Multimedia, Vol. 14_4, 395–468.
doi: 10.13052/jmm1550-4646.1443
© 2018 River Publishers.
1Note that a complete channel model consists of Path Loss (PL), large-scale fading (LS-fading), and small-scale fading (SS-fading) models considering the 3D location of both terminals, environment (rural, sub-urban, urban, etc.), frequency, and other physical link parameters.
2There is no trivial dependency between any of these parameters and the performance metrics described in the following sections. Any change of the link geometry results in a complex change of the network operation.
3For simplicity of notation, d = d3d in Figure 5.
4Expressions for other environments and micro-cell deployment can be found in [3, 6].