An Intelligent Internet of Things (IoT) Sensor System for Building Environmental Monitoring
Qian Huang1,* and Kyle Kieffer2
1 School of Architecture, Southern Illinois University Carbondale, Illinois, USA
2 Electrical and Computer Engineering Department, Southern Illinois University Carbondale, Illinois, USA
E-mail: qhuang@siu.edu; kyle.kieffer@siu.edu
* Corresponding Author
Received 02 August 2018; Accepted 14 May 2019;
Publication 01 June 2019
Abstract
One of the world’s largest sources of energy dissipation is heating, ventilation, and air conditioning (HVAC), which accounts for 40% of total electricity use in the United States. The main challenge of current HVAC systems is that their operation is determined by a set of predefined setpoints regardless of the actual building occupancy status. This is wasteful, especially when no or fewer people occupy buildings, while these HVAC systems deliver more than enough fresh air. Occupancy-driven HVAC control is a promising strategy to improve the efficiency of HVAC systems. In this paper, we will address the next-generation sensor hardware design and explore new system architectures. We systematically investigate, design, and implement a lowcost, hybrid smart sensor platform for accurate occupancy counting towards energy-efficient buildings. Specifically, the proposed hardware architecture is wisely divided into two modules: main and gate monitoring modules. Five heterogeneous sensors are integrated into this architecture to collect richer building environmental parameters, including temperature, humidity, CO2, acoustic, and infrared signals. These sensor signals can be fused and analyzed for cross-correlation to increase the accuracy of building occupancy counting. The proposed systems have been implemented in breadboards and PCB boards. Experimental measurements have validated system functionality and performance.
Keywords: Room occupancy monitoring, Internet of Things, Heterogeneous Sensor.
1 Introduction
Nowadays, energy is a big topic that is being discussed by many professionals in various disciplines. People have a growing demand for energy not only in the United States but throughout the world, mainly in the form of electricity, because it is the most versatile form of energy. As more and more countries become industrialized, their demand for electricity is also increasing. Therefore, more power plants will need to be built or the way that people use energy needs to become smarter. One of the largest energy usages is heating, ventilation, and air conditioning (HVAC). According to the 2011 building energy report [1], approximately 40% of total energy consumption in the United States is for HVAC. The main reason is that most HVAC systems are in fixed operation schedules and at fixed heating/cooling/ventilation settings. No matter how many people or the use of a room/building, the HVAC system runs to keep rooms at a temperature that is set by a central thermostat. With the advances in internet-connected devices, the Internet of Things (IoT) has proven that data collection can be easily achieved with small discrete sensor or communication devices. With that in mind, it is natural to accept that Internet of Things can help cut down on the energy consumption of HVAC systems. Yet, a few things need to be considered when looking at solutions. Personal privacy is a major concern in today’s world of internet connected devices. Another point to look at is the adopted sensors that need to be used to get the most accurate data at low power consumption. The solution also should be easy to integrate into new and existing building given that they may not have wireless connectivity established in these buildings. In this paper, we propose a new solution to resolve these above problems for realizing energy-efficient green buildings.
The idea of deploying miniature environmental sensors in buildings is not new, where carbon dioxide sensors, motion detectors, and temperature gauges are commonly used. Next-generation building is significantly more intelligent with the capability of counting exactly and in real-time how many people are in an HVAC zone. To support this property, sensor systems need to collect considerably rich and diverse data that detail what is happening in a building. Existing hardware solutions for sensor systems are limited in their ability to meet this need. As a result, the main challenge in hardware design is to improve accuracy, functionality, reliability, and flexibility with strict cost and size constraints. With the evolution of the Internet of Things (IoT) technology, it is possible to develop a standalone hardware platform, in which a great number of signal processing and data computation can be run locally rather than in a cloud or central server. It is a challenge to develop lowcost sensor systems to obtain accurate occupancy information in an HVAC zone. Existing sensor systems suffer from many problems, including the lack of heterogeneous sensor diversity, low detection accuracy, weak adaptability, and inadequate privacy protection.
So far, there have been many studies in smart sensor systems for building environmental monitoring towards energy-efficient building operation [2–8]. The study in [2] is associated with a SCOPES project, where SCOPES stands for smart camera object position estimation strategy using the Cyclops cameras. The researchers used their camera systems to track people moving activities within a building and to get an estimation of occupancy density. This study in [2] provides an accurate way of not only estimating the flow of people through a building floor but also knowing the surveillance coverage information.
Another study in [3] takes advantage of the collected building occupancy information to control the operation of HVAC systems. Yet, the lack of reliable and accurate building occupancy information makes it difficult to perform efficient HVAC control. Although many modern buildings are equipped with motion detectors and CO2 sensors for lighting and airflow management, these sensors suffer from their own limitations. For example, motion detectors provide an efficient way to detect occupancy status, but they provide no information about the number of people using the space since their output is a binary process. In fact, actual real-time occupancy is required to optimally control ventilation levels of HVAC systems. While CO2 sensors may provide better indirect measures of actual occupancy, the measured CO2 level varies with other factors such as window opening/close, ventilation setups of current HVAC systems, etc. These CO2 sensors are more suitable for understanding general trends at large time scales.
Furthermore, from a hardware system perspective, the SCOPES system in [2] has a maximum power consumption of 65 mW and a minimum consumption of 15 mW. This feature of low power consumption allows people to run experiments off batteries and easily install them in hallways or major intersections on building floors. From their testing, researchers found the duty cycle that gave them the lowest percentage of error and that adding more than four nodes to an area gave negligible accuracy improvements. When the researchers in [3] performed their experiments, they found that SCOPES leads to an 80% accuracy rate with a false positive rate of 25%, which is slightly higher than what has been reported in [2]. This shows that the SCOPES solution only provides a moderate accuracy in building occupancy counting. In high-security areas, SCOPES would be a benefit because it gives the added benefit of surveillance. In other buildings, such as schools or public access buildings, surveillance is not a major priority. In these cases, SCOPES would be a privacy concern for the building users.
Every person gives off a different amount of CO2 depending on what they are doing, therefore, another approach is looking at CO2 readings in a given area. The paper [4] offers an in-depth review of how the amount of CO2 changes depending on each individual person. This is critical when trying to get and understand an occupancy reading from CO2 sensors. There are no fixed numbers for what a person will produce in a given time, only loose numbers that can be assumed using averaged data. It is also stated in [4] that depending on climate and occupancy patterns, CO2 demand-controlled ventilation may provide significant energy savings in buildings.
Another study [5] reports that when measuring several climate conditions in a room, sound, CO2, motion, and humidity levels have the greatest impact on demand-driven ventilation. With the measurement of CO2 concentration in a room is not enough to accurately predict the occupancy level in that room. When a person types up reports or does other non-intensive tasks, the resultant very small change in the concentration would take a long time to evenly disperse throughout the space. If all rooms were calibrated in a similar fashion, a fitness studio or other similar purpose rooms would be registering a large occupancy when it could be just very few people using it. The benefit of using CO2 sensors is that there are no privacy concerns of people being tracked throughout the day. The downfall of only using CO2 sensors is that it is not as accurate as the SCOPES solution.
As been mentioned in [6], sound level is another environmental parameter that can be used to calculate the occupancy information. This consideration is based on an assumption that if someone is occupying a room, he or she will make more noise that ambient background, whether that be talking on the phone, talking to another person, typing, or just moving around the room. Some sound tests like [6–7] were able to create an audio processing unit, which consists of an array of microphones to process the sound and calculate the number of different voices for occupancy estimation.
The study in [7] achieves a 90% recognition rate when there were 200 different voices in a room with a Gaussian Mixture Mode. The study in [6] used machine learning to add in more sounds and expand the sound database, which would help cut down on false positives such as someone watching TV or playing music. Generally, it is required that audio signals are clean enough to proceed or recognize what the person is saying. The researchers in [8] proposed to perform background noise cancellation before conducting sound analysis and occupancy estimation.
This is also another privacy concern for building occupants. Besides, this approach needs specific hardware for audio processing to take place. Deploying several microphones to a large building would be costly not only in the hardware itself but also the system installation. For example, the localized audio processing units in [6] require CAT 5 data cables to carry acoustic information to the central computer, which houses signal processing algorithms to generate an occupancy map.
The work in [9] relies on a different approach to track individuals in a building. Most large buildings such as college campuses have several access points (AP) positioned on every floor to get good Wi-Fi coverage to anyone within the building. The secured network has logins for every individual person that is registered to be in the building so the network can know the location of a personal phone. The researchers in [9] used a localization algorithm to identify the position of personal phones. The localization algorithm was deployed to a large facility with an accuracy of up to 86%. This is a great improvement over the other solutions since it does not require additional hardware to be deployed to building structures.
The drawback, as with most of these, is privacy. The Wi-Fi network will know where a person’s phone and anything else he or she has connected to the internet. In [11], the researchers integrated multiple sensors into one board under the system constraints of low-cost and small form-factor. This design is versatile to support five sensing functions (i.e., temperature, carbon dioxide, room occupancy, lighting and fire detection) via three sensors (i.e., a temperature sensor, a light sensor and a CO 2 sensor). The drawback of [11] is all sensors are lumped into one board, so the sensing performance is not as good as multiple distributed sensors.
In this paper, we will address the next-generation sensor hardware design and explore new system architectures. Unlike existing sensor systems that incorporate all sensors into a single circuit board, the proposed hardware design is wisely divided into two modules: main and gate monitoring modules. Both modules are distributed and work collaboratively in an HVAC zone. Specifically, personnel entry and exit to an HVAC zone are detected and monitored by gate monitoring modules, which have been developed and tested in an experimental study and shows the great potential for real-time accurate observation of gate traffic. In the preliminary study [12], it has been found that the deployment of the proposed gate monitoring modules in complex buildings resulted in a small possibility of false counting due to temporary noise or interference. Therefore, in order to further improve the system performance, the researchers propose to fuse and analyze other types of sensor data, which are collected by four heterogeneous sensors in the main module. The proposed hardware design architecture has been implemented and tested in this study. A five-minute proof-of-concept video is available at (https://sites.google.com/site/chaolushomesite/). The proposed system is scalable, flexible, portable, easy to use, accurate, low-complexity, non-intrusive, low-power, cost-effective, and adaptive to diverse building environments.
2 Overview of Proposed Sensor System Architecture
Figure 1 illustrates an overview of the proposed smart IoT sensor platform, where two kinds of modules (i.e., main, and gate monitoring) are distributed in this HVAC zone. The entire sensor system is easy to install and does not require labor costs for commissioning and maintenance. Each module does not require wired installation and is powered by a long-life battery. One pair of gate monitoring modules is set up near the door frame to detect real-time doorway traffic. The main module can be placed in any position of interest. Environmental data such as acoustics and carbon dioxide levels are sensed and saved in each module, then the built-in Wi-Fi server enables system-wide wireless communication.
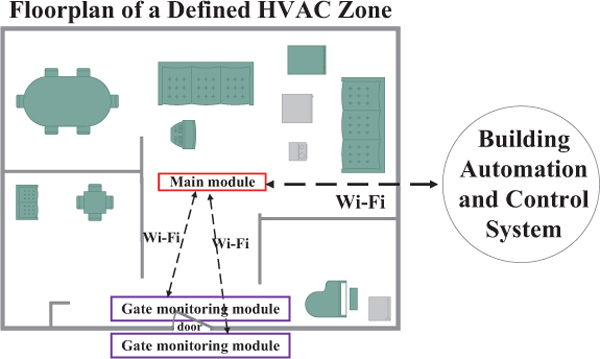
Figure 1 Illustration of proposed IoT sensor platform working in an HVAC zone.
It is an attractive property to establish built-in Wi-Fi servers. Thus, the data communication of our smart sensor system does not depend on the existing Wi-Fi infrastructure in this building. In addition, building users can anytime access the built-in Wi-Fi servers to view real-time building occupancy quantity. Since all the processes of data acquisition, communication, and computation are performed in the proposed design, this smart sensor system is self-contained. Once these raw sensor data are collected, signal processing algorithms can run in the main module to find data cross-correlation and improve the occupancy counting. As all computation may be done locally, no cloud or server computation is involved.
Moreover, our system architecture is cost-effective and scalable. An HVAC zone requires at least one main module and one gate monitoring module. According to a customer’s financial budget, it is flexible to select the number of main modules for an HVAC zone. More deployment of the main module usually results in more granular detection performance. With the Wi-Fi connection, the building automation and control system (i.e., on the right side of Figure 1) will easily access the main module to get all the useful information in the HVAC zone, such as the total number of occupants, the spatial distribution of these occupants across this HVAC zone, CO2, humidity, temperature, and acoustic levels near each main module. In this study, the proposed smart IoT sensor system has been implemented using off-the-shelf components in the market. The proposed system architecture and operational mechanism have been experimentally verified.
3 System Building Modules and Implementation
3.1 Active Infrared Gate Monitoring Module
Figure 2 illustrates how these active infrared (IR) gate monitoring modules operate in a building. Conceptually, a gate monitoring module consists of one receiver (i.e., RX) board and one transmitter (i.e., TX) board. They are attached to each side of a door frame, respectively. Powered by a long-life battery, each TX board transmits the infrared signal in a time interval of half a second towards its corresponding aligned RX board. In this way, two independent infrared beams are established. When an object (e.g., a person) walks through this door, infrared communication is interrupted. Once a signal blocking event is detected by an RX board, the event and its occurrence time will be notified to a main module via the Wi-Fi component in an RX board. The moving direction of an object is determined by comparing which of the two IR beams were obstructed first. The number of occupations increases or decreases by one, depending on the direction in which the person moves.

Figure 2 Concepts of the implemented gate monitoring module with highlighted key components.
Table 1 Component summary of custom boards for two active infrared gate monitoring modules
| Component | Quantity | Cost per Component | Total Cost |
| IR emitter and receiver pair | 4 | $1.95 | $7.80 |
| Resistor (10 kΩ) | 2 | $0.12 | $0.24 |
| Resistor (100 Ω) | 4 | $0.12 | $0.48 |
| Voltage regulator | 2 | $4.95 | $9.90 |
| ESP Wi-Fi module | 1 | $6.95 | $6.95 |
| Arduino Nano | 2 | $3.60 | $7.20 |
| Total Cost | $32.57 |
In our previous study, this idea has been implemented using the Lattice iCEstick evaluation kit [11]. The overall design was demonstrated at the Design Automation Conference (DAC) in June 2017 [12]. In this study, instead of relying on the Lattice FPGA system, we dedicated to design custom TX and RX boards using off-the-shelf components, which are listed and summarized in Table 1.
Figure 3 provides a schematic view of the proposed TX and RX circuits. The infrared emitters and receivers (model name: SEN-00241) manufactured by SparkFun Electronics [13] are a good choice for infrared communication components. They are calibrated to work with the 940 nm wavelength of light, meanwhile rejecting other wavelengths of light. In order to ensure sufficient level of IR signal received by the RX board, two SEN-00241 pairs are adopted in parallel in each TX and RX board. Hence, the infrared link distance gets extended than the original design in [12]. The IR receiver relies on an NPN transistor that is biased by received IR signals in the 940 nm wavelength. When receiving IR signals, the receiver will sink more current. Thus, a higher current causes a more voltage drop at the anode that can be measured easily.
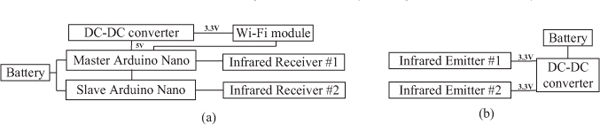
Figure 3 Schematics of the custom gate monitoring module: (a) RX board, and (b) TX board.
When an IR beam is blocked by a person moving through the doorway, the voltage will go up again. As a result, Arduino Nano will detect it as an event. The ESP8266 Wi-Fi device from SparkFun Electronics [14] is included in the RX board for wireless communication. Two Arduino Nanos [15] are used to read the infrared receiver signals and determine if thresholds have been met for a trigging event. Once an event is detected, the RX board sends a notice to the main module through a Wi-Fi connection to update the occupancy count.
Objects larger than one person do not affect the counting operation. According to the brightness of the ambient IR, if the voltage of the detector is increased by a certain amount, an event is triggered. Once the initial increase in IR of the object begins to move through the doorway, it will not count again until another drop in IR is detected. Under bright IR conditions, the voltage drop must be greater than 32 mV to successfully trigger an event.
The 10-bit analog-to-digital (A/D) converter on the Arduino allows the resolution of anode voltage to vary by 3.2 mV, while other sensors on the main module also change. Two Arduino Nanos are used instead of one because of the nature of how they work. Upon boot up, they run through a setup script that initializes variables to store different values. After completing the system initialization, they run a loop script that will never stop until reset or power down. The challenge is that the event of a person walking through a doorway is unpredictable in the loop script. Therefore, a single Arduino Nano might pick up the voltage change phenomena of only one infrared receiver and ignoring the voltage change phenomena of the other infrared receiver. The use of two Arduino Nanos allows for easy system clearing when a false positive detection occurs. Figure 4 outlines the logic used in the master Nano. The slave Nano logic is shown in Figure 5. The main reason a false positive occurs is the ambient IR changes due to a person walking past the doorway but not through it. The total cost for a pair of gate monitoring modules is $32.57.

Figure 4 Block diagram of the logic used in programing the master Nano in the RX board.

Figure 5 Block diagram of the logic used in programing the slave Nano in the RX board.
3.2 Main Module
The main module is another custom module, which consists of four heterogeneous sensors. These sensors are chosen due to the following considerations. The previous work in [5] shows that sound and CO2 levels are the main factors that contribute to figuring out occupancy in a given room. In this work, the sound sensor is chosen carefully to make sure good personal privacy. The sound sensor that we select allows for three outputs. One output is the audio recorded by the microphone, one output is the sound envelope, and the last output is a binary signal that is high when sound is detected or low when there is no sound. In this design, the sound envelope output is chosen because it does not allow someone to listen in on any conversations taking place in the room but still gives how loud the acoustic condition is.
Furthermore, in order to achieve low power consumption, these sensors are selected with a small current to operate and work off a supply voltage of 3.3 V. This allows a simpler design when it comes to power all the sensors at once. Sensors with an operating current of 10 mA or less are specifically designed to operate 3.3V. The ESP8266 Wi-Fi module requires 3.3 V and will burn out if 5V is supplied.
With the addition of the humidity and temperature sensors, this main module can be placed anywhere in an HVAC zone. Because this main module has all the climate sensors in one package, more than one of these units can be deployed in a large office space or big room that has sectioned off spaces for different uses. Since each one relays their own data, there is no dependency among a group of main modules. In addition to environmental sensors, analog-to-digital converters (ADC) and microprocessor are needed to convert and proceed raw sensor signals. In this design, all sensors are shared one ADC for the cost-effective purpose.
The Arduino Nano is chosen because it is user-friendly for testing and debug, and it consists of a 10-bit ADC, is low power, easily reprogrammable for multiple tests. It is also breadboard friendly and takes up little space when implementing the board in the future. Other Arduinos, such as Uno or Mega, take up much more space and are not practical when used in RX boards. As far as the Raspberry Pi is concerned, they can only accept digital inputs. The Raspberry Pi requires additional components to understand the sensor output because they are all analog. Figure 7 outlines the logic used to program the main module.
The Arduino Nano can send serial commands to the ESP Wi-Fi module using software codes. Figure 6 shows the schematic view of the proposed custom main module. Besides, a list of all the components required in each main module is summarized in Table 2. The total cost of a main module is roughly $149, of which the high-precision CO2 sensor is the most expensive component.
3.2.1 Sensor specifications
In this design, each sensor is chosen for high accuracy and low current consumption. The CO2 sensor is accurate to ±50 ppm (parts per million) with a noise measurement of less than 10 ppm. The temperature sensor is accurate to ±1° C from -40° C to 125° C. The humidity is accurate to within 3% of the
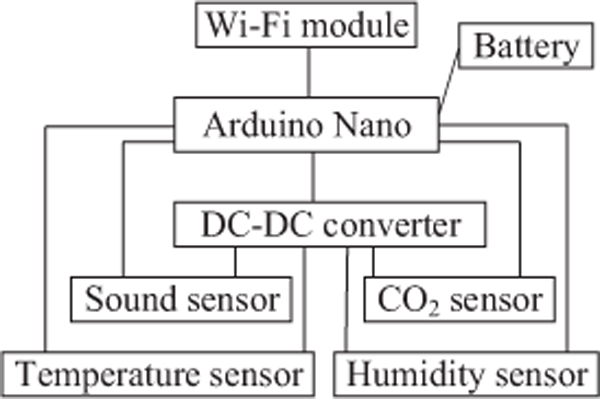
Figure 6 Schematic view of the proposed main module. relative humidity. The sound sensor has a position to add a resistor to vary the gain of the output. If the potentiometer is soldered to the sensor, calibration can be performed. All these sensors have an almost linear hysteresis of the output voltage. Under a 3.3V supply voltage, the sensors consume 3mA, 1mA, 1mA, and 1mA, respectively. The power efficiency of the voltage regulator is 90% when stepping 5V down to 3.3V. The Arduino Nano only consumes 20 mA. With the ESP8266 sending data, the main module has a peak consumption of 0.92 W. Having the ESP enter deep sleep while not transmitting data, the power consumption is 0.27 W.
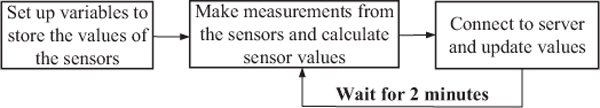
Figure 7 Block diagram of the logic used to program the main module.
Table 2 List of components required to build a main module
| Component | Quantity | Cost | Accuracy |
| CO2 sensor (GC-0010) | 1 | $109 | ±50 ppm |
| Temperature sensor (TMP36) | 1 | $1.50 | ±1?C |
| Humidity sensor (HIH-5030-001) | 1 | $10.16 | 3% |
| Sound sensor (SparkFun SEN-12642) | 1 | $11.95 | N/A |
| Voltage regulator (Adafruit ID: 2745) | 1 | $4.95 | 90% |
| ESP Wi-Fi module (ESP8266-01) | 1 | $6.95 | N/A |
| Arduino Nano | 1 | $3.60 | N/A |
| Ceramic Capacitors | 2 | $0.20 | N/A |
| Electrolytic Capacitor | 1 | $0.48 | N/A |
| Total cost | $149 |
3.3 System Implementation using Breadboards and PCBs
The whole system is firstly implemented using breadboards as shown in Figure 8. After confirming that the design scheme is functional, dedicated printed circuit boards (PCBs) are created using a computer program “Diptrace” as shown in Figure 9. Care was taken to provide wide enough traces to not cause the resistance of traces to impact power delivery or data readings. In addition, a large number of pours have been added to the ground and power rails to ensure that minimum bounce that might occur during Wi-Fi connections and data transmission. The PCB size for the main module is within a 4 by 6-inch, which contains plenty of room for holding a 9V battery pack. The RX and TX boards are supposed to be narrower than the width of a typical door frame. In this design, the dimensions of the RX and TX boards are 1.8 by 6 inches and 1.8 by 2 inches, respectively.

Figure 8 Breadboard assembly and testing setup of gate monitoring and main modules.
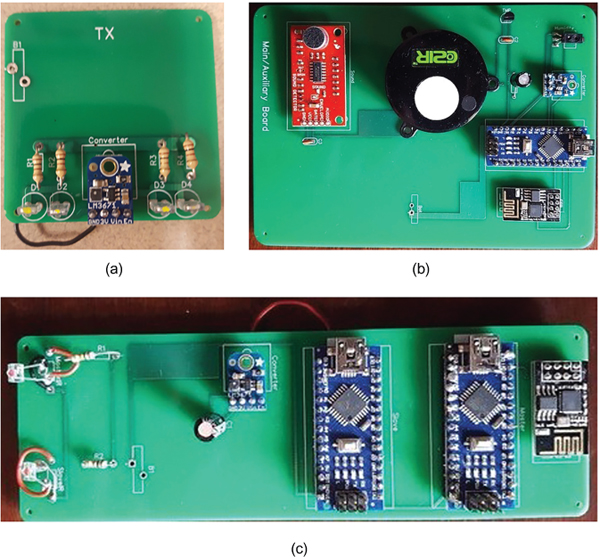
Figure 9 PCB implementation of the design: (a) TX board, (b) main module, and (c) RX board.
4 System Testing and Results
A website called ThingSpeak is used to log and visualize the collected raw sensor data. ThingSpeak provides a free account as well as paid accounts for users that need more complex data analysis and more data storage. It is a flexible platform with Matlab integration that allows users to implement complex algorithms to meet their needs. The free account is used because the data from the main module is set to be updated every two minutes and the gate module is updated only when someone walks through the door. If a user wants to extend it to an entire building, he/she will need a paid account. ThingSpeak can support a certain amount of data within a year, which can be pushed to the server for storage. Assuming that the average gate module pushes data at the same rate as the main module, and each room has one of each module, obtaining one unit will support up to 62 rooms. Since the gate module does not send data unless an event occurs, the average time between data records will be much longer than every two minutes. If the average of the records is once every five minutes, then 156 rooms can be processed by purchasing one unit. The cost of one unit is $650. Expanding to two to five units cost $425 per unit and six to 49 units cost $375 per unit.
Figure 10(a) shows the system testing setups in a research lab. The gate monitoring module was firstly tested to see how the response of gate monitoring module changes with variations of natural light, when it is biased with the infrared emitters, and when somebody is blocking the infrared beams between the emitter and receiver. During this test, it was observed that shadows would change the response of gate monitoring module in an undesired way. After placing a cardstock over the infrared receivers, the number of false positives is reduced. The use of two infrared emitters aiming towards the receivers improves the detection rate up to approximately 90%.
There are still false positives caused by lighting intensity differences or other uncontrollable factors. Adding a timeout to the script of the Arduino Nanos helps to further improve the counting accuracy. It works by waiting a certain amount of time, approximately 30 seconds, after one of the detectors has the voltage change explain in Section 3.1 and if the other does not detect a change then the count is not changed. When multiple people are moving into or out of a room such as after a meeting, the proposed system does not immediately show each individual change, but it updates to a correct count after about two minutes. This is because these events are stored locally on the Arduino Nanos and will be transmitted to ThingSpeak after two minutes. The Wi-Fi module is not quick enough to send the changing count so after everyone has entered/left the room it will then update the count on the server. Figure 11 plots the data that was sent to ThingSpeak during testing and shows the visualization for temperature, humidity, sound and CO2, respectively.

Figure 10 (a) Full setup for testing the gate monitoring and main modules. The TX and RX breadboards are three feet apart and approximately three and a half feet off the ground. RX board prototyped on a breadboard with the receivers under pieces of notecards. (b) Data recorded by ThingSpeak while testing the gate monitoring module. The jump from 0 to 2 demonstrates that multiple people pass without issue.
When connected to a power supply, a RX board consumes a peak power of 0.96 W when transmitting data. When supplied with a 5 V power supply, the TX board consumes 0.3 W. When connected to a 9V power supply to a main module, the average power consumption is 0.92 W. These numbers will be much smaller if enabling the deep sleep mode of the ESP Wi-Fi module, which is the largest power consumer in the main and RX boards.
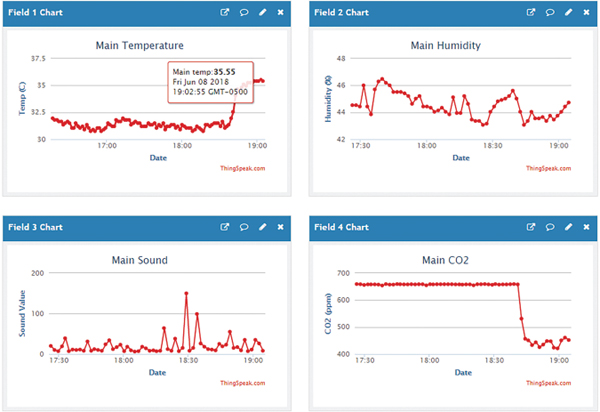
Figure 11 Data measurement and visualization for temperature, humidity, sound and CO2, respectively.
5 Discussion
The proposed smart sensor system is scalable, flexible, portable, easy to use or update, accurate, low-complexity, non-intrusive, low-power, and cost-effective.
Scalable and flexible: Since the proposed system is not affiliated with each building occupant, it is convenient and inexpensive to expand to large-scale buildings. Depending on the financial budget, customers can decide the number of main modules to deploy. This flexibility leads to a trade-off between cost and performance. The proposed IoT sensor system can also accept any commercial or lab-developed environmental sensors.
Portable and easy to use or upgrade: Our system hardware is miniature and lightweight. All software programs are stored locally in the flash memory of the Arduino Nano devices. Therefore, the whole design is portable and easy to duplicate for mass production. In addition, the built-in Wi-Fi network enables remote system maintenance, commissioning, calibration, and upgrade. Each module can report back when a battery is getting low without human intervention so that someone is only checking/changing the battery when it is needed with the addition of a battery monitoring circuit.
Non-intrusive: The proposed sensor hardware system can only extract the short-term energy characteristics of the audio signals. Images, videos or conversations are not captured. The adopted sound sensor only collects sound envelopes, so it protects building occupants’ privacy very well.
Low-power and cost-effective: Our smart sensor platform seeks to maximize hardware reuse. For example, all the sensors in a main module share a common set of power converter, analog-to-digital converter (ADC), microprocessor, embedded memory, and battery. As a result, hardware cost, size, and power consumption are significantly reduced.
The main module is idle most of the time. On average, it takes only two seconds to connect and send data to ThingSpeak. For a complete idle and transmit data cycle, the main module consumes 1.06 mAh of energy. If the RX board follows the same pattern, it consumes 1.56 mAh of energy. This is unrealistic because no one will enter or leave most rooms every two minutes. In fact, an average sleep time of more than two minutes will further reduce the amount of power required. The TX board is always on, so there is never a power drain of less than 60 mA. This is equivalent to 0.06 Ah of energy required to power the TX board. The ampere-hour rating is key when considering batteries. From the above numbers, the main module, RX board, and TX board need to be equipped with a 9.29 Ah battery, a 13.66 Ah battery, and a 525.6 Ah battery, respectively, to sustain one-year operation without battery replacement.
6 Conclusions
In this work, research efforts are made to develop a smart IoT sensor platform with a novel hardware design to support advanced building environmental data collection. The proposed hardware system consists of five types of inexpensive heterogeneous sensors that collect richer environmental information compared to most existing sensor systems. Unlike the incorporation of all sensors into a single circuit board, the proposed hardware design is wisely divided into two modules: main and gate monitoring modules. Each module has a small layout that can easily be retrofitted to most buildings for better user-transparency. This proposed system has been implemented and tested in a research lab. The design modules are portable, low-power, low-complexity, more accuracy, easy to use, non-intrusive, and cost-effective.
7 Future Works
Future improvements can be made to the current design. One improvement is forcing the ESP Wi-Fi modules into deep sleep mode. The ESP8266-01 Wi-Fi component has no accessible deep sleep pins without soldering, but other models (ESP-12) have more footprint. The deep sleep mode shuts off everything except the internal clock. This brings the current consumption from approximately 15 mA in the active mode down to 10 μA in the deep sleep mode. The ESP Wi-Fi component could easily be put to sleep for the period in between main module measurements and then be ready to send the data when the period is up. This is done by issuing the command “AT+GSLP=<time>”, where time is the amount of time that the ESP should sleep (in milliseconds).
The period of deep sleep on the gate module would have to be changed slightly. While the number of people in the room is zero, the ESP Wi-Fi component should stay asleep. But as soon as someone walks in, it should wake up and relay that there is a person in the room. After that, different timings can be adapted to push new occupancy counts depending on how quickly the number is changing.
Another improvement is covering the infrared receivers. The use of cardstocks still allows some ambient light to pass through it, and causes false readings. We believe plastic covers would be thick enough to block ambient infrared light. It is desirable to have a metallic coating to help to bias misaligned emitters to accurately count when people are moving in or out of a room.
To improve the main module, after deep sleep on the ESP, the power can be disconnected from the sensor by connecting the enable pin of the DC-DC converter to a digital pin on the Arduino. Then, before the ADC takes the value of the sensor, the power can be turned on slightly, so that there is time to adjust to the conditions of the room. This will only keep the Arduino on, and everything else will disappear between measurement times.
Author Contributions: Q. H. conceptualized the proposed system architecture, particularly in revising the article for intellectual contents and supervising the whole study; K. K. made significant contributions to this study regarding software development and programming, hardware board design and assembly, and the entire system measurement and testing.
Funding: This research was funded by SIU CASA summer research grant and NSF Energy Scholar Program.
References
[1] Energy, U. (2011). Buildings Energy Data Book, in, 2012.
[2] Kamthe, A., Jiang, L., Dudys, M., and Cerpa, A. (2009, February). Scopes: Smart cameras object position estimation system. In European Conference on Wireless Sensor Networks (pp. 279–295). Springer, Berlin, Heidelberg
[3] Erickson, V. L., Lin, Y., Kamthe, A., Brahme, R., Surana, A., Cerpa, A. E., Sohn, M. and Narayanan, S. (2009, November). Energy efficient building environment control strategies using real-time occupancy measurements. In Proceedings of the First ACM Workshop on Embedded Sensing Systems for Energy-Efficiency in Buildings (pp. 19–24). ACM.
[4] Emmerich, S. J., and Persily, A. K. (2001). State-of-the-art review of CO2 demand controlled ventilation technology and application. Diane Publishing Company
[5] Yang, Z., Li, N., Becerik-Gerber, B., and Orosz, M. (2012). A nonintrusive occupancy monitoring system for demand driven HVAC operations. In Construction Research Congress 2012: Construction Challenges in a Flat World (pp. 828–837).
[6] Uziel, S., Elste, T., Kattanek, W., Hollosi, D., Gerlach, S., and Goetze, S. (2013, October). Networked embedded acoustic processing system for smart building applications. In Design and Architectures for Signal and Image Processing (DASIP), 2013 Conference on (pp. 349–350). IEEE.
[7] Huang, Q., Ge, Z., and Lu, C. (2016). Occupancy estimation in smart buildings using audio-processing techniques. In International Conference on Computing in Civil and Building Engineering (pp. 1413–1420).
[8] Huang, Q. (2018). Occupancy-driven energy efficient buildings using audio processing with background sound cancellation. Buildings, vol. 8, no. 6, pp. 1–16, 2018.
[9] Balaji, B., Xu, J., Nwokafor, A., Gupta, R., and Agarwal, Y. (2013, November). Sentinel: occupancy based HVAC actuation using existing WiFi infrastructure within commercial buildings. In Proceedings of the 11th ACM Conference on Embedded Networked Sensor Systems (p. 17). ACM.
[10] Huang, Q., Mao, C., and Chen, Y. (2017). A compact and versatile wireless sensor prototype for affordable intelligent sensing and monitoring in smart buildings. In International Workshop on Computing in Civil Engineering, pp. 155–161, 2017.
[11] Lattice iCEstick evaluation kit, available at http://www.latticesemi.com/ icestick
[12] Rodriguez, K., Whetstone, N., Habel, S., Lu, C. (2017). A Smart IoT Prototype for Accurate People Counting Towards Energy Efficient Smart Building. In Design Automation Conference, Austin, Dallas, United States.
[13] Infrared emitter and receivers, https://www.sparkfun.com/products/241
[14] Wi-Fi component, https://www.sparkfun.com/products/13231
[15] Arduino Nano, https://store.arduino.cc/arduino-micro-without-headers
Biographies

Qian Huang received the B.A. degree in Law and M.A. degree in International Law from Nankai University in 2004 and 2007. She obtained her Ph.D. degree in Technology at Purdue University, West Lafayette, Indiana, in 2013. Since August 2015, Dr. Huang is an assistant professor in School of Architecture of Southern Illinois University Carbondale. Her research interests include big data analytics on smart building, and information technology systems for building monitoring and management. She has published more than 20 international conferences or journal papers in these areas, and her research is sponsored by US Department of Labor, and CASA research grants.

Kyle Kieffer received the associate degree in Science from Wabash Valley College in 2016. Then he studied at the Electrical and Computer Engineering Department of Southern Illinois University from 2016 to 2018. He obtained his B.S. degree in December 2018.
Journal of Mobile Multimedia, Vol. 15 1&2, 29–50.
doi: 10.13052/jmm1550-4646.15122
© 2019 River Publishers
© 2018 by the authors. Submitted for possible open access publication under the terms and conditions of the Creative Commons Attribution (CC BY) license (http://creativecommons.org/licenses/by/4.0/).