Community Detection Method Based on Two-layer Dissimilarity of Central Node
Yuexia Zhang* and Ziyang Chen
No. 35 Bei Si Huan Zhong Lu, Chaoyang District, Beijing 100101, China
E-mail: zhangyuexia@bistu.edu.cn
* Corresponding Author
Received 18 December 2018; Accepted 05 September 2019;
Publication 16 September 2019
Abstract
Studying community discovery algorithms for complex networks is necessary to determine the origin of opinions, analyze the mechanisms of public opinion transmission, and control the evolution of public opinion. The problem of the existing clustering algorithm of the central node having a low quality of community detection must also be solved. This study proposes a community detection method based on the two-layer dissimilarity of the central node (TDCN-CD). First, the algorithm selects the central node through the degree and distance of the node. Selecting nodes in the same community as the central node at the same time is avoided. Simultaneously, the algorithm proposes the dissimilarity index of nodes based on two layers, which can deeply explore the heterogeneity of nodes and achieve the effect of accurate community division. The results of using Karate and Dolphins datasets for simulation show that compared to the Girvan–Newman and Fast–Newman classical community partitioning algorithms, the TDCN-CD algorithm can effectively detect the community structure and more accurately divide the community.
Keywords: Complex network, community detection, dissimilarity, central node, modularity.
1 Introduction
Complex networks have the characteristics of complexity, being scale-free [1, 2], and having a small world [3], which can be used to express all types of complex systems in nature and the real world. Complex networks have a specific organizational structure, and most of them have community structure characteristics that show the state of local aggregation, but are dispersed overall. The community discovery of complex networks has great significance in the structural analysis and behavioral prediction of complex networks.
At present, the research of complex network community discovery has many proposed ideas and algorithms, which can be divided into graph segmentation, spectral, modularity-based, dynamic, and hierarchical clustering methods. Among them, the hierarchical clustering method can effectively display the network hierarchy and conveniently research on the network topology. Therefore, the hierarchical clustering method has drawn extensive attention in the research of community discovery in complex networks.
Hierarchical clustering methods are divided into split and condensed methods. Divided methods [4, 5] with typical examples of GN algorithms [6, 7] often fail to achieve accurate results. Community ownership cannot be achieved because of the isolated nodes in the sparse network and because time complexity is high. The time complexity of the aggregation method is generally lower than that of the split method, and has a larger application prospect in the study of community discovery.
According to the differing selection range of the node, the condensed method can be divided into three parts, namely the global similarity method [8–10] represented by the FN algorithm proposed by Newman [11], the local similarity method [12, 13] represented by the label propagation algorithm [14, 15], and the cluster method based on the center node represented by the K-means algorithm [16–18]. The clustering method based on the central node has the advantages of better accuracy, high quality of community discovery, wide application scope, etc.
The partitioning results are greatly affected by the starting center node and the long running time because of the disadvantages of the traditional K-means algorithm. This study proposes a community- and node-based community detection method based on two-layer dissimilarity of central node (TDCN- CD). The basic idea of this algorithm is to regard each node in the network as an independent community. First, large-degree nodes are selected based on the node degree. The node’s distance is then used as a criterion for secondary screening to ensure the accuracy of the center node selection. In solving the problem of the same dissimilarity among nodes in the community division, the TDCN-CD algorithm defines the dissimilarity index of the two-level nodes and deeply investigates the node dissimilarities to make the algorithm more accurate and widely applicable. The simulation results show that the TDCN- CD algorithm can effectively detect the community structure and achieve the effect of accurately dividing the community.
2 Network Description
2.1 Complex Network Model
Complex networks can be specifically represented as diagrams G = (V,E), where G is an undirected, unauthorized network, including N nodes and M edges. V is a set of network nodes that can be represented as V = {V1,...,VN }. E is a collection of network edges that can be represented as E = {Eα|Eα ∈ V × V,α = 1,...,M}. The connection between nodes is represented by the adjacency matrix A, and the value of A is 0 or1. If an edge connection exists between i and j, Aij = 1; otherwise, Aij = 0.
The distance Si,j between nodes i and node j is represented by a global- based neighbor node metric, as shown in (1).
| (1) |
2.2 Single-layer Node Dissimilarity Index
The dissimilarity index of a node can describe the connection between nodes in a complex network. This measures the probability that two nodes belong to the same community. In the study of complex networks, the average path is commonly used as a method for calculating the dissimilarity of nodes. The average path L from nodes i to j is taken as the dissimilarity index of nodes, which is proposed in the literature and shown in (2).
| (2) |
d(Vi,Vj ) represents the shortest path length from nodes i to j. Its physical meaning is the number of minimum edges that nodes i and j have to walk through.
The TDCN-CD algorithm adopts a global neighbor node measurement method and uses the distance Si,j between nodes as the evaluation index Yi (Vi, Vj) of the single-layer node dissimilarity, as shown in (3), because of the high computational complexity of (2).
| (3) |
2.3 Degree of the Node
The degree ki of a node refers to the number of all adjacent nodes of node i, as shown in (4).
| (4) |
3 Two-layer Node Dissimilarity Index
The single-layer node dissimilarity index is used to divide the community. The nodes can have the same asymmetry, and the community status of a node cannot be judged according to the anisotropic nature of the single-layer nodes. The TDCN-CD algorithm defines the dissimilarity index of the two- layer node to solve this problem, which further ensures the accuracy of the final community division.
As shown in Figure 1, two possible connection situations can be observed between nodes i and j. The first type involves the two-layer adjacency node q of node i being directly connected to node j. That is, nodes i and j are connected by two nodes p and q. In this case, the two-layer dissimilarity index
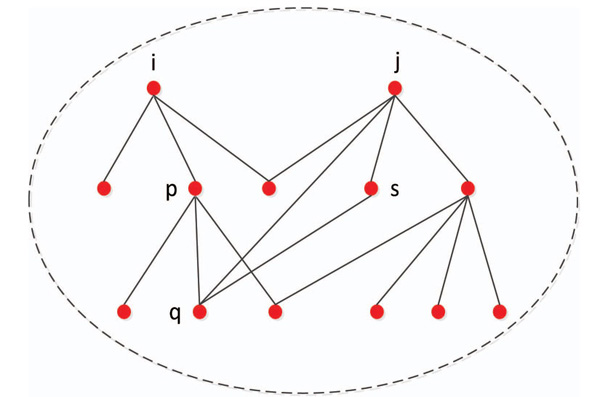
Figure 1 Public node of two nodes.
of nodes i and j can be expressed as (5).
| (5) |
The second type involves the two-layer adjacency node q of node i being directly connected to one layer of the adjacent nodes s of node j. That is, nodes i and j are connected by three nodes, namely p, q, and s. In this case, the two-layer dissimilarity index of nodes i and j can be expressed as (6).
| (6) |
Comprehensively considering the two situations above, the TDCN-CD algorithm-defined two-layer node dissimilarity index γ2(Vi,Vj) can be expressed as (7).
| (7) |
The above formula (7) comprehensively considers the number of single-layer neighbor nodes and the number of second-layer neighbor nodes in the definition of node similarity index, which effectively avoids the problem that community division cannot be performed because the number of single-layer neighbor nodes is the same.
For a node i in the network, the clustering coefficient is defined as the ratio of the number of connected edges between its neighbors to the possible sides. The mathematical expression is shown in (8).
| (8) |
R(i) represents the number of connected edges between the ki neighbors of node i. C is the average clustering coefficient shown in (9).
| (9) |
R(i) is the average clustering coefficient shown in (9).
4 TDCN-CD Algorithm
4.1 TDCN-CD Algorithm
The TDCN-CD algorithm first traverses the entire network G, then calculates the degree of all nodes in the network according to (4). Next, it sorts the nodes in a descending order according to their degree and, after sorting, constitutes a set VH = {V1,..., Vi, Vi+1,VN}, ki > ki+1. The first δ% of the nodes in the set VH is selected to form a node set Vmax, where Vmax represents a large number node set, as shown in the following formula (10).
| (10) |
In avoiding the selected multiple central nodes in the same community, we also need to perform secondary filtering on the needed large numbers of nodes. As shown in Figure 2, the nodes in the same community are very close. That is, the dissimilarity of the major nodes in the same community is much smaller than that of the major nodes in different communities. Therefore, using the measure of the dissimilarity index of (3), calculating the dissimilarity between two nodes in the set Vmax, setting threshold D, retaining large dissimilar nodes, and constituting node set Vcore = {V1,...,VF}, F indicates the number of network center nodes.
4.2 Community Division Based on Two Layers of Dissimilarity Indicators
After determining the network center node according to the abovementioned steps, we need to determine the communities to which the remaining nodes belong to. The community to which the node should belong to is calculated according to the single-node dissimilarity index in (3).
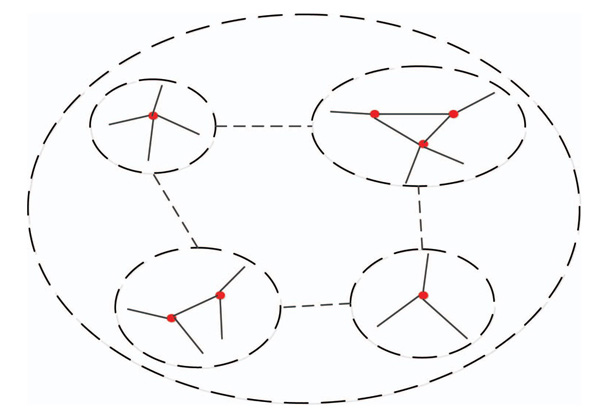
Figure 2 Community relations of network G.
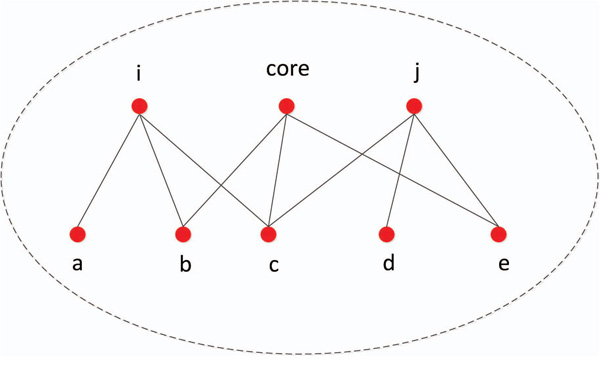
Figure 3 Public adjacency node with the central node.
As shown in Figure 3, we simply consider the single-layer node dissimilarity indicators. Node i and the central node may have two common connected single-layer neighbor nodes, b and c. The single-layer node dissimilarity calculated according to (3) is √3. Node j and the central node also have two common connected single-layer neighbor nodes, c and e. The singlelayer node dissimilarity calculated according to (3) is also √3. Nodes i and j have the same anisotropy, and cannot determine which community they belong to. We need to calculate their two-layer node dissimilarity evaluation index according to (7) and divide the nodes into the community where the central node with the least heterogeneity is located.
4.3 Using the Modularity Function to Evaluate the Results of Division
Newman et al. proposed the network modularity evaluation function [19–22], which is defined as (11). Its physical meaning is the proportion of edges connecting two nodes of the same type in the network minus the expected value of the proportion of the edges arbitrarily connecting the two nodes under the same community structure. The modularity function is usually expressed by (11).
| (11) |
eij represents the proportion of the edges of the nodes in the network that link two different communities in all sides. These two nodes are located in the ith and jth communities. The sum of the elements in each row (or column) is , which represents the proportion of edges connected to the nodes in the ith community in all sides.
Traversing all nodes in the network and according to the two-layer dissimilarity index, the nodes are divided into different communities, where the central nodes are located. The modularity function Q is used as an evaluation index for the quality of community division.
5 Experimental Analysis and Comparison
This study uses two real network data sets, namely Karate and Dolphins, to conduct the experimental test and test the performance of the TDCN-CD algorithm.
5.1 Analysis of Community Division Based on Real Network Datasets
5.1.1 Community division analysis based on the Karate network
The Karate network is a social network built for members of the American University Karate Club. The network contains 34 nodes and 78 edges. The nodes in the network represent club members, while the edges represent the connections between the members. Figure 4 shows the network topology.
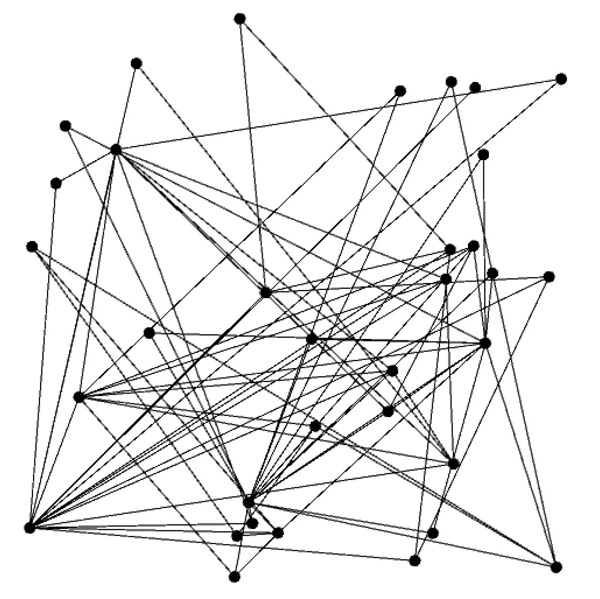
Figure 4 Topology of the Karate network.
The TDCN-CD algorithm needs to use the two indicators of degree and average clustering coefficient in the community division of complex networks. Figure 5 shows the degrees of nodes in the Karate network, while Figure 6 depicts the clustering coefficients.
The TDCN-CD algorithm is used to divide the community in the Karate network. Figure 7 shows the results. The TDCN-CD algorithm proposed herein is divided into two parts in the central node selection to ensure the accuracy of the algorithm. First, the TDCN-CD algorithm traverses the entire network and ranks in a descending order because the number of central nodes is the final number of community partitions. After repeated verification, when δ = 31, that is E ≈ 10% · N, the final number of central nodes can be completely covered. A large proportion of the selection of large-degree node sets only increases the difficulty of running the algorithm and increases the running time; hence, the top 10% of the nodes is finally selected to form a large-degree node set. Second, the TDCN-CD algorithm performs secondary screening on large nodes to avoid the selected central nodes in the same community. In the code-debugging process, we find three nodes and the calculated dissimilarity values of [4.7958, 4.5825, 2.8284]. The third dissimilarity value is significantly
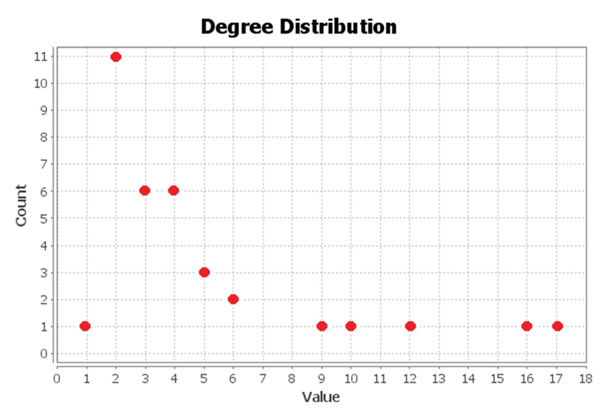
Figure 5 Degree of the Karate network.
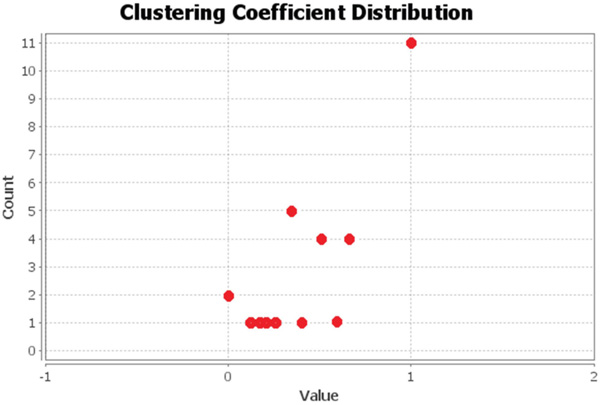
Figure 6 Clustering coefficient of the Karate network.
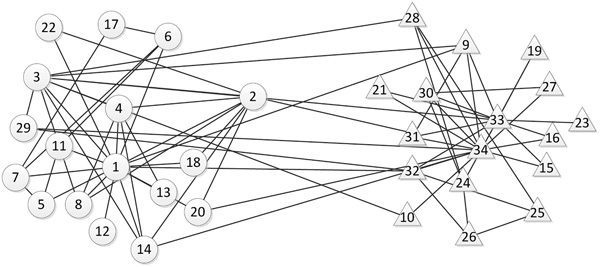
Figure 7 Community division results of the Karate network based on the TDCN-CD algorithm.
smaller than the first two, and should be removed. Therefore, in this test, threshold D is set to 4. Compared with the real network, the node with number 10 is incorrectly divided, and the remaining nodes have the same division result as the real network.
5.1.2 Community division analysis based on the Dolphins network
The Dolphins network is a social network built to study the membership in the dolphin community. The network includes 62 nodes and 159 edges. The nodes in the network represent the members of the community, while the edges represent the links between the members. Figure 8 shows the network topology. Figure 9 depicts the degree of nodes in the Dolphins network. Figure 10 shows the clustering coefficients.
The TDCN-CD algorithm is used for community partitioning on the Dolphins network. Figure 11 illustrates the results. The TDCN-CD algorithm proposed herein is divided into two parts in the central node selection to ensure the accuracy of the algorithm. First, take δ = 492, that is E ≈ 10% · N, in the selection of the large degree node set, and select the top 10% of the nodes to form a large degree node set. Second, the TDCN-CD algorithm performs secondary screening on large nodes to avoid the selected central nodes in the same community. In the code-debugging process, we find six nodes and the calculated dissimilarity values of [4.3589, 2.4495, 4.2426, 2.4495, 3.1622, 3.6056]. The dissimilarity values of the second, fourth, and fifth nodes are significantly smaller, and should be removed. The values of the first, third, and sixth nodes are relatively close. Experiments show that when threshold D = 4 is taken, the community partitioning effect is the best, that is, the sixth value should also be removed. Therefore, in this test, threshold D is set to 4.
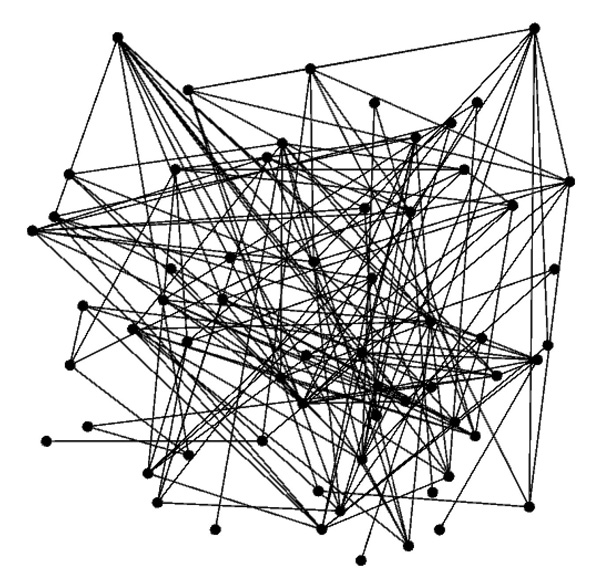
Figure 8 Topology of the Dolphins network.
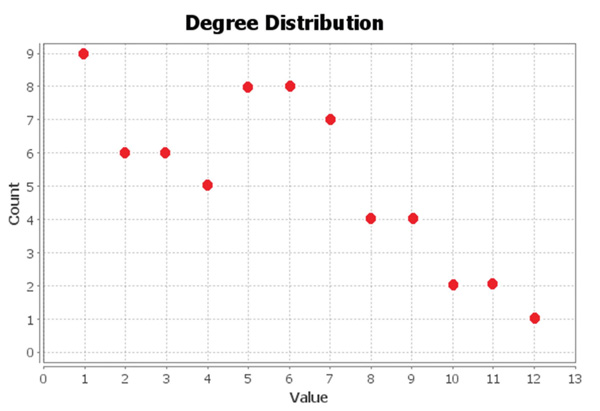
Figure 9 Degree of the Dolphins network.
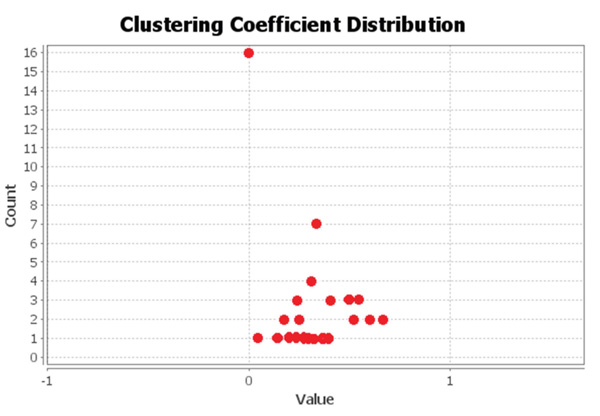
Figure 10 Clustering coefficient of the Dolphins network.
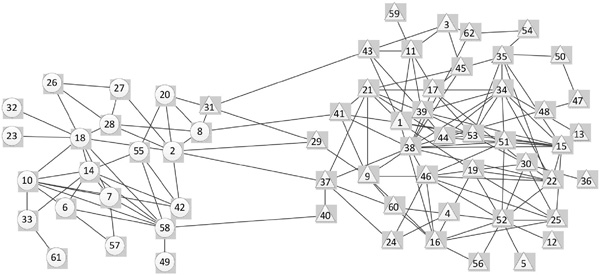
Figure 11 Community division results of the Dolphins network based on the TDCN-CD algorithm.
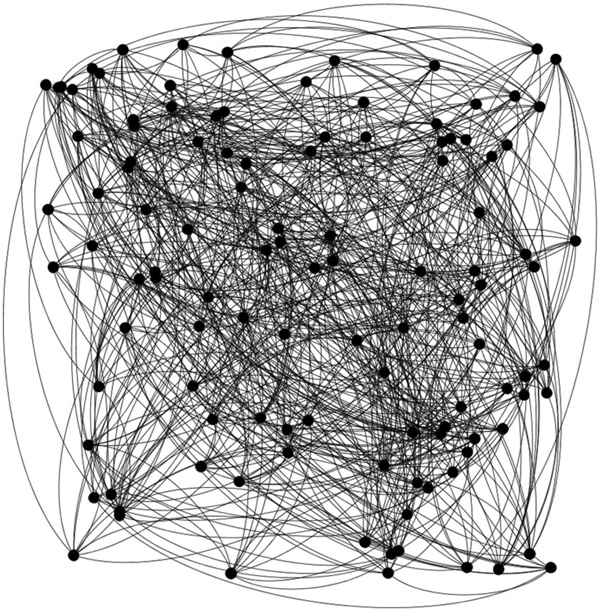
Figure 12 Topology of the Football network.
Compared with the real network, the node numbered 31 is incorrectly divided, and the remaining nodes are all the same as the real network.
5.1.3 Community division analysis based on the Football network
The Football network is a social network built to study the membership in the football community. The network includes 115 nodes and 613 edges. The nodes in the network represent the members of the community, while the edges represent the links between the members. Figure 12 shows the network
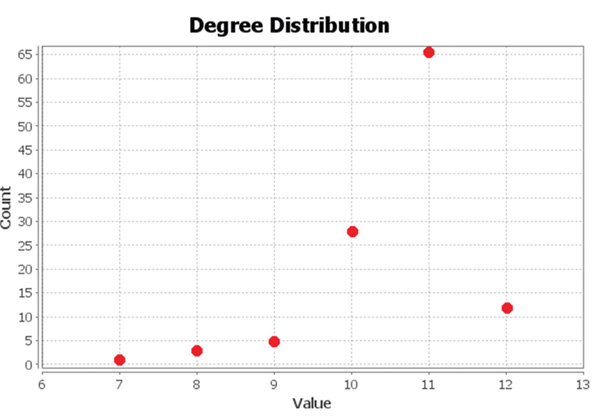
Figure 13 Degree of the Football network.
topology. Figure 13 depicts the degree of nodes in the Football network. Figure 14 shows the clustering coefficients.
The TDCN-CD algorithm is used for community partitioning on the Football network. Figure 15 illustrates the results. The TDCN-CD algorithm proposed herein is divided into two parts in the central node selection to ensure the accuracy of the algorithm. First, take 8 = 492, that is E ≈ 10% · N, in the selection of the large degree node set, and select the top 10% of the nodes to form a large degree node set. Second, the TDCN-CD algorithm performs secondary screening on large nodes to avoid the selected central nodes in the same community. In the code-debugging process, when threshold D = 5 is taken, the community partitioning effect is the best. Therefore, in this test, threshold D is set to 5.
5.2 Community comparison based on real network datasets
This study uses modularity Q as an indicator to evaluate the quality of community classification. In real network datasets, it compares the community quality of the TDCN-CD algorithm and the classical GN and FN algorithms. Tables 1–3 show the experimental results. The value of Q obtained by the community division of the Karate network in the TDCN-CD algorithm
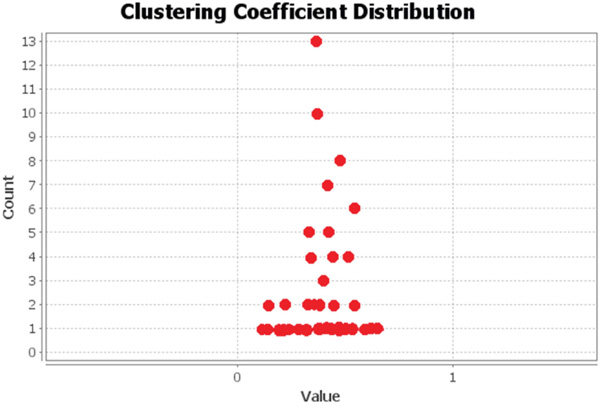
Figure 14 Clustering coefficient of the Football network.

Figure 15 Community division results of the Football network based on the TDCN-CD algorithm.
Table 1 Community-divided experimental results on the Karate network
| GN | FN | TDCN-CD |
| Q 0.6848 | 0.4970 | 0.7293 |
Table 2 Experimental results of community division on the Dolphins network
| GN | FN | TDCN-CD |
| Q 0.8245 | 0.5794 | 0.8356 |
Table 3 Experimental results of community division on the Football network
| GN | FN | TDCN-CD |
| Q 0.5894 | 0.4753 | 0.6032 |
is 0.7293, obtained by the community division of the Dolphins network in the TDCN-CD algorithm is 0.8356, while that obtained after community division in the Football network is 0.6032. The results are both higher than those of the two classical algorithms. The results are both higher than those of the two classical algorithms.
6 Conclusion
This study proposes a TDCN-CD algorithm based on the heterogeneity of two-layer nodes for the deficiencies of the current node-based dissimilarity measurement methods. The algorithm uses the degree and distance of the node as an evaluation index and determines the central node through two screenings to ensure the correctness of the central node selection. This is done to solve the problem that the single-layer nodes have the same dissimilarity index and cannot determine the community to which the node belongs to. This study introduces the two-layer dissimilarity index to ensure the accuracy of community division. Through an experimental analysis in real data sets, we can see that the TDCN-CD algorithm proposed herein is better than the classic GN and FN algorithms for community division. Therefore, the TDCN-CD algorithm is an effective community-partitioning algorithm.
References
[1] Jin Zhou, Xinghuo Yu, Jun-an Lu, ‘Node Importance in Controlled Complex Networks’, IEEE Transactions on Circuits and Systems II: Express Briefs, pp. 1–1, 22 June 2018.
[2] Carlos J. Vega, Edgar N. Sanchez, Guanrong Chen, ‘Trajectory Tracking on Complex Networks With Non-Identical Chaotic Nodes via Inverse Optimal Pinning Control’, IEEE Control Systems Letters, vol. 2, no. 4, pp. 635–640, 22 June 2018.
[3] Sujoy Das, Sadia Sharmin, Md. Saidur Rahman, ‘Generating proactive humanitarian aid networks with guided topology and small-world effect’, 2017 IEEE Region 10 Humanitarian Technology Conference (R10-HTC), pp. 682–685, 12 February 2018.
[4] Ali Moradi Amani, Mahdi Jalili, Xinghuo Yu, Lewi Stone, ‘Finding the Most Influential Nodes in Pinning Controllability of Complex Networks’, IEEE Transactions on Circuits and Systems II: Express Briefs, vol. 64, no. 6, pp. 685–689, June 2017.
[5] Wei Peng, Jianxin Wang, Fangxiang Wu, ‘A dividing-and-matching algorithm to detect conserved protein complexes via local network alignment’, 2013 IEEE International Conference on Bioinformatics and Biomedicine, pp. 78–81, 06 February 2014.
[6] Ding Yanrui, Zhang Zhen, Wang Wenchao, Cai Yujie, ‘Identifying the Communities in the Metabolic Network Using ‘Component’ Definition and Girvan-Newman Algorithm’, 2015 14th International Symposium on Distributed Computing and Applications for Business Engineering and Science (DCABES), pp. 42–45, 10 March 2016.
[7] Ljiljana Despalatović, Tanja Vojković, Damir Vukicevic, ‘Community structure in networks: Girvan-Newman algorithm improvement’, 2014 37th International Convention on Information and Communication Technology, Electronics and Microelectronics (MIPRO), pp. 997–1002, 24 July 2014.
[8] Canh Hao Nguyen, Nicolas Wicker, Hiroshi Mamitsuka, ‘Selecting Graph Cut Solutions via Global Graph Similarity’, IEEE Transactions on Neural Networks and Learning Systems, vol. 25, no. 7, pp. 1407–1412, July 2014.
[9] Biao Jie, Mingxia Liu, Daoqiang Zhang, Dinggang Shen, ‘Sub-Network Kernels for Measuring Similarity of Brain Connectivity Networks in Disease Diagnosis’, IEEE Transactions on Image Processing, vol. 27, no. 5, pp. 2340–2353, May 2018.
[10] Jin Zhou, Long Chen, C. L. Philip Chen, Yingxu Wang, Han-Xiong Li, ‘Uncertain Data Clustering in Distributed Peer-to-Peer Networks’, IEEE Transactions on Neural Networks and Learning Systems, vol. 29, no. 6, pp. 2392–2406, June 2018.
[11] Pravin Chopade, Justin Zhan, ‘A Framework for Community Detection in Large Networks Using Game-Theoretic Modeling’, IEEE Transactions on Big Data, vol. 3, no. 3, pp. 276–288, 01 September 2017.
[12] Liang Zhao, Zhikui Chen, Zhennan Yang, Yueming Hu, Mohammad S. Obaidat, ‘Local Similarity Imputation Based on Fast Clustering for Incomplete Data in Cyber-Physical Systems’, IEEE Systems Journal, vol. 12, no. 2, pp. 1610-1620, June 2018.
[13] Zhong Li, Cheng Wang, Siqian Yang, Changjun Jiang, Xiangyang Li, ‘LASS: Local-Activity and Social-Similarity Based Data Forwarding in Mobile Social Networks’, IEEE Transactions on Parallel and Distributed Systems, vol. 26, no. 1, pp. 174–184, 01 Jan 2015.
[14] Qian Shi, Bo Du, Liangpei Zhang, ‘Domain Adaptation for Remote Sensing Image Classification: A Low-Rank Reconstruction and Instance Weighting Label Propagation Inspired Algorithm’, IEEE Transactions on Geoscience and Remote Sensing, vol. 53, no. 10, pp. 5677–5689, October 2015.
[15] Pengcheng Zhang, Xuewu Zhou, Patrizio Pelliccione, Hareton Leung, ‘RBF-MLMR: A Multi-Label Metamorphic Relation Prediction Approach Using RBF Neural Network’, IEEE Access, vol. 5, pp. 21791–21805, 02 October 2017.
[16] Xiaojun Chen, Xiaofei Xu, Joshua Zhexue Huang, Yunming Ye, ‘TW-k- means: Automated two-level variable weighting clustering algorithm for multiview data’, IEEE Transactions on Knowledge and Data Engineering, vol. 25, no. 4, pp. 932–944, April 2013.
[17] Fasahat Ullah Siddiqui, NorAshidi Mat Isa, ‘Enhanced moving K-means (EMKM) algorithm for image segmentation’, IEEE Transactions on Consumer Electronics, vol. 57, no. 2, pp. 833–841, May 2011.
[18] Vethamuthu Nesamony Manju, Alfred Lenin Fred, ‘AC coefficient and K-means cuckoo optimisation algorithm-based segmentation and compression of compound images’, IET Image Processing, vol. 12, no. 2, pp. 218–225, January 2018.
[19] Mingming Chen, Konstantin Kuzmin, Boleslaw K. Szymanski, ‘Community Detection via Maximization of Modularity and Its Variants’, IEEE Transactions on Computational Social Systems, vol. 1, no. 1, pp. 46–65, March 2014.
[20] Zhangtao Li, Jing Liu, Kai Wu, ‘A Multiobjective Evolutionary Algo-rithm Based on Structural and Attribute Similarities for Community Detection in Attributed Networks’, IEEE Transactions on Cybernetics, vol. 48, no. 7, pp. 1963–1976, July 2018.
[21] G. Agarwal, D. Kempe, ‘Modularity-maximizing graph communities via mathematical programming’, European Physical Journal B, vol. 66, no. 3, pp. 409–418, December 2008.
[22] M. E. J. Newman. ‘Modularity and community structure in networks’, pp. 8577–8582, 2006.
Biographies

Yuexia Zhang (1978–), female, born in Anyang, Henan Province, received her master’s and doctoral degrees in Information and Communication Engineering from Beijing University of Posts and Telecommunications in 2008. She has been an assistant professor at the School of Information and Communication Engineering of Beijing Information Science and Technology University since 2008. Her research interests include wireless cooperative commu-nication technology, ultra-wideband technology and wireless positioning technology.

Ziyang Chen (1995–), female, born in Beijing, received a bachelor’s degree in Information and Communication Engineering from Beijing Information Science and Technology University in 2017. She is currently pursuing a master’s degree at Beijing University of Information Science and Technology. Her research direction is complex network public opinion communication analysis.
Journal of Mobile Multimedia, Vol. 15_1&2, 71–90.
doi: 10.13052/jmm1550-4646.15124
© 2019 River Publishers