Capacity Analysis of Non-Orthogonal Multiple Access for Uplink and Downlink
Saurabh Srivastava1,*, Prajna Parimita Dash1 and Sanjay Kumar2
1Dept. of ECE, Birla Institute of Technology, Mesra, Jharkhand, India
2Dept. of ECE, Birla Institute of Technology, Mesra (Deoghar Campus), Jharkhand, India
E-mail: saurabhnitkian@gmail.com
*Corresponding Author
Received 18 September 2020; Accepted 06 November 2020; Publication 26 January 2021
Abstract
Non-orthogonal multiple access (NOMA) is intended to be used for the next generation 5G cellular networks. In this paper, the expressions for the channel capacities for symmetric and asymmetric NOMA networks have been analysed. The performance measure of user spectral efficiency and the sum-rate bounds, for the NOMA and the existing orthogonal multiple access (OMA) networks have been compared. Furthermore, analysis of user rate and capacity of NOMA network has been carried out and it is observed that the NOMA capacity region varies as a function of the power allocation factor. The corresponding models have been developed for both uplink and downlink, and simulated with MATLAB. The NOMA performance with imperfect Successive Interference Cancellation (SIC) decoding is also analysed for the downlink. It is also verified that the transmit power may be increased to counter the spectral efficiency reduction due to imperfect SIC.
Keywords: OMA, NOMA, rate-region, spectral efficiency, power allocation factor.
1 Introduction
The mobile communication has significantly gone through various generations. The motivating factor for each of the subsequent generation is marked with higher user data rate, and enhanced user services than the previous one. Though the current 4G cellular standard provides a high data rate, the requirement of high-data rate is massively increasing. A variety of comparatively new user services such as massive machine type communication (mMTC), ultra-reliable low latency communication (URLLC) and enhanced Mobile Broadband (eMBB), have been demanding new and efficient models for the upcoming 5G cellular services.
It is also expected that the number of connected Internet of Things (IoT) devices to reach 25 billion by 2025 [1]. These massive connective devices characterize high magnitude of connection volumes, small data traffic volumes, ultra-reliability, higher availability, very low latency, high throughput etc to cater the 5G demands. The current 4G cellular is not able to fulfil these diverse requirements, as the 4G vision is centred on cellular mobile and not focusing on these newer diversified cases. Thus, 5G has to come up with the solutions to the above cases. The next generation mobile networks (NGMN) alliance discusses these different new cases [2]. Specifically, it mentions the improvements required in spectral efficiency of the cell (bps/Hz/cell) and user spectral efficiency (bps/Hz/user) for supporting the massive connectivity between users as well as devices.
The major objective in the cellular generations has been to achieve a larger user throughput, or a larger user data-rate. A large user throughput signifies an efficient network by maximizing each user’s throughput to its capacity. So, the objective across data networks and now the cellular generation is to maximize the capacity. Moreover, the 5G network is also supposed to cater to a number of other key performance indicators such as a reduced latency (user-plane) of about 1 ms for eMBB and URLLC applications; and energy efficiency in eMBB use case [3]. The above performance indicators suggest a new waveform design or specifically a multiple access scheme that provides a higher spectral efficiency, higher energy efficiency, lower latency, more user-fairness and massive connectivity for device to device communication and IoT. Since the waveform design has been the most fundamental aspect of the physical layer, the signalling and multiple access formats have significantly changed over the cellular generations. The adoption of Orthogonal Frequency Division Multiple Access (OFDMA) in 4G, as a variation of OFDM (Orthogonal Frequency Division Multiplexing (OFDM) offered several advantages compared to its predecessors, like computationally efficient implementation and simple equalization [4]. The foremost flaws of OFDM include its high peak-to-average-power ratio (PAPR), and the requirement of strict orthogonality among its sub-carriers. All the existing multiple access techniques have been utilizing the orthogonality between their shares in the user’s resource block. Hence, these multiple access schemes are classified as orthogonal multiple access (OMA) schemes. The major concern of the provision of massive connection density, high capacity and low latency in the 5G networks specify the current spectrum utilization to be made more efficient. One of the mechanisms is simply allocating more users within a single resource block, avoiding the orthogonality restriction between the users. In this regard, Non–Orthogonal Multiple Access (NOMA) is treated as a promising candidate for 5G cellular networks [5]. NOMA simply allocates multiple users to a single resource block in contrast with 4G OFDMA that allocates one resource block to each user. Hence, a significant increase in capacity with NOMA can be observed theoretically, by sharing each resource block among several users, and each user utilizes the complete resource block. Thus, NOMA provides system overloading [6], which is highly desirable for massive connection density. In NOMA, the users utilize the complete resource block and transmit or receive the signals simultaneously without being differentiated in time/frequency/code domain. The receiver differentiates the user’s messages either based on the different user power levels, or by using different sparse (spreading) codes that are non-orthogonal. The contributions of the paper are as follows:
• Comparison of the uplink and downlink user throughputs for both asymmetric and symmetric channel conditions.
• Evaluation of the effect of power allocation factor on the capacity region in the downlink as well as in the uplink scenarios.
• Formulation of the capacity region and capacity points for uplink and downlink NOMA.
• Evaluation of the NOMA performance with imperfect successive interference cancellation (SIC).
The paper is organized as follows. Section 2 presents NOMA classification. This section highlights the characteristics of Power Domain (PD) NOMA, and the processes involved at the transmitting and receiving ends of the system. Section 3 identifies the performance metrics of the proposed system, specifically defining the capacity, spectral-efficiency, user-rates and the sum-rate. In Section 4, the proposed system model for carrying out the analysis of the capacity region in PD-NOMA network is described. In this section, the evaluation of the rate-region is performed, depending upon the received signal-to-noise+interference ratio (SINR). We also deal with the mathematical analysis of the symmetric and asymmetric cases and thus obtain the rate-region variation based on the allocated power. As far as our knowledge is concerned, no such in-depth analysis has been presented in the available literatures that takes all these cases into account. Finally, the effect of imperfect decoding of user messages is also shown in the paper. Section 5 describes the simulation parameters and interprets the results obtained with MATLAB. To end, section 6 concludes the paper justifying the candidature of NOMA as a future multiple access scheme.
2 Related Work
NOMA refers to a new signal design where the users share time and frequency simultaneously. Studies as in [5, 7, 8] show that higher spectral efficiency can be achieved with NOMA. The NOMA schemes are categorized as either power domain, code domain or related schemes as given in [9, 10].
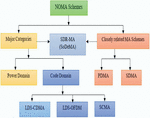
NOMA offers some significant capabilities that may assist in achieving the key performance metrics of diverse 5G use cases. In a typical NOMA system, the users may be multiplexed and differentiated in the power domain, hence given the name, PD-NOMA. The focus of the paper is towards the power domain NOMA and specifically to a two-user case only. Due to the least complexity among all the schemes, the PD-NOMA has become the most studied scheme among all the NOMA schemes [5–7]. Some other characteristics of NOMA are as follows. Firstly, it can easily be implemented alongwith narrower beams for spatial multiplexing, providing a combination of power domain multiplexing and spatial multiplexing. This would be increasing the overall system capacity. Secondly, SC and SIC are simple processes and have been well studied by the academia. Thirdly, as each of the user utilizes the complete resource block, it may transmit instantly as it requires, thereby reducing the overheads and increasing the latency. Last but not the least, other emerging techniques such as Multiple Input Multiple Output (MIMO) and millimeter waves (mmWaves) can also be combined with NOMA. A simple classification of NOMA schemes is given as shown in Figure 1 [10].

Figure 1 Classification of NOMA and similar schemes [10].
The foremost processes required in PD-NOMA are twofold, SC of the user’s signal at the transmitter, and subsequent SIC at the receiver [10]. Both of the processes assist in achieving higher capacity of the system, and are used jointly. The SC performs the vector superposition of the user’s signal constellation, and SIC helps to increase the received SNR, by the successive cancellation of the other user’s signal that is acting as source of interference to the desired user.
3 Pre-requisites
Channel Capacity: The channel capacity for an Additive White Gaussian Noise (AWGN) channel for a point to point link, is represented in [11] as
| (1) |
where, is the channel bandwidth, is the signal-to-noise-ratio (SNR), is the power constraint in watts and is the power spectral density (PSD) of Gaussian noise.
Spectral efficiency: The spectral efficiency is a measure of the supported user data rate for a given bandwidth. Thus, the maximum bound for the spectral efficiency is determined by the channel capacity, which implies the maximum rate of information transfer per unit channel bandwidth.
| (2) |
Equations (1) and (2) assume a discrete time baseband channel model described as , with as the input to the channel, being the channel output and is . For a point to point communication link, the maximum user rate for a user i, can be represented as
| (3) |
where is the SNR received at the i user, and has an upper-bound as suggested by (1) and (2).
Sum-rate: The sum-rate, i.e.., the sum of the rates of all the users in the network, is defined as
| (4) |
where, is the i user throughput or data-rate [12]. The sum-rate is also used to define the fairness index F for a network of K users as [13]. This fairness index represents a fair sharing of the system capacity between the users. The fairness index implies all the users achieving the same throughput or capacity.
4 The System Model
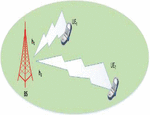
We consider a single cell two user NOMA downlink and uplink channel models in this paper. We analyse the system model of a simple NOMA network by considering a single antenna at the base station (BS) and a single receiving antenna at each of the two user-equipment (UE). In the downlink scenario, the BS antenna is transmitting a superposed signal for both user equipment and the user antenna have to decode their message from the superposed signal. For the uplink scenario, the BS receives the superposed signal of both the user equipment, and the BS has to decode the individual user’s messages from the superposed signal. In both of the scenarios, the user’s signal are weighted with different powers using different power allocation coefficients and then transmitted, as an essential condition of PD-NOMA. Based on the received signal power and interference power, the capacity-region points are deduced, after varying allocated power to the UE. After formulating the points on the capacity region, the effect of imperfect SIC process is also highlighted by considering additional interference.
4.1 Downlink NOMA Analysis
For the downlink, the BS, depending upon the individual channel gains, performs this power allocation to the UE. More power is allocated for the user with less channel gain (weaker user), and less power is allocated to the user with higher channel gain (stronger user). Further, it is assumed that the channel gain is constant over every transmission time interval (TTI), i.e., the channel gain is quasi-static. In this case, first the weaker user decodes its signal from the superposed signal. The stronger user has to decode its own signal after cancelling the weaker user signal with the SIC process. As shown in Figure 2, the NOMA cell consists of two users, at the cell-edge and around the centre of the cell. For the downlink, the BS forms the superposed signal that is to be transmitted to both of the users. This superposed signal is represented as
| (5) |
Figure 2 Single cell two-user NOMA downlink channel model.
where is the allocated power for the symbol of the i user. This superposed signal is to be received by which has the point-to-point channel gain between itself and the BS. The same superposed signal is also received by which has the point-to-point channel gain between itself and the BS. Without loss of generality, it is assumed that to designate the users as stronger user and weaker user respectively. Now, the corresponding received signal for , and for , respectively are described as
| (6) | ||
| (7) |
According to the NOMA principle, has to decode its message considering as an interference. The SINR for is then given as
| (8) |
where the noise variance is assumed to be unity.
The performs SIC by cancelling the component with from its received signal . Hence, the SNR for becomes
| (9) |
Here, we assume that the SIC operation is perfect, i.e., is able to correctly decode the message of user and then remove it perfectly. However, in imperfect SIC, also receives a component of the signal of i.e., . This increases the interference term for , and thus the SINR reduces somewhat from that given in (9) for imperfect SIC operation. In Sections 4.1 and 4.2, we assume perfect SIC, whereas in Section 4.3, we assume imperfect SIC operation.
Based on (3) and using (8), (9), the rate for can be computed as follows (assuming perfect SIC)
| (10a) | ||||
| (10b) | ||||
From these equations, it is clear that the user SINR increases as the allocated power to that user increases. For the downlink transmission, the BS allocates a limited power resource to the users, thereby placing the power constraints as and , where is the total power constraint of the BS. Considering the extreme cases, i.e., when the total power is allocated to one of the users (say ) and no power is allocated to the other user, gives the maximum achievable rate or the capacity for that user (i.e., ). Now consider the power allocation factor, as the allocated power to the user performing SIC. Hence, the power of is given as and of is . We chose the power allocation factor to be the fractional power allocated to the stronger user and varied from 0 to 1, for the two extreme cases discussed above. Hence, by varying the parameter from 0 to 1, the set of rate points are easily obtained as
| (11a) | ||||
| (11b) | ||||
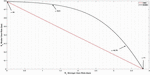
For the improvement over 4G OFDMA that is an OMA system, we consider the same scenario of two users, having weaker and stronger channels with the bandwidth allocation factor that represents the fractional bandwidth allocated to the stronger user. Unlike the power allocation factor , is selected to be 0.5 for a two user NOMA case, which implies equal bandwidth sharing between OMA users to maintain user-fairness. The capacity regions for Downlink NOMA as well as for Uplink NOMA were obtained for the downlink parameters given in [14]. The corresponding plot for the same parameters for downlink NOMA asymmetric channel is also obtained and is shown as Figure 3. Moving further, the same capacity regions and sum-rate performance of downlink NOMA for a symmetric channel are simulated and the plots are shown in Figure 4 for the sum-rate of asymmetric channel. Considering a symmetric channel for the same NOMA configuration, the rate region obtained for the downlink NOMA may be represented as in Figure 5.
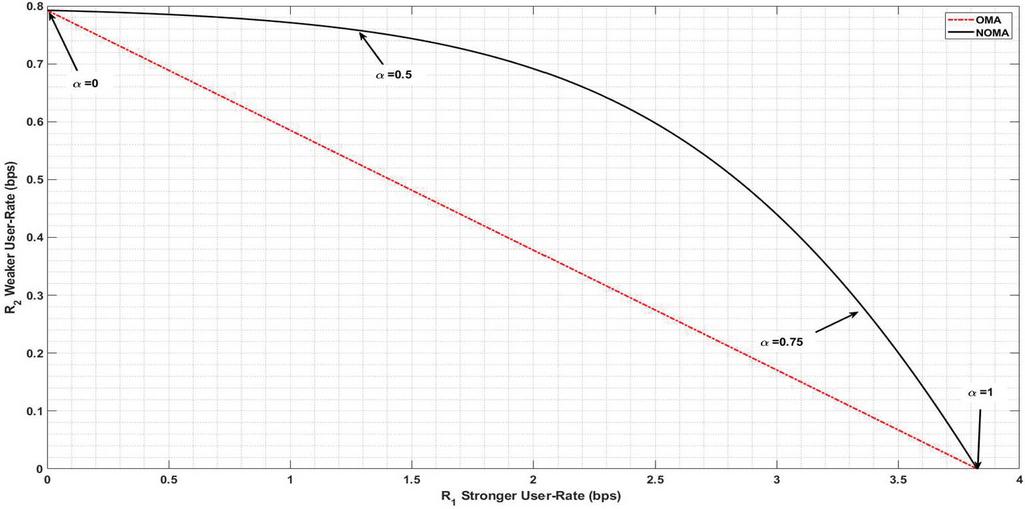
Figure 3 Capacity region plot for Downlink NOMA asymmetric channel.

Figure 4 Sum-rate plot of Downlink NOMA asymmetric channel.
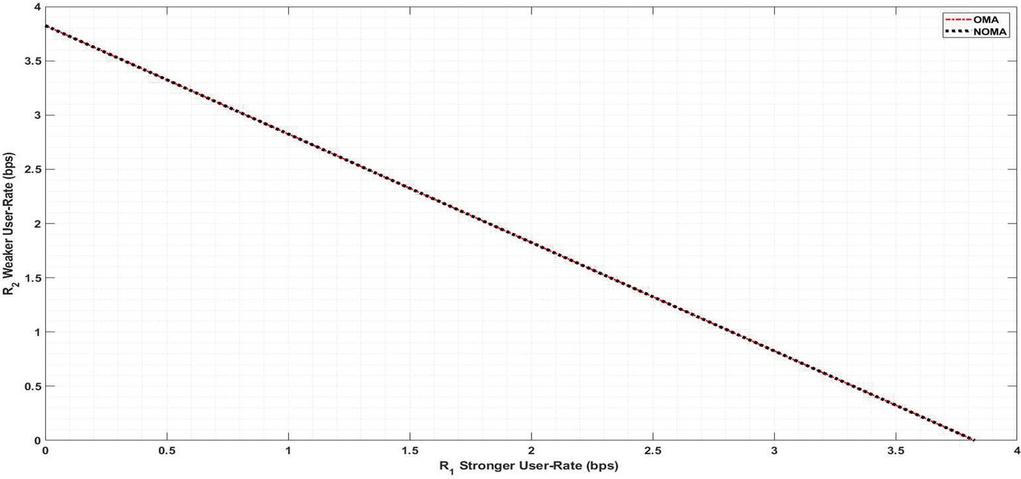
Figure 5 Rate region of Downlink NOMA symmetric channel.
4.2 Uplink NOMA Analysis
For the uplink, it is assumed that the UE’s transmit their signals with different power levels depending upon their distance from the BS and the channel conditions. More power is transmitted by the weaker user, and less power is transmitted by the stronger user. The uplink channel model for a single cell two user NOMA is shown in Figure 6. The uplink model is slightly different from the downlink NOMA model. We assume the channel is quasi-static, similar to the case of downlink scenario. For the uplink model, the BS receives the superposed signal of the users as
| (12) |

Figure 6 Single cell two-user NOMA uplink channel model.
This superposed signal consists of signal and signal , and the AWGN noise is specified as . Without the loss of generality, again we assume that , where is the channel gain for and is Gaussian noise with unity variance.
According to the NOMA principle, the BS has to decode one of the user’s signal first, treating the other user’s signal as interference. Then the BS cancels the earlier decoded signal from the superposed signal (using SIC) to decode the other user’s signal. Hence there are two possibilities, first is that the BS decodes , cancels signal from the superposed signal and then decodes signal. The second possibility is interchanging the user order, i.e., start with the decoding of , followed by cancellation of signal from the superposed signal and finally decoding signal. According to the first possibility, the SINR for may be given as
| (13) |
where the noise variance is assumed unity. Following the SIC of , the SNR for thus becomes
| (14) |
Based on (3) and using (13), (14), the rate for can be computed as following
| (15a) | ||||
| (15b) | ||||
In the OMA case as seen earlier, the rate region is a straight-line segment joining the extreme points. We designate the point on the rate-axis and the point on the rate-axis for this purpose. Moreover, this straight-line segment on the plane has a slope of . It is interesting to observe from (15a) and (15b), if , the point B becomes (0,0) and point A attains a maximum . Also notice that if , then the same points A and B are achieved and . Similarly, implies the point A becomes (0,0) and point B attains a maximum . Notice again, if , then the same points A and B are achieved as . Hence, we conclude the order of SIC is important for the capacity region analysis. So, for the determination of capacity-region of NOMA, we consider both the decoding and SIC ordering possibilities.
First, we consider the case when the sequence of detection as follows: decoding of signal, followed by cancellation of signal from the superposed signal (to decode signal). We consider a point as C on the capacity plane, having the coordinates of achievable rate-pair . For the decoding and cancellation sequence considered above, the rate- pair is given as
| (16) | ||
| (17) |
For the other decoding-cancellation sequence, we define another point D on the capacity plane, having the coordinates
| (18) | ||
| (19) |
Finally, we have 4 set of points on the capacity plane, given as:
| (20) | |
| (21) | |
| (22) | |
| (23) |
To determine the effect of power allocation on the capacity region that is defined by (20)–(23), we again employ a power allocation factor , such that .
The above capacity region points ABCD can then be expressed as:
| (24) | |
| (25) | |
| (26) | |
| (27) |
Finally, putting the values of various parameters from [14], and varying ’ from 0 to 1, the characteristics of the capacity region may be deduced. Figure 7 shows the obtained capacity region for a symmetric channel.

Figure 7 Capacity region for Uplink NOMA for symmetric channel .

Figure 8 Variation of capacity-region points with power allocation factor.
As seen from Figure 7, we observe that the maximum permissible user-throughput achieved in NOMA uplink in a symmetric channel is less than the maximum permissible user-throughput achieved in OMA.
Figure 8 shows the variation of the points ABCD, and from here the symmetric capacity can be derived. This symmetric capacity is the common maximum rate at which the user’s can transmit. In Figure 8, this symmetric capacity is given by the intersection of the locus of points C and D.
4.3 Downlink NOMA Analysis with Imperfect SIC
Next, for the analysis of rate-region with error propgation due to imperfect SIC by the stronger user in the downlink NOMA, we resort to the model as shown in Figure 2 earlier. In this case, has to perform the SIC operation to cancel out the signal of .
The SNR for is then given as in (8), and for is given as in (9) provided carries out the SIC operation perfectly. From (6) and (7), we easily determine that a fraction will be acting as an interference to ’s signal under such imperfect SIC. Here, is a constant that represents the fraction of the power in the component of ’s signal that is leaking into ’s signal. The resulting signal for can then be determined as
| (28) |
Clearly in this case, the SINR is
| (29) |
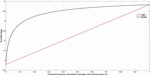
Hence, the SNR reduces from that given in (9) to that given in (29). This also reduces the capacity as described in (3). It is also observed that (29) reduces to (9) when . A plot of the throughput reduction with different values of is given in Figure 9.
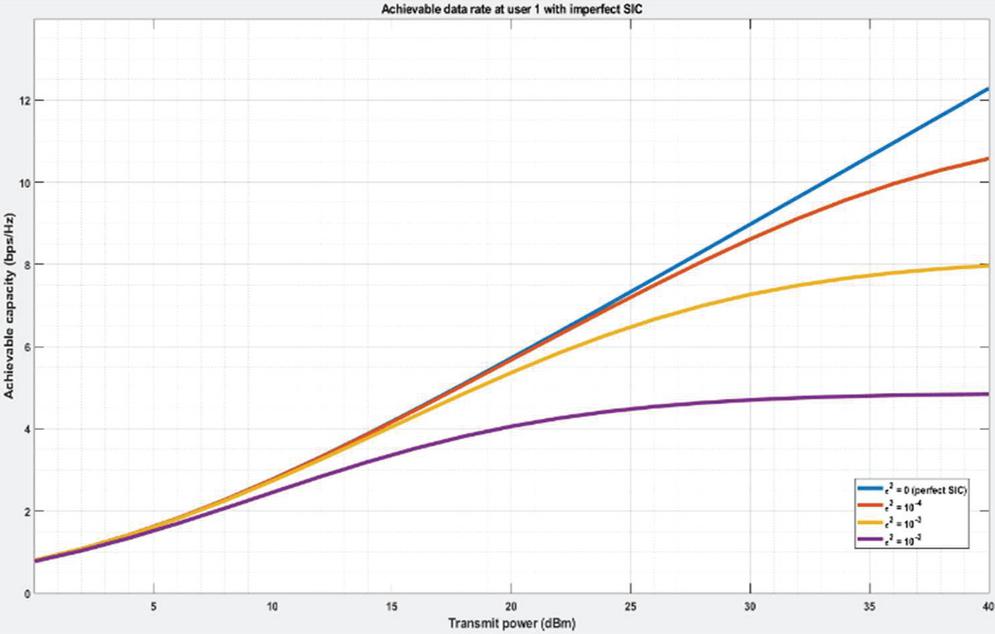
Figure 9 Achievable throughput for imperfect SIC by .
5 Simulation and Interpretation of Results
The simulation for the analysis was carried out in MATLAB 9.6.0.1214997 (R2019a) Update 6 on a windows operating system with Intel i-7 dual-core processor@ 2.2 GHz and 16 GB installed RAM. For the simulation of the two user NOMA cell (downlink) , the channel gain for user and for user were selected to be and , for asymmetric channel, and the power constraint 40. These values were taken from [14]. The obtained results alongwith the imperfect SIC results can be grouped into three categories-asymmetric channel, symmetric channel, and downlink NOMA analysis with imperfect SIC.
5.1 Asymmetric Channel
For the asymmtric channel, we assumed unequal channel gains and . The user-rate obtained for the downlink case are shown in Figure 3, with the dashed-red line representing the achievable user-rate for the two user OMA network, and the solid-black line representing the NOMA network. Both the curves meet at the power allocation factor values of 0 and 1 which shows the single-user maximum rate is the same for both OMA and NOMA networks. However, between these two extreme values (0 and 1), the NOMA network shows significant rate-increase. As user is stronger user, therefore the SIC has to be done by and simply decodes its own data without SIC. As we can see from Figure 3, allocation of more power to the stronger user reduces the user-rate of weaker user. This happens when the power allocation factor is increased towards unity. Further, Figure 3 also shows the achievable rate when OMA is used. We considered equal bandwidth and equal power allocated to both the users in OMA, so as to maintain the fairness in the system. The comparion of the curves indicate the superiority of NOMA over OMA in downlink scenario with different channel gains. Now, if large power is allocated to the stronger user, then the weaker user rate approaches zero. Hence, in this scenario, the weaker user should be allocated higher power.
Figure 4 shows the variation of sum-rate with the power allocation factor, which again confirms that both the networks have the same sum-rate at the extreme values of power allocation factor. However, allocating a large power to the stronger user does not vary the sum-rate significantly, whereas allocating less power to the stronger user varies the sum-rate significantly , that can be observed by the larger slope of the NOMA curve in Figure 4.
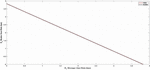
5.2 Symmetric Channel
For the symmtric channel, we assume equal channel gains and . The user-rates obtained for the downlink case are shown in Figure 5, with the red line representing the achievable user-rate for the two user OMA network, and the black line representing the NOMA network. This suggests that under the same channel conditions, both the networks have same rate-regions, thus have a similar performance. Hence, the performance is NOMA is not inferior to OMA even under symmetric channel case. For the uplink scenario the same channel gains were assumed as for the downlink, and the results are plotted in Figures 7 and 8. For the symmetric channel, it was observed that the optimum rate region points, i.e., points C and D require a specific range of power allocation factor to maintain the given quality of service to the users. Hence based on these curves, an optimum range of power allocation factor could be decided for required guaranteed quality of service to the users. Further, even for the symmetric channel conditions, the rates offered are much higher than the CDMA scheme. Finally, Figure 8 shows the variation of the points ABCD of the capacity region with the power allocation factor. The locii of these points would help in the visualization of the capacity region for the symmetric case.
5.3 Downlink NOMA Analysis with Imperfect SIC
Figure 9 shows the effect of improper SIC by stronger user on its throughput. It is seen that as the transmit power to the user increases, the user capacity first increases, then saturates to a maximum. Also, at a given fixed transmit power, maximum network capacity is obtained when the SIC process is perfect. As we can see from Figure 9, at a transmit power of 40 dBm, the saturation level is at 4.84 bps/Hz for , and a capacity of more than 12 bps/Hz is obtained with perfect SIC.
6 Conclusion
In this paper, the channel capacities for symmetric and asymmetric NOMA networks have been evaluated for both the uplink and downlink scenarios. The performance measure of user spectral efficiency and the sum-rate bounds, for the NOMA and the existing OMA networks have been compared. It is observed that NOMA is much more efficient than the 4G multiple access techniques for asymmetric channels. Even for the symmetric channels, NOMA is comparable with the OMA techniques in terms of the spectral efficiency. Furthermore, with the analysis of user rate and capacity of NOMA network carried out, it is observed that the NOMA capacity region varies as a function of the power allocation factor. The NOMA performance with imperfect decoding is also analysed for the downlink. The simulated results show that there is a reduction in the spectral efficiency of the network with increasing . It is also concluded that inspite of the achievable throughput reduction by imperfect SIC operation, increasing the transmit power increases the capacity of the NOMA network.
Hence, it can be concluded that NOMA is plausibly one of the best candidate multiple access scheme for future mobile networks. Future scope in the area can be the analysis of multiuser NOMA network, and the choice of optimum power allocation coefficients for the multiuser network.
References
[1] “Internet of Things forecast,” Ericsson, 2019. [Online]. Available: https://www.ericsson.com/en/mobility-report/internet-of-things-forecast.
[2] Rachid El Hattachi; Javan Erfanian, “NGMN 5G White Paper,” NGMN, 2015.
[3] E. Mohyeldin, “Minimum Technical Performance Requirements for IMT-2020 Radio Interface(s),” NOKIA, 2017.
[4] S. Kumar, Wireless Communication: The Fundamental & Advanced Concepts, River Publishers, Denmark , 2015.
[5] M. Aldababsa, M. Toka, S. Gokceli, G. K. Kurt and O. Kucur, “A tutorial on Nonorthogonal Multiple Access for 5G and Beyond,” Wireless Communications and Mobile Computing, vol. 2018, pp. 1–24, 2018.
[6] M. Vaezi, Z. Ding and H. V. Poor, Eds., Multiple Access Techniques for 5G Wireless Networks and Beyond, Springer , 2019.
[7] K. Huguchi and Anas Benjebbour, “Non-orthogonal Multiple Access (NOMA) with Successive Interference Cancellation for Future Radio Access,” IEICE Transactions on Communication, Vols. E-98, no. 3, 2015.
[8] Q. C. Li, H. Niu, A. Papathanassiou and G. Wu, “5G network capacity: Key elements and technologies,” IEEE Vehicular Technology, vol. 9, no. 1, pp. 71–78, 2014.
[9] L. Dai, B. Wang, Y. Yuan, S. Han, C.-L. I and Z. Wang, “Non-orthogonal multiple access for 5G: solutions, challenges, opportunities, and future research trends,” IEEE Communications, vol. 53, no. 9, pp. 74–81, 2015.
[10] S. M. R. Islam, N. Avazov, O. A. Dobre and K.-S. Kwak, “Power-Domain Non-Orthogonal Multiple Access (NOMA) in 5G Systems: Potentials and Challenges,” IEEE Communication Surveys and Tutorials, vol. 19, no. 2, pp. 721–741, 2017.
[11] D. Tse and P. Viswanath, Fundamentals of Wireless Communications, Cambridge University Press, 2005.
[12] R. C. Kizilirmak, “Non-Orthogonal Multiple Access (NOMA) for 5G Networks,” in Towards 5G Wireless Networks: A physical layer perspective, Intech Open, 2016, pp. 83–98.
[13] C. Xiong, G. Li, S. Zhang, Y. Chen and S. Xu, “Energy and Spectral Efficiency Tradeoff in Downlink OFDMA networks,” IEEE Transactions on Wireless Communications, vol. 10, no. 11, pp. 3874–3886, 2011.
[14] M. Vaezi, R. Schober, Z. Ding and H. Poor, “Non-orthogonal Multiple Access: Common Myths and Critical Questions,” IEEE Wireless Communications, vol. 26, no. 5, pp. 174–180, 2019.
Biographies

Saurabh Srivastava is a Ph.D. student at the Birla Institute of Technology, Mesra, India since spring 2018. He received his B.Tech. in Electronics and Communication Engineering in 2002. He completed his M.Tech. in Electronics and Communication Engineering from National Institute of Technology, Kurukshetra, India in 2006. He has a teaching experience of over 11 years. He, as a faculty member and researcher, has authored in various conferences and national/international journals. Srivastava is currently completing his doctorate in Electronics and Communications at the Birla Institute of Technology. His Ph.D. work centres on Non-Orthogonal Multiple Access and discusses the future multiple access schemes for the next generation wireless networks.

Prajna Parimita Dash earned her PhD degree from the Department of Electrical Engineering, NIT Rourkela, India in the year 2017. She is currently working as an Assistant Professor in the Dept. of Electronics and Communication Engineering of Birla Institute of Technology, Mesra, Ranchi, India. Her research interest includes Computer Vision, Image Processing, Signal Processing and Wireless communication. She has co-authored a number of research articles in various prestigious journals, conferences, and book chapters.

Sanjay Kumar has received MBA from Pune University in 1994, M. Tech. in Electronics and Communication Engineering from Guru Nanak Dev Engineering College, Ludhiana in 2000, and PhD in Wireless Communication from Aalborg University, Denmark in 2009. He is an Associate Professor at the Department of Electronics and Communications Engineering at Birla Institute of Technology Mesra, Deoghar Campus, India. During 2006 to 2009 he was a Guest Researcher at Aalborg University, Denmark, where he worked in close association with Nokia Siemens Networks. During 2007 to 2008 he worked as Part-time Lecturer in department of Electronic Systems, Aalborg University, Denmark. Before joining teaching and research he served the Indian Air Force from 1985 to 2000 in various technical capacities. He has nearly 35 years of teaching, research and work experience in the field of Wireless Communication. He is an Editorial Board Member of the International Journal, “Wireless Personal Communications” published by Springer.
Journal of Mobile Multimedia, Vol. 17_1-3, 385–406.
doi: 10.13052/jmm1550-4646.171320
© 2020 River Publishers