Study of Indoor Small Cell Deployments
Rui R. Paulo*, Fernando J. Velez and Bahram Khan
Instituto de Telecomunicações and Universidade da Beira Interior, Covilhã, Portugal
E-mail: rrp@lx.it.pt; fjv@ubi.pt; bahram.khan@lx.it.pt
*Corresponding Author
Received 18 September 2020; Accepted 30 November 2020; Publication 26 January 2021
Abstract
This work aims at studying the indoor deployment of small cells, also known as femtocells, to provide coverage to a grid geometry. The number of deployed HeNBs is 4, 5, or 6. An updated version of LTE-Sim is considered to extract values for Exponential Effective SINR Mapping (EESM), Packet Loss Ratio (PLR), maximum number of supported users, goodput and delay. Results reveal that the use of four HeNBs corresponds to the highest values of EESM. For the considered geometry, 3GPP suggested a maximum of five HeNBs. However, this deployment shows worser performance compared to the topology with four HeNBs. The geometry with six HeNBs is the one with the best overall performance results for the grid of apartments.
Keywords: Small cells, femtocells, HeNBs, EESM, LTE-Sim, goodput, packet loss ratio, HeNBs deployment ratio, saturation.
1 Introduction
Home eNodeBs (HeNBs) are deployed to provide coverage within cells with coverage areas smaller than macro base stations (eNBs). Its use is one of the best ways to improve capacity and service quality [1]. These HeNBs are the central nodes of small cells with short coverage range, and are deployed to provide indoor coverage. Environments include houses, shopping centres, offices, underground floors or places where the coverage from outdoor cells is weak or even non-existing [2, 3]. Most of the times, the deployment of HeNBs by mobile network consumers is not coordinated [4].
This work explores the possibility of deploying HeNBs in a coordinate way, as shown in Figure 1. 3GPP defines deployment ratio in [5]. This metric defines if a HeNB is deployed or not on each apartment and varies from zero to one. On the one hand, if the deployment ratio is zero there are not active HeNBs. On the other, if the deployment ratio is one all 25 HeNBs will be active. For an urban-dense HeNB deployment, 3GPP suggested 0.2 for the deployment ratio. This corresponds to having five HeNBs deployed in apartments grid, as presented in Figure 1(b).
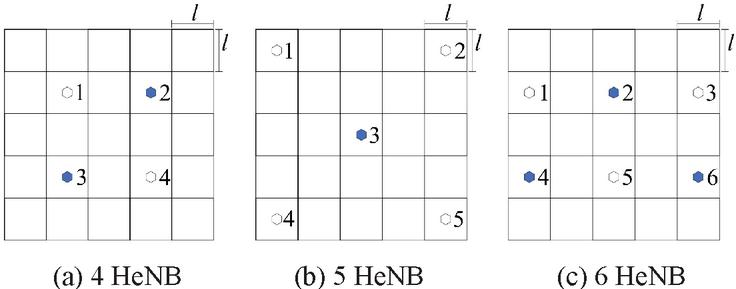
Figure 1 Considered pattern for the deployment of HeNBs to cover a given floor area.
Figure 1(a) shows a topology with four HeNBs and deployment ratio 0.16. In the topology from Figure 1(c) has got six active HeNBs and correspond to a deployment ratio of 0.24. Differently from other works, in this work, we randomly deployed users on the floor building. Each user connects to the HeNB that serves it with the highest received transmitter power. This approach produces an unbalanced operation in terms of the number of users per cell. This means each HeNB will serve a different number of users.
The remaining of this paper is organized as follows. Section 2 studies the Exponential Effective SINR Mapping (EESM) for the proposed HeNB deployments. Differently from earlier works [6–8], where a theoretical study of the Signal-to-Interference-plus-Noise Ratio (SINR) was made, here a simulation approach and LTE-Sim [9] have been adopted. The simulator has been updated to extract EESM for different deployment scenarios in a building. Section 3 presents results for the number of users and supported goodput in each deployment scenario. The supported throughput has been determined by considering a maximum threshold of 2% for the Packet Loss Ratio (PLR) [10], while considering video and Best Effort (BE) applications. Finally, conclusions are drawn in Section 4.
2 Exponential Effective SINR Mapping Study
2.1 Signal-to-Interference-plus-Noise Ratio
For each sub-carrier, the SINR of a UE, at a position with (x,y) coordinates, served by a cell and under the interference of the remaining cells, is given as follows,
| (1) |
Considering that all cells operate with the same transmitter power, P, the received power from the own cell is defined by P. P, in dBW, is the thermal noise power. P is the total amount of interfering power coming from the N neighbour cells. P and P are determined by considering the underlying path loss model. Although the path loss model recommended in [5] avoids modelling any walls, the WINNER II path loss model [11], adopted in this work, considers the existence of walls. For an indoor office, the WINNER II stands as follows
| (2) |
where d is the distance between transmitter and receiver. f is the system frequency in GHz, the fitting parameter A includes the path loss exponent. Parameter B is the intercept, parameter C describes the path loss frequency dependence, and X is environment-specific term (e.g., wall attenuation in the NLoS scenario). Authors from [7, 8, 11] present more details on the model.
To obtain values for the Exponential Effective SINR Mapping (EESM) we used LTE-Sim [9]. Although authors from [6, 7], introduced improvements in the simulator in this study we made new major updates to the simulator. With these updates, it becomes possible to extract SINR results for a building with a 3GPP grid geometry. Hence, with this version of the simulator, it is possible to make a scenario with any value for the deployment ratio and to deploy HeNBs in the desired apartment from Figure 1. Table 1 presents details on the simulation parameters.
Table 1 EESM simulation parameters
| Parameters | |
| Frame structure | FDD |
| CQI | Periodic |
| Number of HeNBs | 4, 5, 6 |
| HeNB cluster | 2 |
| HeNB Bandwidth | 10 MHz + 10 MHz |
| Access policy | Open |
| Power of HeNB | 0, 10, 20 dBm |
| User speed | 0 km/h |
| Number of buildings | 1 |
| Number of floors | 1 |
| Geometry of buildings | 3GPP grid |
| Apartment side | 5, 10, 15, 20 m |
| Path loss model | WINNER II |
| Scheduler | Frame Level Scheduler |
In [5], 3GPP presents two geometries for a dense HeNB deployment. A dual stripe model composed by two stripes of apartments with a street/road in between the two stripes of apartments. This ensures that different femtocell blocks are not too close to each other. The other alternative HeNB cluster model is the grid geometry. In this geometry 25 apartments are considered in each single floor building, which increases the probability of having more HeNBs per square meter.
2.2 Results for Exponential Effective SINR Mapping
Multi SINR values, each one for each sub-carrier, can be compressed to only a single scalar value. According to [12], this concept is called Effective SINR Mapping. In this work, we have considered the Exponential Effective SINR Mapping (EESM) [13].
All combinations of parameters presented in Table 1 have been considered. However, only the cases in Figures 2 and 3 are addressed here. Figure 2 presents the case where only four HeNBs are considered. In Figure 2(a), the apartment side is 5 m and transmitter power is 0 dBm. The central area (that matches the central area of the building) presents the lowest EESM. In the edge of this zone, the EESM drops from 40 dB (in yellow) to 8 dB (in blue). This area, with lower EESM, corresponds to 5.76% of the total area of the building floor. Figure 2(b) considers the same transmitter power but apartment side is 20 m. In both cases, it is possible to observe the effect of the walls attenuation. This effect is more visible when the apartment side is 20 m. One way to overcome the effect of walls and to avoid areas with lower EESM values is to consider higher transmitter powers.

Figure 2 EESM results considering 4 HeNBs, different apartment sides and varying transmitter power.
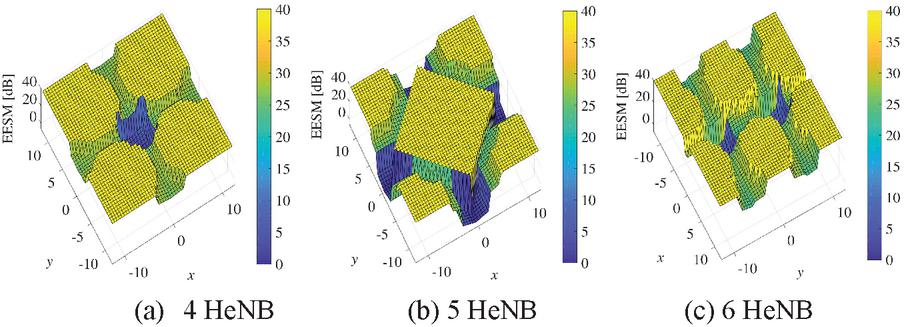
Figure 3 EESM results considering a transmitter power of 20 dBm and apartment side 5 m.
Figure 2(c) presents the results for apartment sides of 20 m and transmitter power of 20 dBm. In some areas, the increase of the transmitter power compensates the effect of attenuation from the walls. Nevertheless, the central area of the building floor keeps being a problematic area. In the remaining area, the EESM is always higher than 25 dB. By analysing different scenarios, we have concluded that for increased values of the transmitter power, corresponding EESM is always 40 dB in the entire floor. If the transmitter power increases, the interfering transmitter power coming from the neighbour HeNBs will also increase. These effects are also visible in Figure 3(a).
The increase of transmitter power allowed for having a wider area with EESM of 40 dB. However, around these areas the EESM is lower because of the interference. The central area of the floor has EESM near 1 dB. This area corresponds to 5.76% of the total area of the building floor.
To fill/cover this area, the approach was to add one extra HeNB to the floor, as shown in Figure 1(b). The coverage from the HeNB in the centre eliminates the area that presents lower values for the EESM, as shown in Figure 3(b). HeNBs in the corners maintain the EESM at the same level. However, in areas near the middle of the building side walls, the EESM drops to values lower than 0 dB. The sum of these areas is around 7.2% of the total area of the building. Figure 3(c) presents results for six HeNBs (as shown Figure 1(c)). This Figure also shows two areas where the EESM is near 1 dB. These two areas correspond to approximately 10.4% of the total area of the building floor.
When the transmitter power is 20 dBm, it is possible to have wider areas where the EESM achieves its maximum value. With four HeNBs, the area with lower EESM is the same for any combination of apartment side and transmitter power. When more HeNBs are added to the floor, the total area with low values of EESM increases, from 5.76% with four HeNBs, to 7.2% with five HeNBs, and to 10.4%, with six HeNBs. With this area occupation, better results are expected for the supported users and capacity for four HeNBs. Less supported users are supported for five HeNBs while the worst case occurs for six HeNBs.
3 Study of Maximum Capacity in Saturation Conditions
3.1 Assumptions
To study the maximum capacity for the presented scenarios, we add the parameters from Table 2 to the parameters from Table 1. The building is in an area with a radius of 80% of the macrocell radius. The macrocell eNB operates with 20 MHz bandwidth. HeNBs operate with reuse pattern two; the 20 MHz bandwidth is divided into two equal parts of 10 MHz [7, 8]. One part of the radio spectrum is used by HeNBs represented in Figure 1 with white fill, while the other HeNBs use the remaining 10 MHz, represented with light-blue fill in Figure 1.
The considered applications are the same as presented in [7] and [8]. A video trace encoded at 440 kb/s [14] and a Best Effort (BE) application [15] are considered.
Table 2 Simulation parameters
| Parameters | |
| Simulation duration | 30 s |
| Flow duration | 20 s |
| Number of eNB | 1 |
| eNB cell radius | 1 km |
| eNB Bandwidth | 20 MHz |
| User position | Random |
| Application type | Video and Best Effort |
| Video bit rates | 440 kb/s |
| Maximum delay | 0.1 s |
| Building position | Random |
| Scheduler | Frame Level Scheduler |
| Number of simulations | 50 |
Network simulators such as LTE-Sim allocate a predetermined number of users per HeNB. This means that every HeNB in a simulation has the same number of femtocell users. With this choice, the system is balanced. Since this work tries to extract the maximum number of users supported by a given number of femtocells in a building floor, we have abandoned this approach. The newly implemented approach is to assign a pre-determined number of users to the floor. Hence, users in the building floor, and each user will connect to the HeNB that serves it with the high received transmitter power. Although the building can be located near the eNB and, in this case, users can receive the highest transmitter power from it, this version of LTE-Sim does not allow them for connecting to the eNB. Users only connect to HeNBs. Besides, deploying users by considering a random uniform distribution of users does not mean that simulations exactly distribute the same number of users per HeNB.
3.2 Packet Loss Ratio
To extract the maximum system capacity for these deployment scenarios, the first step is to obtain the Packet Loss Ratio (PLR). PLR is the ratio between the total number of packets that cannot reach their destination and the total transmitted packets. In [10], 3GPP defines a threshold of PLR 2% for video. We have extracted results for all combinations of transmitter power of HeNBs (0, 10 and 20 dBm) and apartment sides (5, 10, 15 and 20 m). Although all combinations of transmitter power and apartment sides were simulated, only the results from Figure 4 (for apartment sides of 5 and 20 m) are presented. The Frame Level Scheduler (FLS) is considered.
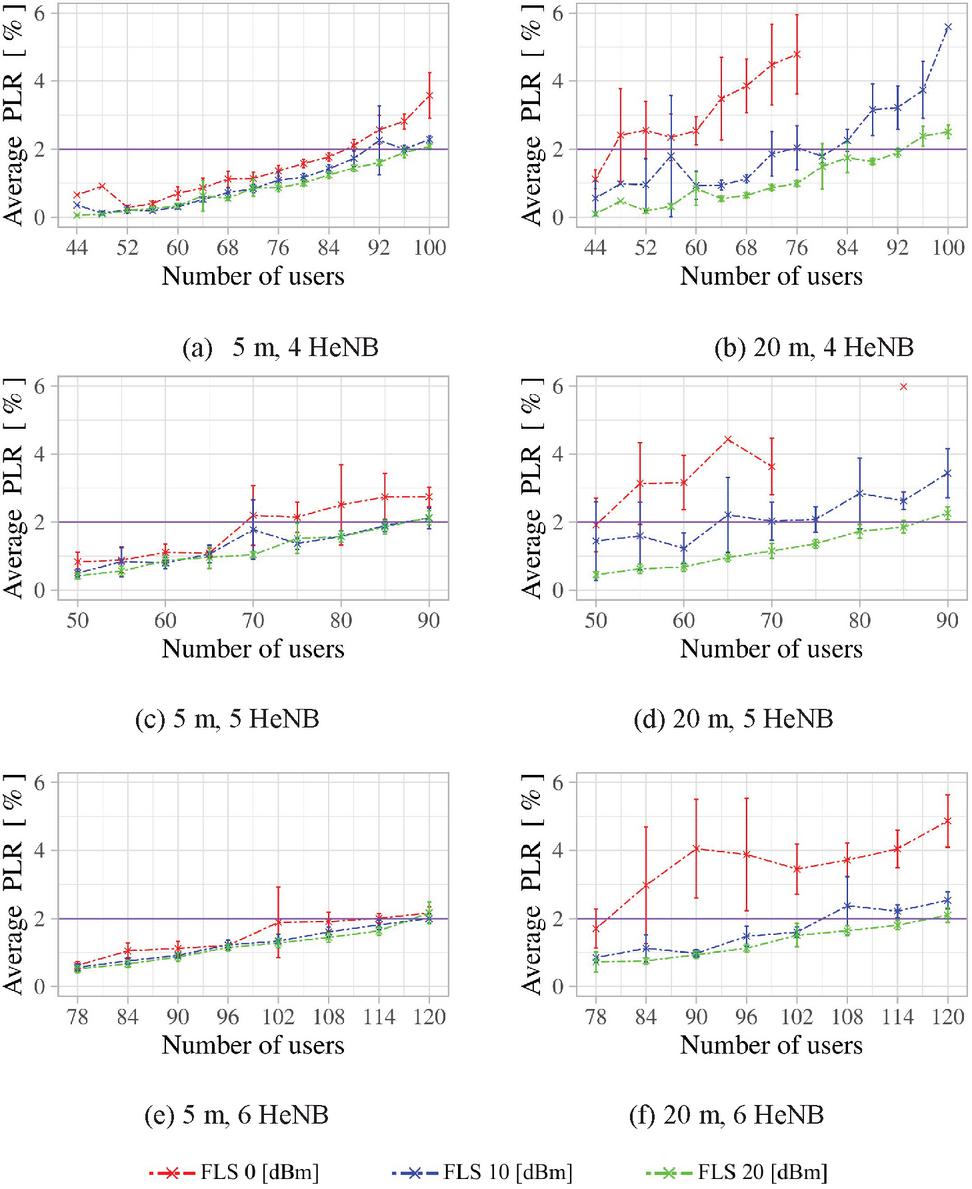
Figure 4 Average Packet Loss Ratio for Video, for different apartment sides and transmitter powers.
Figures 4(a), 4(c) and 4(e) present results for an apartment side of 5 m for all the considered values of the transmitter power (0, 10 and 20 dBm). In all cases, the variation of the PLR is near no matter the values of the transmitter power. When 20 m apartment side is considered, as shown in Figures 4(b), 4(d) and 4(f) and the transmitter power is 0 dBm, the PLR increases more rapidly than for the other values of the transmitter power. With five HeNBs, Figure 4(d) shows that with a transmitter power of 10 dBm the threshold of 2% is achieved for a lower number of users than in the other two scenarios Figures 4(b) and 4(f).
95% confidence intervals have been considered. Very large values of these intervals imply that more simulations need to be performed [16]. Another approach consists of identifying outliers [17] while analyzing and treating data [16]. In this work, none of these solutions are needed. Large values for the confidence intervals mean that, with apartment sides of 20 m and transmitter power of 0 dBm, HeNBs cannot offer enough resources to that set of users. The impact of lack of resources can be reduced by increasing the transmitter to 10 dBm. Hence, the negative impact of the lack of resources diminishes when the transmitter power is 20 dBm.
Another cause for the lack of resources can be the probability of deploying a larger share of users in the areas with lower EESM identified in Section 2.2. Deploying a determined number of users on the floor (and not per HeNB) creates, in most of the simulations, an unbalanced number of users per HeNB. This means that, sometimes, most of the users are concentrated in few HeNBs whilst leaving the remaining HeNBs with fewer users. Both cases could be misunderstood as outliers during the statistical analysis.
3.3 Maximum Number of Supported Users
Table 3 presents the maximum number of supported users for video application and a PLR threshold of 2%. Simulations have been performed by considering the variation of a predetermined number of users per HeNB. The number of users per HeNB has been increased until the PLR threshold of 2% has been surpassed.
Table 3 Maximum number of users served by each configuration for a PLR threshold of 2%
| Max. number of users | Transmitter Power [dBm] | |||||||||
| 0 | 10 | 20 | ||||||||
| Number of HeNBs | 4 | 5 | 6 | 4 | 5 | 6 | 4 | 5 | 6 | |
| Side [m] | 5 | 84 | 65 | 108 | 88 | 85 | 114 | 96 | 85 | 114 |
| 10 | 72 | 60 | 96 | 88 | 80 | 108 | 96 | 85 | 108 | |
| 15 | 56 | 55 | 90 | 84 | 70 | 108 | 92 | 85 | 114 | |
| 20 | 44 | 50 | 78 | 80 | 60 | 102 | 92 | 85 | 114 | |
By considering the results from Section 2.2, we could expect that more users would be supported in each floor with four HeNBs than with five or six HeNBs. Although by deploying six HeNBs lower EESM is achieved, the number of available HeNBs (an excess of two) and the spatial distribution of users allows for getting more resources to support more traffic data. A different behavior occurs for the topology with five HeNBs, as the maximum number of supported users is lower than with four HeNBs. The only exception to this behaviour occurs when the transmitter power is 0 dBm and the apartment side is 20 m.
3.4 Supported Goodput for Video
Goodput is the sum of bits correctly received by users divided by flow time. The supported goodput for the video application when four HeNBs are considered is presented in Figure 5. The maximum goodput obtained when the transmitter power is 20 dBm and the apartment side varies from 5 up to 10 m, is 28.5 Mb/s. Out of this combination, the goodput decreases more to 13.2 Mb/s when the combination converges to a transmitter power of 0 dBm and apartment side of 20 m.

Figure 5 Average Goodput for Video with 4 HeNBs.
Figure 6 presents results for five HeNBs. With this number of HeNBs, worst results are got than the previous case. The maximum goodput of 25.3 Mb/s was obtained with a transmitter power between 20 and 10 dBm and apartment side of 5 m. The lowest value for the goodput (14.9 Mb/s) was also got for a transmitter power of 0 dBm and an apartment side of 20 m.
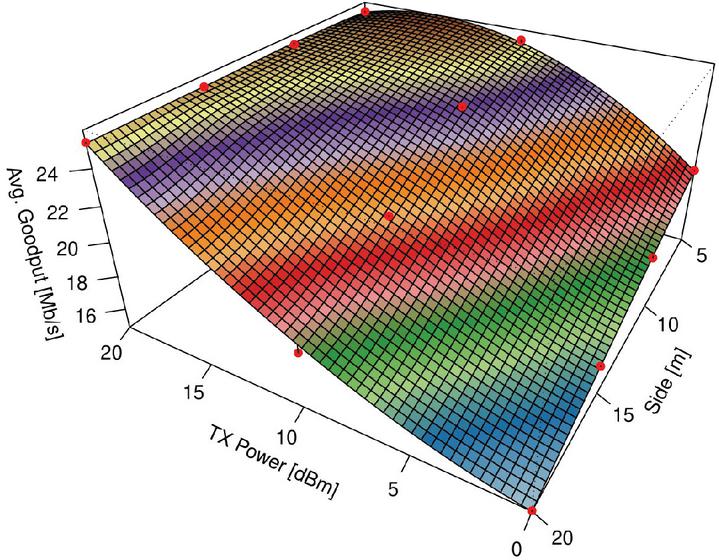
Figure 6 Average Goodput for Video with 5 HeNBs.
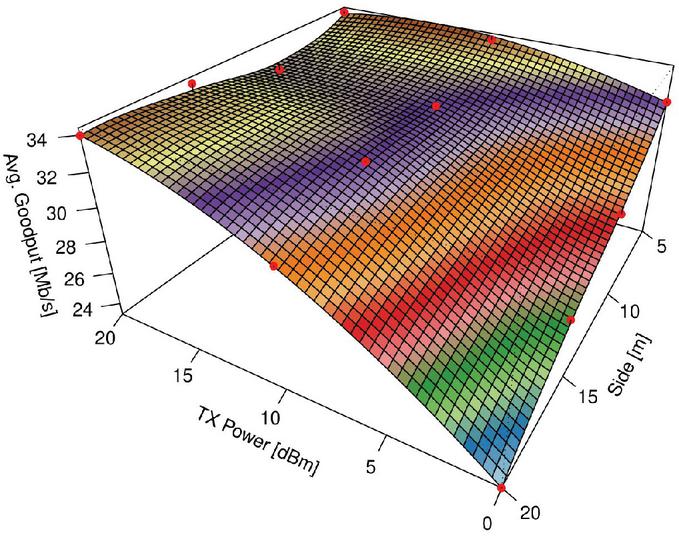
Figure 7 Maximum Average Goodput for Video with 6 HeNBs.
When six HeNBs are considered, the goodput shown in Figure 7 is higher than the throughput for four or five HeNBs per floor. The maximum goodput is 34 Mb/s and is achieved for a transmitter power of 20 dBm when the apartment side is 5 m. Also, when the side is 5 m and transmitter power is 10 dBm, the goodput is near the maximum. The topology with six HeNBs is also not able to deal with the longer apartment side of 20 m and the lower transmitter power of 0 dBm. In this case, the average goodput is 23.3 Mb/s (higher than in the other two options, with four or five HeNB).
3.5 Supported Goodput for BE and Delay for Video
The higher maximum goodput for BE application is 140 Mb/s, with 78 users, and was got in the scenario with six HeNBs. The lowest value is around 48 Mb/s and was got with four HeNBs and 92 users. In none of the simulations, we exceeded the maximum 3GPP limit of 150 ms for the maximum delay for video.
4 Conclusion
This work has studied the impact of considering the deployment of four to six HeNBs in a scenario of 3GPP grid geometry. The impact of independent variations of the transmitter power of HeNBs (from 0 to 20 dBm) and the apartment side (from 5 to 20 m) was analyzed in saturation conditions.
This work also introduces corrections and major updates to LTE-Sim [18]. The major update is to allow for considering any deployment ratio for the HeNBs. To test the impact of a different number of deployed HeNBs, an analysis of the Exponential Effective SINR Mapping was conducted. A scenario with four HeNBs provides extra coverage area with higher SINR than the scenario with five HeNBs only, whereas the scenario with six HeNBS has achieved even worst results.
By considering a PLR threshold of 2%, results for variation of the maximum number of supported users and goodput have been obtained for the video and BE applications. As the number is higher, the scenario with six HeNBs enables to achieve enhanced performance (34 Mb/s against 28.5 Mb/s with four HeNBs and 25.3 Mb/s with five HeNBs). While six HeNBs provide higher capacity, a scenario with four HeNBs enables better coverage.
With the considered scenario and simulation parameters, this work shows to future practitioners looking at deployment scenarios, that the 3GPP appointed deployment ratio is not the optimal choice. In terms of coverage area with higher SINR or even in terms of capacity. Other deployment geometries probably could present a similar behavior of the topologies considered in this work. We have also concluded that the maximum number of HeNBs suggested by 3GPP is not the best choice for HeNB deployment.
Acknowledgements
This work was supported by FCT/MCTES through national funds and when applicable co-funded EU funds under the project UIDB/50008/2020, COST CA 15104 IRACON, ORCIP (22141-01/SAICT/2016), TeamUp5G and CONQUEST (CMU/ECE/0030/2017). TeamUp5G project has received funding from the European Union’s Horizon 2020 research and innovation programme under the Marie Skłodowska-Curie project number 813391.
References
[1] W. Webb. Wireless communications: The future. Wiley, 2007.
[2] I. Ashraf, H. Claussen, and L. T. W. Ho. Distributed Radio Coverage Optimization in Enterprise Femtocell Networks. In 2010 IEEE International Conference on Communications, pages 1–6, May 2010.
[3] Y. Li and Z. Feng. Enterprise femtocell network optimization based on neural network modeling. In 2011 IEEE Consumer Communications and Networking Conference (CCNC), pages 1130–1131, Jan 2011.
[4] H. Zhang, C. Jiang, N. C. Beaulieu, X. Chu, X. Wen, and M. Tao. Resource Allocation in Spectrum-Sharing OFDMA Femtocells With Heterogeneous Services. IEEE Transactions on Communications, 62(7):2366–2377, July 2014.
[5] 3GPP TSG-RAN4#51, Alcatel-Lucent, picoChip Designs, and Vodafone. R4-092042, Simulation assumptions and parameters for FDD HeNB RF requirements. May 2009.
[6] R. R. Paulo and F. J. Velez. A study on system capacity for HeNBs with different schedulers. In Conf. on Telecommunications – ConfTele, pages 25–28, June 2019.
[7] R. R. Paulo, F. J. Velez, and G. Piro. Performance Evaluation and Packet Scheduling in HeNB Deployments. In 2018 IEEE 88th Vehicular Technology Conference (VTC-Fall), pages 1–6, Aug 2018.
[8] R. R. Paulo, F. J. Velez, and G. Piro. Design of Coordinated HeNB Deployments. In 2018 IEEE 87th Vehicular Technology Conference (VTC Spring), pages 1–6, June 2018.
[9] G. Piro, L.A. Grieco, G. Boggia, F. Capozzi, and P. Camarda. Simulating LTE Cellular Systems: An Open-Source Framework. Vehicular Technology, IEEE Transactions on, 60(2):498–513, Feb 2011.
[10] 3GPP TS 22.105. Services and service capabilities (release 15). Technical Report V15.0.0, 3rd Generation Partnership Project, July 2018.
[11] L. Hentilä, X. Zhao, T. Jämsä, C. Schneider, M. Narandzić, M. Milojević, A. Hong, J. Ylitalo, V. Holappa, M. Alatossava, R. Bultitude, Y. de Jong, T. Rautiainen, P. Kyösti and J. Meinilä. IST-4-027756 WINNER II D1.1.2 V1.2 WINNER II Channel Models. Technical report, February 2008.
[12] Z. Hanzaz and H. D. Schotten. Analysis of effective SINR mapping models for MIMO OFDM in LTE system. In 2013 9th International Wireless Communications and Mobile Computing Conference (IWCMC), pages 1509–1515, July 2013.
[13] S. N. Donthi and N. B. Mehta. An accurate model for EESM and its application to analysis of CQI feedback schemes and scheduling in LTE. IEEE Transactions on Wireless Communications, 10(10):3436–3448, October 2011.
[14] Video Trace Library. http://trace.eas.asu.edu/tracemain.html, 2019.
[15] F. Capozzi, G. Piro, L. Grieco, G. Boggia, and P. Camarda. On accurate simulations of LTE femtocells using an open source simulator. EURASIP Journal on Wireless Communications and Networking, 2012(1):328, 2012.
[16] J. S. Milton and J. C. Arnold. Schaum’s Outline of Introduction to Probability & Statistics: Principles & Applications for Engineering & the Computing Sciences. McGraw-Hill Higher Education, 1994.
[17] Vlc Barnett, and T. Lewis. Outliers in statistical data. 3rd edition. John Wiley & Sons 1994, 608 pp., 1995.
[18] R. R. Paulo, “LTE-SIM-RP,” https://github.com/RRP-IT/LTE-Sim-RP.git, 2020.
Biographies
Rui R. Paulo. Received the Licenciatura and M.Sc. degrees in Electromechanical Engineering from Universidade da Beira Interior (UBI), Covilhã, Portugal, in 2005 and 2008, respectively. He is currently pursuing the Ph.D. degree in Electrical and Computer Engineering at Universidade da Beira Interior. He serves as a volunteer in VTS Portugal Chapter, since 2006. He is with Instituto de Telecomunicações since 2006. His research interests include tele traffic engineering for wireless communications, radio resource management for small cell networks, packet scheduling and network optimization in heterogeneous networks with femtocells.

Fernando J. Velez (M93SM05) received the Licenciado, M.Sc. and Ph.D. degrees in Electrical and Computer Engineering from Instituto Superior Técnico, Technical University of Lisbon in 1993, 1996 and 2001, respectively. Since 1995 he has been with the Department of Electromechanical Engineering of Universidade da Beira Interior, Covilhã, Portugal, where he is Assistant Professor. He is also a senior researcher of Instituto de Telecomunicações. Fernando was an IEF Marie Curie Research Fellow in King’s College London (KCL) in 2008/09 (OPTIMOBILE IEF) and a Marie Curie ERG fellow at Universidade da Beira Interior from 2010 until March 2013 (PLANOPTI ERG). Fernando is the coordinator of the Instituto de Telecomunicações team in the Marie Skłodowska-Curie ITN Action (TeamUp5G) that started in 2019. He made or makes part of the teams of several European and Portuguese research projects on mobile communications and he was the coordinator of six Portuguese projects. Recently, he was the coordinator of CONQUEST (CMU/ECE/0030/2017), an exploratory project from Carnegie Mellon University (CMU) Portugal, a collaboration with the Department of Engineering and Public Policy from CMU. He has authored three books, 24 book chapters, 160 papers and communications in international journals and conferences, plus 39 in national conferences. Fernando is currently the IEEE VTS Region 8 (Europe, Middle East and Africa) Chapter Coordinator (nominated by VTS in 2010) and was the elected IEEE VTS Portugal Chapter coordinator from 2006 until 2014. He is also the adjunct coordinator from the Telecommunications Specialization of Ordem dos Engenheiros. Prof. Velez was the coordinator of the WG2 (on Cognitive Radio/Software Defined Radio Co-existence Studies) of COST IC0905 TERRA. His main research areas are cellular planning tools, traffic from mobility, wireless body sensor networks and wearable technologies, cross-layer design, spectrum sharing/aggregation, and cost/revenue performance of advanced mobile communication systems.

Bahram Khan He is an Early Stage Researcher (ESR7) since November 2019 at the Instituto de Telecomunicações and a Ph.D. student at the University of Beira Interior Covilhã, Portugal. He did his bachelor’s degree from COMSATS University in 2016 and Master studies from Bahria University in 2018 in the department of Electrical Engineering from Pakistan Islamabad. His research interest is HetNet, small cell deployments, carrier aggregation, cell-free. Currently, the project on which he is working is focused on 5G and beyond, which is titled as “Licensed Shared Access in Heterogeneous Network with Small Cells”, and is under the TeamUp5G and funded by Marie Skłodowska-Curie Innovative Training Networks (MSCA ITN) of the European Commission’s Horizon 2020 framework.
Journal of Mobile Multimedia, Vol. 17_1-3, 329–344.
doi: 10.13052/jmm1550-4646.171317
© 2020 River Publishers