ROC Analysis of EEG Subbands for Epileptic Seizure Detection using Naïve Bayes Classifier
Mustafa Sameer* and Bharat Gupta
Department of Electronics and Communication Engineering, National Institute of Technology Patna, Ashok Rajpath, Patna 800005, India
E-mail: mustafa.ec17@nitp.ac.in; bharat@nitp.ac.in
*Corresponding Author
Received 18 September 2020; Accepted 30 November 2020; Publication 26 January 2021
Abstract
This paper presents analysis of Electroencephalograms (EEGs) and subbands (delta, theta, alpha, beta, gamma) using image descriptors for epileptic seizure detection. Short-time Fourier transform (STFT) has been utilized to convert 1-D EEG data into image. All subbands are separated from the time-frequency (t-f) matrix and Haralick features of each subband is fed in the Naïve Bayes (NB) classifier. Receiver operating characteristic (ROC) analysis has been used for performance evaluation of classifier. Among all subbands, gamma band alone shows a maximum AUC of 0.98 to classify between ictal and healthy class, while beta band shows a maximum AUC of 0.96 to differentiate between ictal and interictal class. Significance of this work is it shows the medical advantage of different subbands for the detection process.
Keywords: EEG subbands, Haralick features, Naïve Bayes, ROC analysis, Epileptic seizures.
1 Introduction
More than 50 million people worldwide are suffering from epileptic seizures. It is the most common brain disorder after stroke. Mainly middle income and low-income countries people are affected by this disease [1]. Epileptic seizures results due to excessive discharge of neurons in the brain, which results in loss of control on the body. It can result in a sudden fall if a person is standing or an accident if a person is driving etc. Persons suffering from epilepsy has higher death rate as compared to healthy person. Seeing the dreadness of this disease, researchers have done a lot of work in last decade.
EEG captures electrical pulses generated in the brain, which is used for epileptic seizure detection [2]. The major advantage of EEG is its temporal resolution is high, non-invasiveness in nature and low cost due to which it is extensively used in the detection of epileptic seizures. EEG can be obtained by placing electrodes on the human scalp. Widely recognized 10–20 method is used for this work. Highly skilled neurologists are required to analyze EEG readings; still, there is a probability of the wrong prediction. So, an automated system to assist clinicians is having high demand.
A number of feature extraction methods, feature selection techniques and classification algorithms have been applied by various researchers for epileptic seizure automated systems. Time analysis [3], frequency analysis [4] and time-frequency (t-f) [5, 6] analysis has been used by researchers to extract features which can fed into machine learning classifier. Discrete wavelet transform (DWT) is one of the most widely used techniques for this purpose [7–9]. Different variants of Entropy, hurst exponent, Djorth parameters, statistical averages, average frequency, relative spike amplitude are the most important features calculated in previous works. Different t-f distribution functions have been reported by authors for detection of epilepsy using artificial neural network (ANN) [10]. In [11], authors have used rule-based classifier after doing STFT on EEG data. After the advent of deep learning work has been, various groups have presented work on it. Deep learning has the advantage of automatic feature selection. Acharya et al. [12] were first to use convolutional neural network (CNN) for epileptic seizure detection. They presented a network having 13 layers, which gives 89% accuracy for three-class classification. Ulah et al. [13] proposed the pyramidal structure of CNN and used large number of epochs to reach good accuracy. As well as data augmentation has also been done in their work to increase the number of instances, which is an additional stage in the automated system. In recent days, t-f image descriptors are used to extract features for the automated epileptic detection system. In [14], authors have used t-f images obtained from the spectrogram and employed local binary pattern (LBP), texture feature coding method (TFCM), and gray-level co-occurrence matrix (GLCM) as texture descriptors to extract features. Multiscale radial basis function has been used to extract GLCM and Fisher vector to extract features [15]. Authors have derived Haralick features from quadratic t-f distribution in [16]. In [17], authors have applied DWT on EEG signals and extracted 1D-LBP features. They have used multiple support vector machine (SVM) classifiers to build an ensemble classifier for classification purpose. In [18], authors have divided amplitude and phase t-f image based on different frequency ranges obtained after applying STFT on EEG signals. They have extracted texture features and fed to SVM for detection.
Most of the research work use entire brain dynamics for epileptic detection. There is different frequency bands (0.4–4 Hz), (4–8 Hz), (8–12 Hz), (12–30 Hz) and (30–60 Hz) of EEG signal [19, 20]. However, not all bands are essential for the detection purpose. Certain changes which are not visible in full spectrum can be viewed in a particular band [21]. Our premise of this study is to show medical significance of different subbands for epilepsy detections using texture features. Preliminary work has been shown by the authors in [22]. To the best of our information no work has been presented on Haralick features used to analyze the performance of medically established bands. This work has cut subbands from the t-f plane of STFT. From each subband, Haralick features are extracted and fed to the NB classifier to classify between different groups.
2 Experimental Data Used
The experiments has been performed on publicly available EEG dataset of University of Bonn, Germany [23]. The EEG dataset has five different groups namely Z, O, N, F and S and it is collected with the help of 128 channels. Each group of the dataset has 100 segments. The duration of each segment is 23.6 seconds and has the sampling frequency of 173.61 Hz.
The segments in Z and O group were acquired from healthy persons with eyes open and closed, respectively, using the 10–20 system. The data collected in groups N and F are from hippocampal formation and epileptogenic zone, respectively, during seizure-free periods of epileptic patients. Segments of group S is taken from epileptic patients during the seizures period. Summarize description of dataset is presented in Table 1. Figure 1 presents EEG segment of Z, O, N, F and S group.
Table 1 Summary of different groups
| Subjects from | Numbers | ||
| which EEG | of | Way of Data | |
| Data Acquired | Groups | Instances | Collected |
| Healthy Person | Z | 100 | eye opened |
| O | 100 | eye closed | |
| Epileptic Patients | N (Seizure free) | 100 | from the hippocampal formation |
| F (Seizure free) | 100 | from epileptogenic zone | |
| S (Seizure) | 100 | during seizure period |
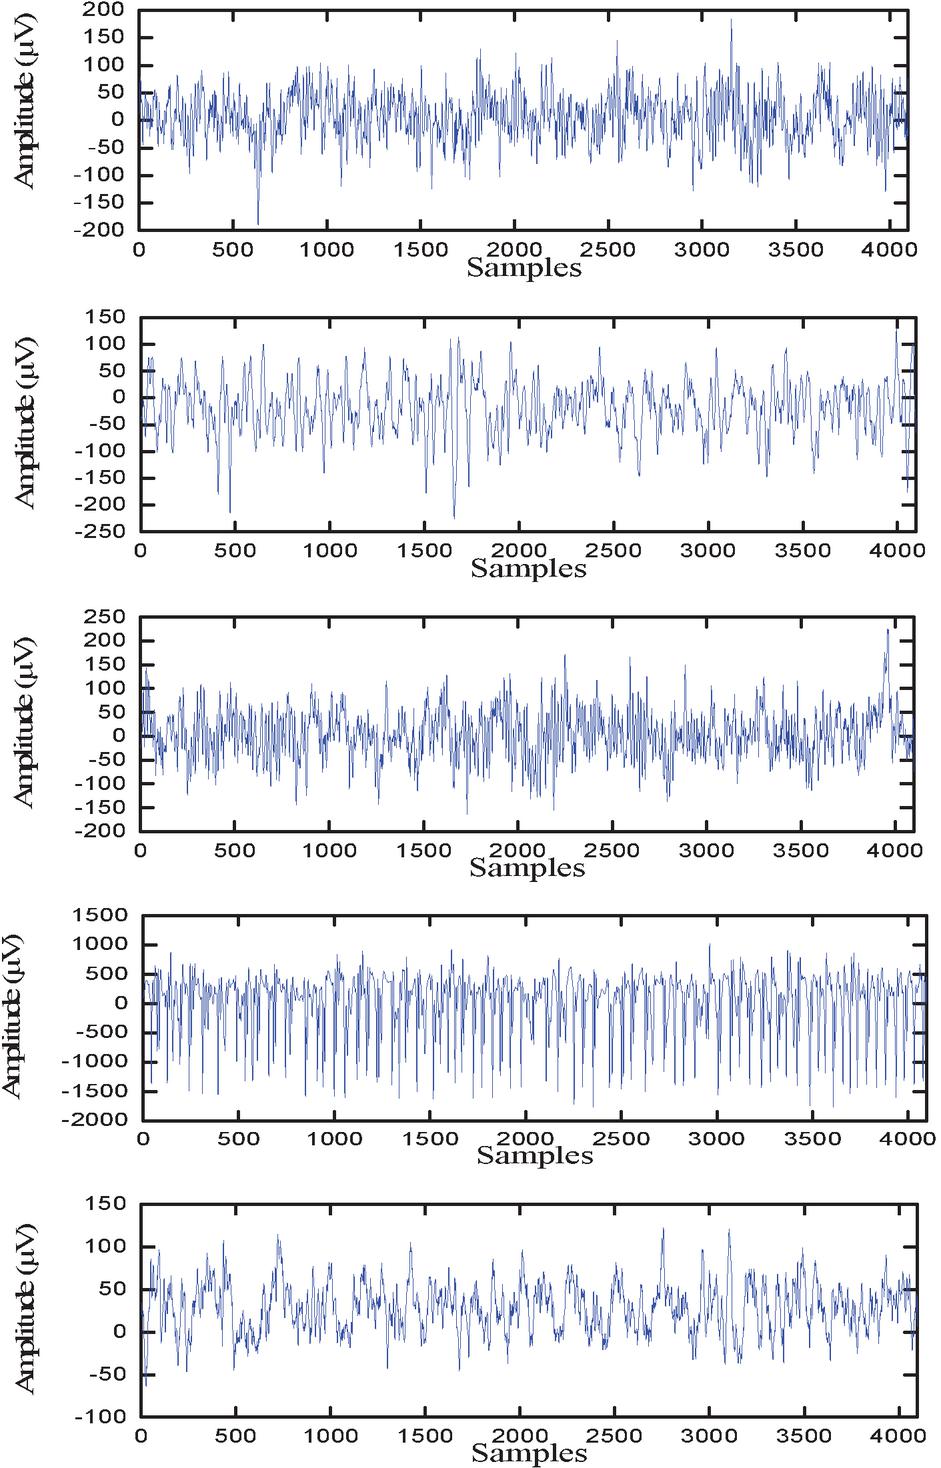
Figure 1 EEG segments of Z, O, N, F, and S (top to down).
3 Methodology Used
This work has used different steps to detect epileptic seizures, shown in Figure 2. The database of Bonn University, Germany on which the proposed methodology is applied is already pre-processed. Hence STFT has been applied directly without using artifact removal techniques.
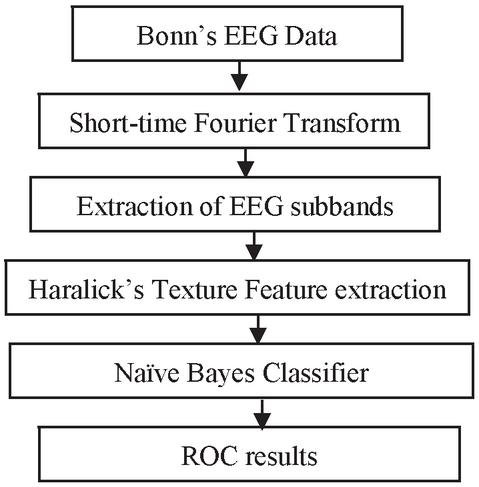
Figure 2 Overview of the steps performed.
3.1 Short-time Fourier Transform
A number of t-f methods are available to perform analysis. Wavelet transform methods are less preferable than STFT for real-time processing [24]. In this paper, to perform t-f analysis of EEG data, STFT has been used [25]. This method provides localization of time in frequency and vice versa. It transforms 1-D EEG data (time-domain) to two dimensions (t-f plane). Hamming window is utilized in this work for STFT operation. The size of window is kept odd (N/4), where, N is the number of data points. Let EEG signal be m(t), and hamming window of short duration be w(t), then STFT is given by the expression (1):
| (1) |
Figure 3 shows the power spectral density (PSD) of gamma band one segment of (a) Z group (b) S group.

Figure 3 PSD of gamma band.
3.2 Feature Extraction
Texture features given by Haralick have been extracted from 2-D t-f representation of EEG signals in this work [26]. To extract textural features, STFT has been applied to EEG data to obtain image data. Any information related to seizure activity or non-seizure pattern on it can be obtained while dealing with it as an image descriptor. To extract Haralick features firstly, GLCM has been calculated from t-f plane of each subband, represented by Z (having size P P, where P is the number of gray levels in image data). The method to generate this matrix is the occurrence of pixel pairs in reference to particular values of an image. The reference values can be taken in terms of distance and angle . The authors have taken and as 0, 45, 90, and 135.
3.3 Classification
Naïve Bayes (NB) algorithm has been implemented on the extracted Haralick features for the classification process. This algorithm uses simple probabilistic method for classification task. The basic working principle of this classifier depends on Bayes theory [27]. The advantages of NB classifier are its easy implementation and fast classification process. It is widely used for medical diagnosis and data mining applications [28]. Based on the distribution of samples different types of NB are used. In this work, predictors are normally distributed.
Table 2 AUC obtained
| AUC | ||||||
| Data Cluster | Delta | Theta | Alpha | Beta | Gamma | EEG |
| Z-S | 0.69 | 0.60 | 0.89 | 0.74 | 0.98 | 0.99 |
| O-S | 0.80 | 0.66 | 0.72 | 0.63 | 0.93 | 0.98 |
| ZO-S | 0.73 | 0.44 | 0.81 | 0.71 | 0.96 | 0.98 |
| N-S | 0.69 | 0.86 | 0.86 | 0.96 | 0.75 | 0.98 |
| F-S | 0.72 | 0.76 | 0.80 | 0.91 | 0.79 | 0.96 |
| NF-S | 0.70 | 0.81 | 0.83 | 0.94 | 0.75 | 0.98 |
| ZONF-S | 0.71 | 0.62 | 0.79 | 0.82 | 0.84 | 0.96 |
| ZO-NFS | 0.66 | 0.62 | 0.84 | 0.71 | 0.86 | 0.95 |
| ZO-NF | 0.74 | 0.80 | 0.90 | 0.89 | 0.78 | 0.95 |
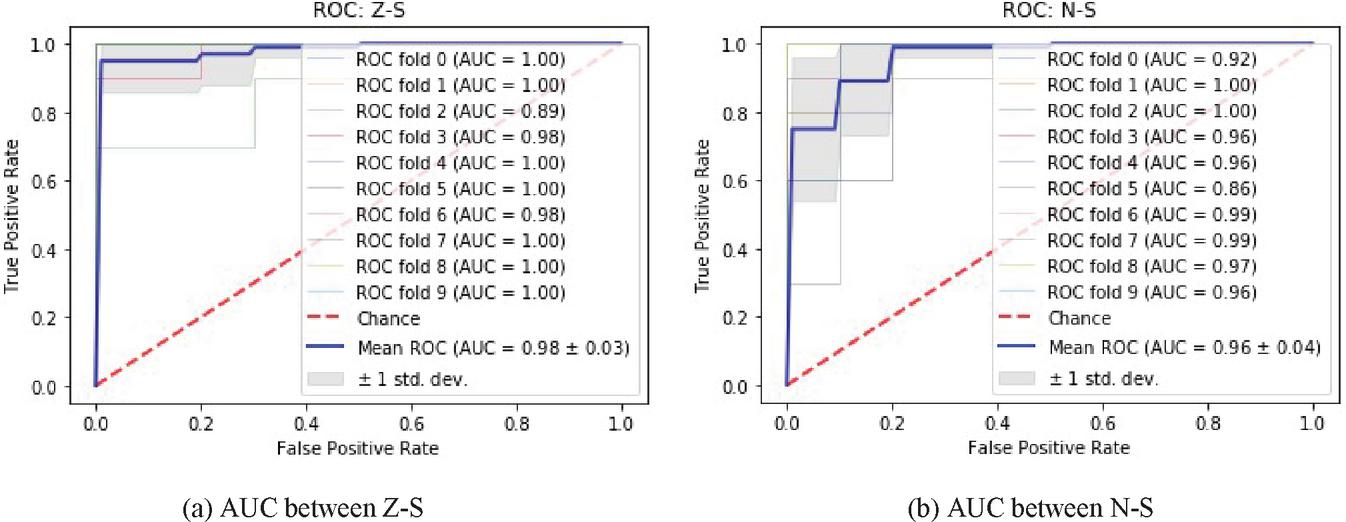
Figure 4 ROC of gamma band.
4 Results and Discussion
In this work from each subband, 52 features have been extracted, making a total of 260 features from all subbands. Using different combinations of groups, nine experiments shown in Table 2 have been performed. Among various methods of splitting data, authors have used the K-fold cross-validation technique. The feature vector set obtained after Haralick process has been partitioned into K 10 parts of same size. Out of which, one subset from the partitioned data is used as a testing set, and the remaining nine is used as training set. The final output is taken as the average after repeating this process K times. It can be seen from Table 2 that the gamma band alone is able to achieve AUC of 0.98 between ictal and healthy persons. While beta band shows an accuracy of 0.96 between interictal and ictal groups. Figure 4 shows the ROC curve for healthy, ictal, and interictal groups. The ROC analysis has been performed in Python software [29].
In [30], 93.6% success rate has been achieved in the classification between seizures and non-seizures. Our earlier work shows 84% detection rate using alpha band [22] while this work shows a higher distinguishing rate of 98 % using only the gamma band.
5 Conclusion
ROC analysis of all EEG subbands using Haralick features for different combinations of Bonn’s EEG epilepsy dataset has been presented. Time series EEG data has been converted into t-f plane using STFT. This operation is performed on MATLAB. Results show the AUC value of 0.99 has been achieved between normal and ictal states. This work shows a detection rate of 98% in the gamma band only between seizures and healthy persons, while the beta band is sufficient to differentiate between interictal and ictal states. Thus, the use of a single subband for the detection process results in less computational tasks in the automated system, making it suitable for real-time detection process. As a future work author is planning to implement it on FPGA.
References
[1] G. L. Birbeck, “Epilepsy Care in Developing Countries: Part II of II,” Epilepsy Curr., 2010, doi: 10.1111/j.1535-7511.2010.01372.x.
[2] X. Zhao and S. D. Lhatoo, “Seizure detection: do current devices work? And when can they be useful?,” Current Neurology and Neuroscience Reports. 2018, doi: 10.1007/s11910-018-0849-z.
[3] J. Gotman, “Automatic seizure detection: improvements and evaluation,” Electroencephalogr. Clin. Neurophysiol., 1990, doi: 10.1016/0013-4694(90)90032-F.
[4] G. Widman, T. Schreiber, B. Rehberg, A. Hoeft, and C. E. Elger, “Quantification of depth of anesthesia by nonlinear time series analysis of brain electrical activity,” Phys. Rev. E - Stat. Physics, Plasmas, Fluids, Relat. Interdiscip. Top., 2000, doi: 10.1103/PhysRevE.62.4898.
[5] S. Mamli and H. Kalbkhani, “Gray-level co-occurrence matrix of Fourier synchro-squeezed transform for epileptic seizure detection,” Biocybern. Biomed. Eng., 2019, doi: 10.1016/j.bbe.2018.10.006.
[6] M. Sameer and B. Gupta, “Detection of epileptical seizures based on alpha band statistical features,” Wirel. Pers. Commun., 2020, doi: 10.1007/s11277-020-07542-5.
[7] H. Ocak, “Automatic detection of epileptic seizures in EEG using discrete wavelet transform and approximate entropy,” Expert Syst. Appl., 2009, doi: 10.1016/j.eswa.2007.12.065.
[8] M. Mursalin, Y. Zhang, Y. Chen, and N. V. Chawla, “Automated epileptic seizure detection using improved correlation-based feature selection with random forest classifier,” Neurocomputing, 2017, doi: 10.1016/j.neucom.2017.02.053.
[9] A. Subasi, J. Kevric, and M. Abdullah Canbaz, “Epileptic seizure detection using hybrid machine learning methods,” Neural Comput. Appl., 2019, doi: 10.1007/s00521-017-3003-y.
[10] A. T. Tzallas, M. G. Tsipouras, and D. I. Fotiadis, “Epileptic seizure detection in EEGs using time-frequency analysis,” IEEE Trans. Inf. Technol. Biomed., 2009, doi: 10.1109/TITB.2009.2017939.
[11] G. Wang, Z. Deng, and K. S. Choi, “Detection of epilepsy with Electroencephalogram using rule-based classifiers,” Neurocomputing, 2017, doi: 10.1016/j.neucom.2016.09.080.
[12] U. R. Acharya, S. L. Oh, Y. Hagiwara, J. H. Tan, and H. Adeli, “Deep convolutional neural network for the automated detection and diagnosis of seizure using EEG signals,” Comput. Biol. Med., 2018, doi: 10.1016/j.compbiomed.2017.09.017.
[13] I. Ullah, M. Hussain, E. ul H. Qazi, and H. Aboalsamh, “An automated system for epilepsy detection using EEG brain signals based on deep learning approach,” Expert Syst. Appl., 2018, doi: 10.1016/j.eswa.2018.04.021.
[14] A. Şengür, Y. Guo, and Y. Akbulut, “Time–frequency texture descriptors of EEG signals for efficient detection of epileptic seizure,” Brain Informatics, 2016, doi: 10.1007/s40708-015-0029-8.
[15] Y. Li, X. D. Wang, M. L. Luo, K. Li, X. F. Yang, and Q. Guo, “Epileptic Seizure Classification of EEGs Using Time-Frequency Analysis Based Multiscale Radial Basis Functions,” IEEE J. Biomed. Heal. Informatics, 2018, doi: 10.1109/JBHI.2017.2654479.
[16] L. Boubchir, S. Al-Maadeed, and A. Bouridane, “Haralick feature extraction from time-frequency images for epileptic seizure detection and classification of EEG data,” in Proceedings of the International Conference on Microelectronics, ICM, 2014, doi: 10.1109/ICM.2014.7071799.
[17] C. Sun, H. Cui, W. Zhou, W. Nie, X. Wang, and Q. Yuan, “Epileptic Seizure Detection with EEG Textural Features and Imbalanced Classification Based on Easy Ensemble Learning,” Int. J. Neural Syst., 2019, doi: 10.1142/S0129065719500217.
[18] M. Li, X. Sun, W. Chen, Y. Jiang, and T. Zhang, “Classification epileptic seizures in EEG using time-frequency image and block texture features,” IEEE Access, 2020, doi: 10.1109/ACCESS.2019.2960848.
[19] R. P. N. Rao, Brain-computer interfacing: An introduction. 2011.
[20] M. Sameer, A. K. Gupta, C. Chakraborty, and B. Gupta, “ROC Analysis for detection of Epileptical Seizures using Haralick features of Gamma band,” 2020, doi: 10.1109/ncc48643.2020.9056027.
[21] H. Adeli, S. Ghosh-Dastidar, and N. Dadmehr, “A wavelet-chaos methodology for analysis of EEGs and EEG subbands to detect seizure and epilepsy,” IEEE Trans. Biomed. Eng., 2007, doi: 10.1109/TBME.2006.886855.
[22] M. Sameer, B. Gupta, and R. Priyadarshi, “Classification Between Interictal and Ictal States of Epileptical Patients using Alpha Subband,” Proceeding: International Symposium on 5G & Beyond for Rural Upliftment 2020, pp. 254–258.
[23] R. G. Andrzejak, K. Lehnertz, F. Mormann, C. Rieke, P. David, and C. E. Elger, “Indications of nonlinear deterministic and finite-dimensional structures in time series of brain electrical activity: Dependence on recording region and brain state,” Phys. Rev. E – Stat. Physics, Plasmas, Fluids, Relat. Interdiscip. Top., 2001, doi: 10.1103/PhysRevE.64.061907.
[24] M. K. Kiymik, I. Güler, A. Dizibüyük, and M. Akin, “Comparison of STFT and wavelet transform methods in determining epileptic seizure activity in EEG signals for real-time application,” Comput. Biol. Med., 2005, doi: 10.1016/j.compbiomed.2004.05.001.
[25] L. Cohen, “Time-frequency distributions-a review,” Proc. IEEE, vol. 77, no. 7, pp. 941–981, Jul. 1989, doi: 10.1109/5.30749.
[26] R. M. Haralick, I. Dinstein, and K. Shanmugam, “Textural Features for Image Classification,” IEEE Trans. Syst. Man Cybern., 1973, doi: 10.1109/TSMC.1973.4309314.
[27] S. Marsland, Machine learning: An algorithmic perspective. 2014.
[28] M. Sameer, A. K. Gupta, D. C. Chakraborty, and D. B. Gupta, “Epileptical Seizure Detection: Performance analysis of gamma band in EEG signal Using Short-Time Fourier Transform,” in International Symposium on Wireless Personal Multimedia Communications, WPMC, 2019, doi: 10.1109/WPMC48795.2019.9096119.
[29] ANACONDA, “vers. 2-2.4.0, Anaconda Software Distribution. Computer software,” Anaconda Software Distribution. Computer software, 2016.
[30] S. Altunay, Z. Telatar, and O. Erogul, “Epileptic EEG detection using the linear prediction error energy,” Expert Syst. Appl., 2010, doi: 10.1016/j.eswa.2010.02.045.
Biographies

Mustafa Sameer received his M. Tech Degree in Electronics Engineering from Indian Institute of Technology, Banaras Hindu University, Varanasi in 2012. He worked as Research Assistant in School of Computer and System Sciences, Jawaharlal Nehru University, New Delhi. Presently he is working towards PhD from National Institute of Technology Patna in the area of epileptic seizure detection. His research interests include machine learning, deep learning etc.

Bharat Gupta is attached to the field of education and research for last fifteen years. He is a senior member of IEEE (USA). He did his graduation in (honors) 2000 and post-graduation in 2003. He did his doctorate from University of Rome, Tor Vergata, Italy. Presently, He is working as an Associate Professor in Department of Electronics & Communication Engineering, National Institute of Technology Patna, Bihar. Dr. Gupta is handling two projects funded by MeitY. He has delivered many lectures in International & National conferences and workshops. He has published more than 60 papers in International and National Journals and conferences. He has acted as reviewer of many international conferences & journals. He was in Advisory Committee in National Conference and has also chaired many sessions in conferences. He has organized the workshops at national and international level. His research area covers mainly Wireless Body Area Network, Routing and MAC protocol for Medical Wireless Communication, ICT for Health care, Internet of Thing (IoT), Internet of Medical Thing (IoMT), FMUWB communication technology, Biomedical signal processing, Machine Learning, etc.
Journal of Mobile Multimedia, Vol. 17_1-3, 299–310.
doi: 10.13052/jmm1550-4646.171315
© 2020 River Publishers