Total Productive Education: Model for Higher Technical Education
Dnyandeo Dattatraya Shinde* and Ramjee Prasad
1Department of Mechanical Engineering, SOET, Sandip University, Mahiravani, Trimbak Road, Nashik – 422013, India
2Department of Business Development and Technology, Aarhus University, Herning, Denmark
E-mail: ddshinde14@gmail.com; ramjee@btech.au.dk
*Corresponding Author
Received 16 November 2020; Accepted 30 November 2020; Publication 26 January 2021
Abstract
Industries need young engineers with proper Attitude, Skills, and Knowledge (ASK), ready to work from the first day without training. Technical education is the backbone for employment in industries. The demand and supply ratio is not matching due to lacunae in higher technical education. Industries are marching towards excellence with the implementation of Total Productive Maintenance (TPM) measured by Overall Equipment Efficiency (OEE). The paper focuses on how the TPM and its tools enhance education quality through the proposed model of Total Productive Education (TPE) for increasing the efficacy of the education system.
Keywords: Total productive maintenance, total productive education, TPM tools, higher technical education, engineering education, overall equipment efficiency.
1 Introduction
The development of any country depends on its youth power. The highly skilled and educated young workforce accelerates the technical sector. Engineering graduates with the latest skillset and research attitude will lead the nation to higher goals. The base of these graduates is engineering education. In the last decade, there is a tremendous increase in the number of technical institutes, which has drastically increased the intake of engineering seats. However, there is no significant increase in the employability ratio, which has started affecting the enrolment ratio of the students in technical institutes [1].
An annual National employability report 2019 of Aspiring Minds has quoted that – “The past nine years have brought no change in the employability of Indian engineering graduates. India’s higher education system needs systemic change”. The report states that more than 80% of Indian graduate engineers are unemployable due to a lack of knowledge and skills [2].
Figure 1 shows the coursewise enrolment and employability of engineering, MBA, and Pharmacy students for the academic year 2016–17. Figure 1 represents that there is an enrollment of 1845610 students against the intake of 3618848. Approximately 51% and the rest of the seats are vacant. It is less in a few institutions which are not able to maintain their quality. There is a need to focus on the low employability problem resulting in a low enrollment ratio of the students. Whereas, the reports also reflect the demand for highly skilled engineering graduates’ increasing in the companies. Indicating that the higher technical education system needs a systematic change [3].

Figure 1 Engineering course wise employability ( Source: India skill report 2019).
The India Skill report gives more details regarding the employability of engineers. Sectors that hired the most are software/hardware/manufacturing. It also represents that the candidates hired from the engineering domain in 2014 were 28%, in 2015 – 29%, and in 2019 it is 23%. Whereas for non-engineering MCA and M.Sc, it increased from 6% in 2014 to 11% in 2019. It represents that the hiring of engineering graduates has not increased as per the requirements. Further, there are chances that 40% of job loss in this sector because of technological advancement. Therefore, there is a need for skilling to reskilling. Future work will be in the form of Gigs. Gig worker is project-based where the person is not hired for a full-time job, whereas he is assigned the project with an assured outcome and get paid for it. They can work on multiple projects, requiring a more skilled workforce. The absence of industry connections also impacts students’ employability. Electronics and communication, electrical, IT have ample internship opportunities where the student gains industrial experience. These engineers have the highest employability ratio. Civil has lower amongst all courses due to less practical exposure of students [2]. There is a need to focus on industrial internships and training of the students.
Considering the scenario of higher technical education, as per the reports discussed above, there is high time to analyze the education system and find industry connections to improve the employability of students. Two parameters which are in discussion – industry and technical institutes are the centers of discussion in this paper. The industries are achieving excellence and moving towards world-class, whereas there is a question of survival for the education system. The reason for industrial excellence is the implementation of Total Productive Maintenance (TPM). The problem for employability is industry connection and lack of skills due to which students are unemployable. The paper aims to connect the TPM concept in the education sector to enhance the quality of technical institutes resulting in increasing the class of graduating students. The TPM discussed in brief, and the Total Productive Education model thus proposed in the paper for technical education.
2 Total Productive Maintenance
In industries, the parameter to measure output is in terms of productivity. To increase productivity, they focus on reducing losses at every stage, governed by various pillars of TPM. They reduce the losses to improve the performance of machines, process and motivates and train the workforce. TPM is the tool for effectively minimizing losses in production, machine downtime, material scraps for improving the working efficiency, the productivity of employees, and equipment [4].
Key elements by which TPM is characterized:
1. TPM aims to maximize equipment effectiveness and efficiency.
2. TPM establishes a system of Preventive Maintenance (PM) for the machines over their lifespan.
3. TPM is cross-functional, implemented by various departments (operations, engineering, maintenance management, and administration).
4. TPM involves every single employee, from senior management to operators and clerical staff, to develop small group activities, emphasizes the role of teamwork.
5. To achieve zero losses, no accidents, no defects, and no failures [4, 5].
TPM is governed by its eight pillars, with the base of 5S. Implementing 5S is the preparatory stage for TPM. 5S is a valuable and critical element of the TPM process. It is challenging to assess the economic value of the 5S activity, as they are not a result center. They emphasize people’s behavioral patterns, such as cleaning and neatening of equipment, the elimination of unnecessary items from the workplace. Subsequently, the activities are making it difficult for the quantitative assessment of their effectiveness. However, it is possible to do evaluations qualitatively. Several checklists are available for such checking on a macro scale. If 5S not taken seriously, it leads to 5D. They are Defects, Delays, Dissatisfied customers, Declining profit rate, and Demoralized employees [6]. 5S implemented and monitored at each pillar of the TPM helps to improve productivity and thus, improves OEE.
The 5S and TPM are from Japanese culture. These Japanese words in 5S are – Seri, Seiton, Seiso, Saketsu, Shitsuke [7] described in Table 1:
Table 1 5S Description
| 5S Steps | Description |
| Seiri (Sort) | Have a place for each item. Sort and remove unwanted items. |
| Sieton (Set in order) | Put each item in its place. |
| Seiso (Shine) | Clean and maintain the workplace daily. |
| Seiketsu (Standardize) | Standardize the procedure for the first three S, and follow it. |
| Shitsuke (Sustain) | Sustain the process by the following self-discipline. |
The study shows that 5S implementation in the industries has the following implications [7]:
• Commitment to improvement from all employees.
• Proper use of spare parts with a reduction in mistakes.
• Reduction of breakdowns.
• Quick and easy accessibility of the maintenance tools.
• Reduction of maintenance costs.
• Pleasant and safe working place.
TPM Pillars: There are eight pillars in TPM. TPM pillars aim to reduce major and minor losses, thus improving OEE. The pillars of TPM has the task to reduce the assigned losses and improve efficiency. The TPM pillars described as follows:
Pillar 1: JH- Jishu Hozen (Autonomous Maintenance): is the mother pillar amongst all. It aims to bring the ownership approach to the operator. The operator owns the responsibility of cleaning and maintenance of his machine.
Pillar 2: KK – Kobestu Kaizen (Focused Improvement): aims to identify and minimize waste and manufacturing losses. Eliminate losses resulting in improving OEE.
Pillar 3: PM – Progressive Maintenance: pillar deals with Preventive break down (Time Base Maintenance). It establishes Preventative and Predictive Maintenance systems for equipment and tooling. Thus, minimizing breakdown losses and other main losses.
Pillar 4: ET (Education and Training): boost the morale and expertise of the operators and persons involved by providing soft skill training and technical training.
Pillar 5: QM (Quality Maintenance): pillar monitors the factors affecting variance in product quality. It focuses on zero quality defects.
Pillar 6: IFM (Initial Flow Management): establish systems to shorten new product or equipment development prototyping lead time. Achieve stable commissioning of new product and equipment vertical start-up.
Pillar 7: OTPM (Office TPM): the goal is to create a highly efficient office, achieve zero functional losses, and provide effective service and support to other departments. Administrative and support departments are treated as process plants, performing tasks to collect, process, and distribute information.
Pillar 8: EHS (Environment Health and Safety): Assures safety and prevents adverse environmental impacts, which are important priorities in any TPM effort. EHS achieves and sustains zero accidents, creates a healthy, rewarding, and pleasant workplace [8]. Figure 2 shows the TPM house with base 5S and eight pillars.
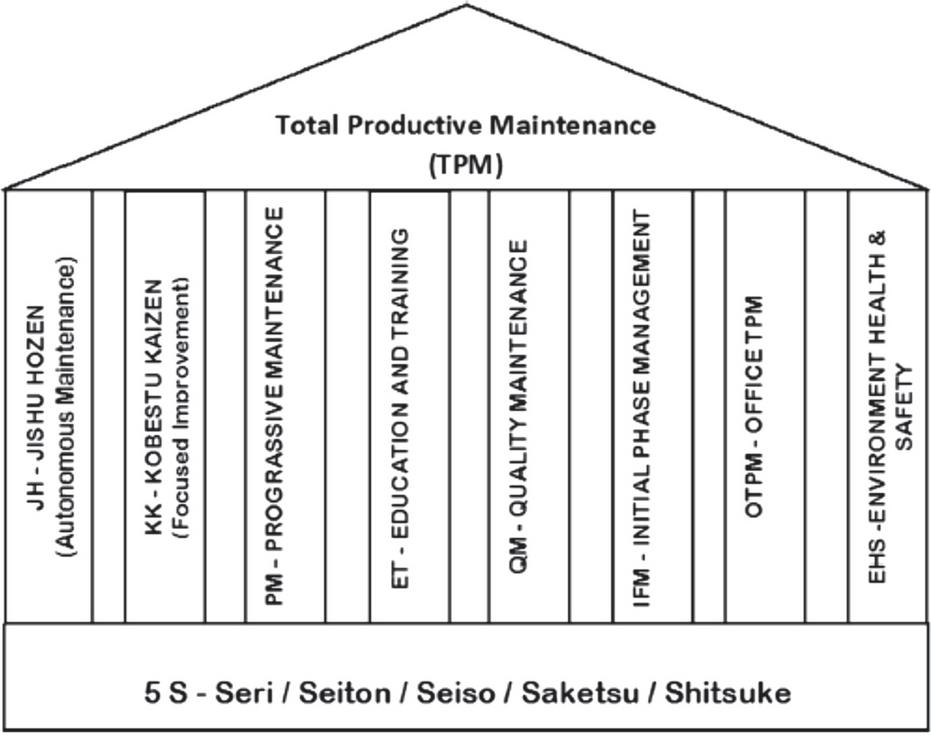
Figure 2 TPM pillars.
The elementary measure associated with Total Productive Maintenance (TPM) is the OEE. The OEE highlights the actual hidden capacity in an organization [6], depending on three parameters: – Availability of machine/equipment, performance, and quality. It takes into consideration the six major losses, named as [9]: Downtime Loss, Breakdown loss, Setup and adjustment time losses, Speed Loss, Performance loss, Defect, or quality losses. TPM pillars also function to reduce other losses along with these six losses. These losses can be reduced/eliminated by using various techniques in the form of TPM tools. TPM tools are procedures, methods, and activities performed and monitored during the deployment of TPM. Some of the tools deployed to analyze and solve equipment and process-related problems include but not limited to the following, shown in Table 2 [7]:
Table 2 TPM tools
| S. No. | TPM Tool | Description |
| 1 | 2-Bin System | It is an inventory control system. There are two bins –a working bin and a supporting bin. When the first bin has been consumed, the material from the second bin is transferred, and the order is placed, maintaining sufficient stock. |
| 2 | 5 Why’s | It is a process to determine the root cause of a problem. In this technique, a series of questions like why something occurred, then why this happened, asked and repeated until the root cause is identified. |
| 3 | 5S | 5S is the first step implemented in TPM, which focuses on cleaning, organizing, and maintaining the workplace. |
| 4 | AQL Acceptance Quality Limit | AQL is a statistical tool to limit the number of defective items acceptable in a randomly selected sample. |
| 5 | Benchmarking | Benchmarking is the process of comparing and setting the best practices in an organization. |
| 6 | Bottleneck Analysis | The bottleneck is the analysis tool to identify the critical and blocking step in the process, which affects continuity inflow, acting as a constraint. |
| 7 | Brainstorming | It’s a problem-solving technique involving team members from all sections. Generate and provide better solutions to the problem. |
| 8 | Cause and Effect (Fishbone) diagram | It is a root cause analysis tool to identify the causes and their effects on the process. It resembles a fishbone structure. |
| 9 | Cross-Training | It is a training process to make the workforce compatible to handle another process within work, in case of an emergency. |
| 10 | CUDBAS | Curriculum Development Based on Vocational Ability Structure It is the recent tool used for the education and training of the workforce. |
| 11 | FMEA | Failure Modes and Effects Analysis It is the process of analyzing failures and their effects. |
| 12 | Gemba | It is a problem identifying technique by visiting at actual workplace. |
| 13 | Kaizen | It is an activity by an individual or a team for continuous incremental improvement in the organization. |
| 14 | Pareto chart | It is for showing the frequency of occurrence. |
| 15 | Poka Yoke | It is a mechanism to make the process error-proof. It prevents mistakes from becoming defects. |
| 16 | Preventive Maintenance | It is for regular maintenance to avoid failure. |
The above tools are used for eliminating the losses and for increasing the performance, thus improving the OEE.
OEE calculated as the product of the three main bases for the six major losses:
1. Availability indicates the problem caused by downtime losses.
2. Performance indicates the losses caused by speed losses
3. Quality indicates scrap and reworks losses [10].
All the above parameters have individual formulas to calculate the term. If the industry achieves OEE more than 85%, it is marching towards excellence [11].
The basic equations for the calculations are given below [7]:
| OEE (in %) | |
| Equipment availablility (A) | |
| Performance efficiency (P) | |
| Quality Rate (Q) |
The OEE is a proven approach and a powerful tool used to perform diagnostics as well as to compare production units in different industries. OEE is used to evaluate the most bottleneck operation or machine in an organization. The OEE not only helps to achieve minimum breakdown and to keep the plant in a good working condition at the lowest possible cost but also reveals the hidden costs associated with the efficiency of the equipment [12].
Benefits of implementing TPM:
• Productivity and overall plant efficiency increases from 1.5 to 2 times
• Manufacturing cost reduces up to 30 %
• Reduction in accidents
• Identification & resolve customer complaints
• Pollution control measures taken care
• Improvement in product quality
• Increases consistency
• Creates ownership feeling in employees and Increases confidence level
• The workplace is always neat, clean, and attractive
• Change in attitude of the operators in favor of the company
• Sharing of knowledge and experiences among all
• Teamwork to achieve organizational goals
• Horizontal deployment of a new concept in all areas of the organization [4].
TPM successfully implemented in many industries, and the results are excellent. Case studies show the improvement of OEE by TPM. Sutoni A. et.al. discussed TPM analysis on lathe machines using the OEE method [13] through the case study conducted in an automobile base Lathe machine. The analysis of the Lathe machine was done over a year. The root cause analysis is done with by Fishbone diagram method. The problems and losses were identified and resolved, which increased OEE due to reduction of losses as:
• Setup and Adjustment losses reduced by 40.3%,
• Reduced Speed Losses by 19.9%,
• Breakdown Loss by 18.5%,
• Idling Minor Stoppage by 17.6%,
• Rework Loss by 3.8%, and Scrap or Yield Loss of 0%.
Zarreti et al. gave the recent case study of cybersecurity concern for TPM in a smart manufacturing system [14]. Paper represents how the TPM and then ultimately, OEE can be affected by the attack of threats on the system, which have interconnectivity of cyber and physical domain in a smart manufacturing system. For the prevention of this, IT security is required to avoid downtime of the system.
Meca Vital et al., in their survey-based study, discussed the TPM and impact of each pillar in the OEE [15]. In the case study, the analysis of the impact of each TPM pillar on the Overall Equipment Effectiveness (OEE) metric is presented. The study is survey-based. The results showed that the Focused Improvement, and Planned Maintenance pillars were implemented in most of the respondent companies. The paper gives the idea regarding the sequence of implementation of the TPM pillars for various sectors.
S. Nallusamy described an increase in the efficiency and productivity of the CNC machine using TPM [16]. The case study is to study the effectiveness and implementation of the TPM and 5S in a machine shop for enhancing OEE. It focused on minimizing the breakdowns, increase the performance and quality rate of the machine, thus improving the effectiveness. The outcome was OEE improvement by 5% in the horizontal machining center and by 7% in the vertical machining center. S. Nallusamy also presented a case study for the manufacturing industry [17]. Reflecting the OEE increment by 15%, achieved by the reduction in setup time, cycle time, rework time, and breakdown losses.
TPM implementation in industries is discussed with the case studies, success stories, and analysis by many authors. Considering the benefit of TPM, a similar concept thus proposed to be implemented in the education sector to increase efficacy. The TPM pillars are focusing on reducing or eliminating the losses. In the technical education system, the problems identified and methods to address these problems are suggested, based on the TPM concept, the Total Productive Education (TPE) model proposed in the paper, for the higher technical education sector.
3 TPM in Education Institutes
3.1 Input and Output
The earlier sections describe the TPM and its benefits. Effective implementation of the TPM concept from industry in the education sector is possible according to the analogy proposed. In industry, the manufacturing process involving man and machines, convert the raw material to finished product. Whereas, in education institutes, students at particular grades upgraded to higher qualifications with the teaching-learning process. Figure 3 shows the analogy between the industry and institute.

Figure 3 Input-output for industry and institute.
The raw material is input for the industry. Whereas, for the institute, it is students of different levels. The manufacturing process in the industry, replaced by the teaching-learning process in institutes. A finished product from industry analogous to the student at an upgraded level and degree institute. Problems in education institutes correlated to losses in industries affecting productivity, and attempt to propose the tools to eliminate problems.
3.2 Comparing Losses in Industry and Problems in Institutes
TPM reduces sixteen major losses and improves overall equipment effectiveness and efficiency. The losses compared with problems in institutes.
The problem in institutions are identified in terms of sixteen losses in industries as given in Table 3:
Table 3 Industrial losses and Institute problems
| 16 Major Losses in Industry | Problems in Institute |
| 1. Setup and Adjustment |
• Late admission of few students, change in a course/program, change in Institute/University. |
| 2. Start-Up |
• Students admitted to a particular course are not having the necessary prerequisite, weak in basic fundamental principles, language problems. • Students are not interested but are forced to take admission to a program they are not interested in. • Students are failing in exams in the first attempt. |
| 3. Operating Motion |
• Avoid delay in movement from laboratories, workshop, seminar hall, canteen with proper layout of the departments. |
| 4. Line Organization |
• The dependency of departments – exam department needs timely support from faculties from submission of question bank/question paper to assessment of answer sheets. • Store – to provide Stationary requirements for the department, students printed journals, consumable material for laboratory purposes like chemicals, petrol/diesel. |
| 5. Management |
• Administration, delay in the process of admission/ form filling/ banking. • Process for each department: admissions, student section, accounts, exams, departments, training and placement, transport, canteen. • Delay from management in terms of operations and funding, the timely decision in the procurement of workforce, and equipment. |
| 6. Equipment Failures |
• Inadequate infrastructure to conduct theory classes and insufficient laboratory equipment to perform laboratory work. • Conduction of practicals is affected by the failure of laboratory equipment, machinery breakdown. • Classroom teaching is affected by the failure of teaching aids like LCD projectors, computers, internet. • Transportation is affected by bus failure. • Canteen – non-availability of raw material, vegetables, cooking gas. • Office – Failure of ERP, internet, telephone lines, etc. |
| 7. Measurement and Adjustment |
• Assessment of Staff – Appraisal to be done. • Wrong evaluation of students’ in examination |
| 8. Minor Stops |
• Less Attendance of students, Loss of lectures due to non-attainment of staff/student, holidays, strikes. |
| 9. Reduced Speed |
• Slow delivery of contents by the teacher. • More time is taken for learning and completion of the assignments by slow learners. • The syllabus coverage is not as per the teaching plan. |
| 10. Defect and Rework |
• Failure of students. • Extra or remedial lectures for the absent or fail students. |
| 11. Scheduled Down Time |
• Holidays, Preparation leaves, vacations. |
| 12. Yield |
• Scholarships, discounts are given to students. • Increase in the overhead cost of faculty and infrastructure due to cancellation of admission, non-recovery of fees, fewer admissions than proposed intake. |
| 13. Energy |
• Identify the loss of energy in electric power, fuel, water, air. |
| 14. Tool Die and Jig |
• Equipment related loss due to laboratory equipment, its maintenance, depreciation, replacement of old computers, teaching aids like LCD projectors, smartboards. |
| 15. Cutting Blade (Tool) Change |
• Laboratory set up for machine equipment to perform practical. |
| 16. Logistics |
• Material loading unloading at the workshop/laboratory. |
4 Total Productive Education
The above section discusses TPM, its pillars, tools applied for reduction of losses are also listed and explains OEE. The Total Productive Education (TPE) model for the education system is proposed on a similar basis. Education institutes have four major stakeholders – Students, Faculties, Employers (industries), and Society (Parents, friends, colleagues, relatives, etc.). Considering the interest of stakeholders four pillars are recommended for TPE in the education sector. Figure 4 shows the TPE pillar structure.
The house of higher technical education has four pillars with the base of students with grades 10 and 10+2 (for Indian scenario for diploma and bachelor’s degrees). The input quality of the students also affects the entire system and efficiency of the institutes. Depending on the merit quality of students’ pre-requisite bridge courses can be suggested.
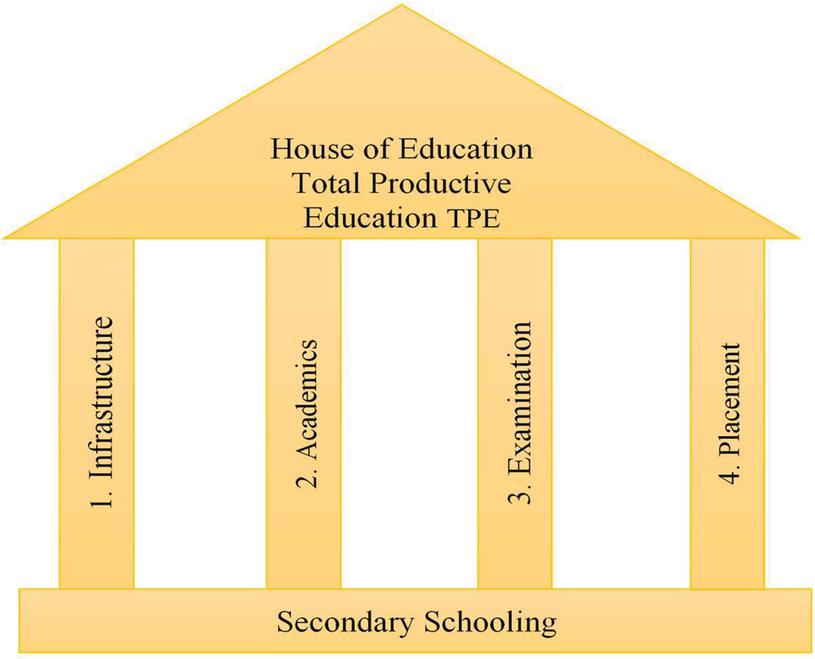
Figure 4 TPE Pillars.
Four pillars proposed for the TPE model are discussed in brief along with the TPM tools to be implemented for various TPE pillars.
1. Infrastructure:
Infrastructure for education institute consists of the land, buildings, laboratories, library (books, magazines & other related things), smart classrooms, facilities like canteen, transportation, hostels, playground, etc. Along with all these amenities, the institute should provide well-qualified faculties. Infrastructure is considered as the first pillar of TPM as it is necessary to have the set up to start the institute. Provision for future expansions in terms of land, building, and additional amenities needed along with the initial setup. The use of the TPM tools will help in this regard. Few tools are discussed herewith but are not to be limited.
TPM tools used in the infrastructure pillar are as follows:
i. 5-S – the 5-S system for cleaning, organizing, and maintaining a work area – classroom, library, laboratories, workshop, etc. to maximize efficiency and consistency.
ii. Kaizen – Promote kaizens for improvement and maintenance of infrastructure and effective utilization of the available resources.
iii. CLIT – Maintenance of laboratory and workshop equipment.
The tools discussed above gives the typical application related to infrastructure. In this regard, proper scheduling, execution, and monitoring system with different charts and plans are required for the implementation of the TPM concept. Implement TPM pillar – Initial Flow Management (IFM) for infrastructure planning.
2. Academics
Academics are the heart of the education system, consists of teaching the learning process, curriculum design, industry-institute interactions, research and publication, skill enhancement of the students, preparing students industry-ready. Academic pillars can focus on students, teachers, and the teaching-learning process. Curriculum design and update of the syllabus will be the base for the Academic Pillar. It is necessary to deploy an effective teaching-learning methodology for the proper delivery of the contents. Outcome-Based Education (OBE), Project-Based Learning (PBL), Activity-based learning (ABL), and recent teaching-learning methodologies to be adopted, thus enhancing learning outcomes. Implement the proper ratio of theoretical and practical content. While executing these various TPM tools can be used to increase efficacy.
TPM tools used in the Academics pillar are as follows:
i. Benchmarking – Referring to best practices from successful organizations to improve overall academic performance.
ii. Brainstorming – For curriculum design involving expertise with diverse experience from academics and industry.
iii. Gemba – Visit a workshop and laboratory to identify problems for conduction. Visit classrooms/ laboratories to observe the theory and practical delivery.
iv. Kaizen – Continous improvement in the teaching-learning process example -upgrade the teaching process with ICT.
v. CUDBAS – Curriculum Development Based on Vocational Ability Structure.
These are the few amongst TPM tools related to academics. Evaluating the performance of staff and students’ other TPM tools like Check sheets, Control charts, AQl is possible.
3. Examination
Examination performs the assessment and evaluation of students’ knowledge and skills. It is one of the significant departments, and the success of the university depends on the effective working of this department. Mode and conduction of examination are chief elements, failure of which results in degraded results/output and drop out of the students from the course.
Essential points in the examination to be considered are the exam pattern, assessment/marking scheme, supplementary exam, and result declaration. Reassessment may require after the declaration of result, as per students’ demand like after-sales service in the industry.
TPM tools used in the Examination pillar are as follows:
i. Kaizen – Promote kaizens for improvement of the exam process.
ii. 2 – Bin System – Proper inventory management for exam stationery and other material required.
iii. Poka-Yoke – Setup an error-free procedure for online and offline exams.
4. Placements
Placement reflects the effectiveness of the institution. Student placement is the outcome of the education system. The number of enrollment depends on the placement ratio of the university. If the students are getting jobs with a handsome package, admissions will increase, attracting more meritorious students. It enhances the quality of students in the university, thus making teaching-learning more effective.
TPM tools suggested for the Placement pillar are as follows:
i. 5 Why’s – Implemented to find the cause of deprived employment ratio.
ii. AQL – Improve the quality of students to make them employable.
iii. Benchmarking – Goal for more placements with good incentive packages.
iv. Brainstorming – Brainstorm with a focus to increase the number of placements and attract respectable industries for campus placement of students.
v. Cross-Training – Provide students with multi-skills. Prepare staff for multi-tasking.
Few tools are suggested for placements but are not limited. The education and Training pillar of TPM can be taken as a reference for the execution of the placement pillar.
5 Case Study – Implementation of TPE Model at Sandip University, Nashik
Using tools from Preventive Maintenance to identify the problems in the education institute. For illustration, a fishbone diagram shows students’ problems analysis [18]. Figure 5 shows the fishbone diagram considering students as the analysis point.

Figure 5 Fishbone diagram for identifying the root cause of students problem.
Figure 5 demonstrates the fishbone diagram for student problem as cause to be analyzed so represented as the head of the fish. The problem may be personal, related to the university, resources available, or academics. These areas identified form the wings of the fish. Further, for each problem, the cause is detected, and sub-branching is done, as the skeleton of fish. The solution is proposed based on the problem identified.
Sandip University, Nashik, Maharashtra, India, practices a few of the techniques of the proposed Total Productive Education.
A case study to identify the problems faced by students, and staff, was taken at Sandip University, Nashik. Students and staff problems identified are analyzed, and TPM tools are used o rectify them.
The problems identified from the root cause analysis of students identified the areas focused on in the education section. Problems faced by the students are categorized into seven headings mentioned below [19]:
1. Academics
2. Industrial visits/seminars/workshops/events
3. Research and development
4. Psychological problems of students
5. Infrastructure/ Sports
6. Financial
7. Placements
Each characteristic is dealt with in detail and the TPE tools are proposed.
1. Academics:
Academics is the foremost concern of students’ interest. The problem highlighted the teaching-learning process. Students are interested in practicals and industrial exposure than theoretical delivery. Experiential learning, as a solution, was implemented in a few courses.
For the course engineering graphics, students find it confusing to imagine the concept. As a part of experiential learning, small projects assigned related to specific topics, and students performed the group task to complete their projects.
Figure 6 shows the model prepared by the students for the course engineering graphics. Figures 6A and 6B explains the concepts of the development of solids for prism and pyramid. Development of the surfaces marked on the sheet, cut at the outline, and folded to get solid objects. Figure 6C shows a triangular pyramid and cube developed by the students. It helped the students to understand the concept as they have prepared it themselves. Similar to the application of sheet metal cutting is also cleared with this. A prepared solid model is used to imagine the projection of solids as their new topic. Figure 6D demonstrates the concept of projections of Lines. Instead of imagination, they can see the line in a different position and project it as per requirement.
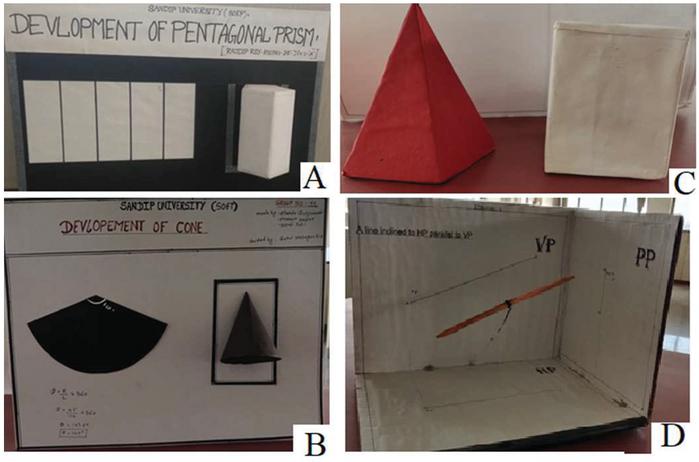
Figure 6 Models for Course Engineering Graphics.
For the course theory of machines, students’ were assigned to describe the component by explaining it with the help of a real object, as shown in Figure 7.
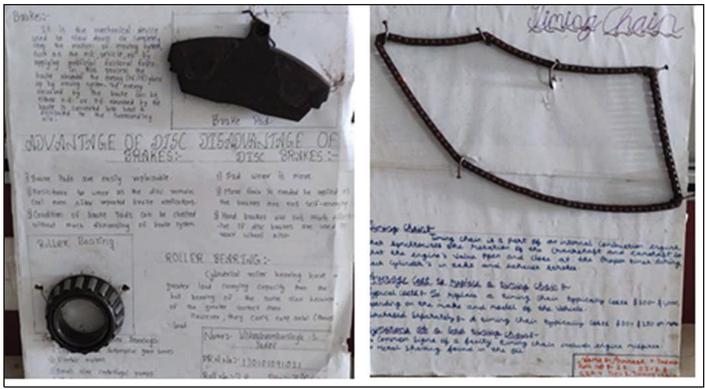
Figure 7 Assignment for Theory of Machine.
To study different mechanisms, students prepared mini working projects of the same as shown in Figure 8.
Figure 8 shows the models of the Oldhams coupling, Oscillating cylinder, Screw jack, and Geneva mechanism. Similarly, other models are prepared and presented by the students, which makes it easy to understand the working and application of the same.
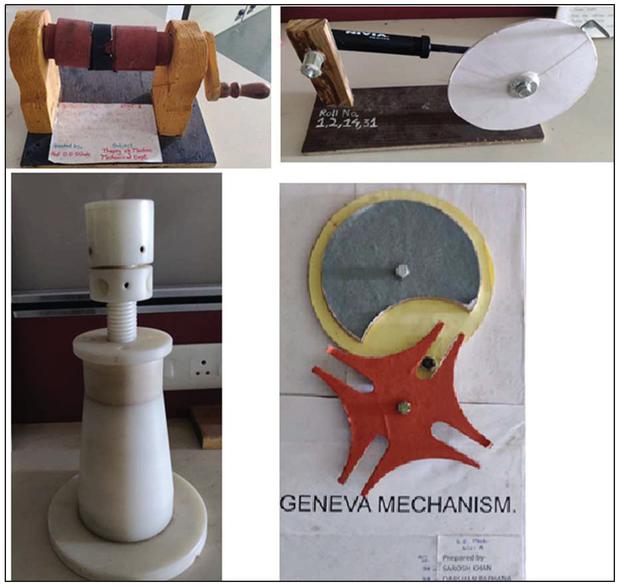
Figure 8 Mechanisms for course Theory of Machine.
Students’ group are assigned projects related to experiments to perform for a particular topic. Figure 9 shows the experimental setup prepared for the course Heat Transfer to find the emissivity of the test material.

Figure 9 Experiment setup for course Heat Transfer.
Figure 10 shows the setup prepared by students for the synthesis of a four-bar mechanism.
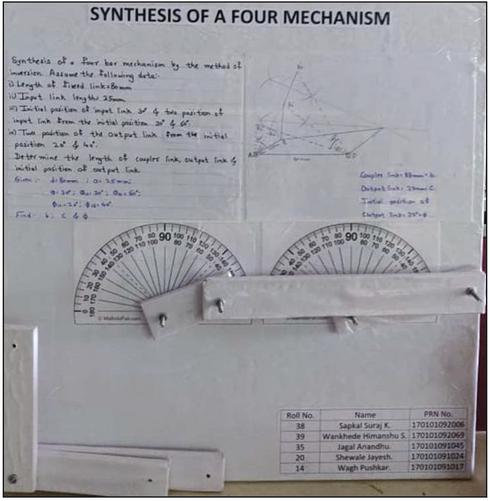
Figure 10 Experiment setup for course Theory of Machines.
In addition to this, mobile learning, project-based learning, activity-based learning is proposed [20]. In Sandip University, Outcome-Based Education (OBE) is implemented and practiced.
2. Industry/ workshop visit
Figure 11 shows the experimental learning performed for the subject manufacturing process, which also covers the industrial visit/workshop requirement of the students. Thus, giving practical exposure to the students to the equipment as they are studying and using them to perform the practicals in the workshop. The students visit the industry/workshop/site where they experience the working environment. They submit the report regarding their visit. Then they present the study and conclusion drawn from the visit. They are also given hands-on practice for computer-related topics.
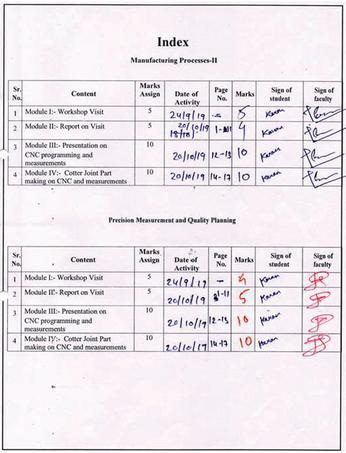
Figure 11 Index for Experiential learning for Manufacturing Process course.

Figure 12 Contents of the report of the above index.
Figure 12 shows some content from the experiential learning report of the course. The equipment/measuring instruments taught in the course manufacturing process/ metallurgy are used by the students while performing practices in the laboratory/workshop. It gives in-depth knowledge regarding the device to the students.
3. Research and Innovation
The guidance provided to inculcate the research culture and develop a habit of writing and presenting research articles. Seed funding provided to do presentations and projects. The technical competitions are organized for exploring the research among students. They are given exposure to the new emerging technologies by arranging expert lecture series regarding the topics related to curriculum and other than the curriculum.
4. Psychological problems of students
To address the psychological problems of the students’ counselor’s need to be appointed. They come from different cultures and financial conditions. Many times they need personal counseling. Students to be engaged in extra and co-curricular activities, sports, and competitions.
At Sandip University, students are having a Yoga and meditation session [21]. It helps the students to keep their mental peace. Figure 13 shows students performing yoga at Sandip University.

Figure 13 Students performing Yoga.
For enriching the interest of the students as per their hobby, various clubs formed like music, cycling, dance, drama, movie photography, where students get engaged. It helps in stress-relieving.
5. Infrastructure/ Sports
Other than academics, playgrounds and sports facilities are made available to the students. Various sports events’ are held to keep the students physically and mentally fit. It enhances the efficiency of the students and institutes as well.
6. Financial
Various scholarships attract meritorious students. The input quality of students affects the placement ratio of the institute. Along with merit, other scholarships like sports scholarships, scholarships for financially weaker students to be given.
7. Placements
Placement is the output parameter of the students. Students trained for multidisciplinary work by organizing workshops for improving communication skills, presentation skills, personality development of the students.
TPE pillars proposed and tools proposed to enhance the productivity of the education system was practiced in Sandip Unversity, established in 2016 with the regular pattern. The implementation of TPE started with the 5S tool. Outcome-based education implemented for academics since the academic year 2017. The results improved progressively. Infrastructural changes were also suggested and implemented for effective utilization of the classrooms, seminar halls, library, etc. The campus is 250 acres, having various buildings at different locations at long distances. Instead of the central library, shifted to separate buildings, as per the convenience of students to avoid the time loss and monitoring. Instead of two canteens, five canteens at different locations are made operational. The implementation shows positive results and improvement in the performance of the students and staff.
6 Conclusion
The TPM effectively implemented in industry improves OEE, and the industries March towards world-class excellence. The TPE model proposed in the paper and the results of its implementations show the effectiveness of TPE in the education sector. Various tools used for increasing productivity in the industry works well for institutes. 5S implemented at the department level helps to keep the workplace intact and assessable. TPM tools like Kaizen’s and Poka-Yoke helps to improve departments, avoids errors in systems, examinations, and other departments. Outcome-based education enhances the academic performance of the students. TPE pillars will help to build a system like TPM and its tools for the education system. TPE system in term will be the system to enhance productivity in the higher technical education system.
7 Future Scope
The paper proposes a TPE model for the education system based on TPM in industry. Taking a case study at Sandip University, Nashik, some of the implementations also discussed. However, the following scope for further research in this field is possible.
1. Four primary pillars are proposed and discussed in the study. There is scope for others as per the requirements.
2. Limited TPM tools are suggested in this paper for the implementation of TPE. The use of other TPM tools is possible for increasing the efficacy of TPE.
References
[1] N. Akshay, K. Sreeram, A. Anand, R. Venkataraman, and R. R. Bhavani, “MoVE: Mobile Vocational Education For Rural India.”
[2] Aspiring Minds, National Employability Report Engineers: Annual Report 2019. 2019.
[3] AICTE, “All India Council of Technical Education: Report 2017.” 2020.
[4] A. Jain, R. Bhatti, and H. Singh, Total productive maintenance (TPM) implementation practice: a literature review and directions, vol. 5, no. 3. 2014.
[5] F. Ireland and B. . Dale, “A study of total productive maintenance implementation,” Journal of Quality and Maintenance Engineering, vol. 7, no. 3, pp. 183–191, 2001.
[6] S.Nakajima, “Introduction to TPM: Total Productive Maintenance.pdf,” Product. Press. Cambridge, p. MA, 1988.
[7] M. Moradi, M. R. Abdollahzadeh, and A. Vakili, “Effects of implementing 5S on total productive maintenance: A case in Iran,” 2011 IEEE Int. Conf. Qual. Reliab. ICQR 2011, no. September, pp. 41–45, 2011.
[8] D. D. Shinde and R. Prasad, “Application of AHP for Ranking of Total Productive Maintenance Pillars,” Wirel. Pers. Commun., vol. 100, no. 2, pp. 449–462, 2018.
[9] A. J. De Ron and J. E. Rooda, “OEE and equipment effectiveness: An evaluation,” Int. J. Prod. Res., vol. 44, no. 23, pp. 4987–5003, 2006.
[10] O. T. R. Almeanazel, “Total Productive Maintenance Review and Overall Equipment,” Jordan J. MMechanical Ind. Eng., vol. 4, no. 4, pp. 517–522, 2010.
[11] I. H. Afefy, “Implementation of total productive maintenance and overall equipment effectiveness evaluation,” Int. J. Mech. Mechatronics Eng., vol. 13, no. 1, pp. 69–75, 2013.
[12] F. Nurprihatin, M. Angely, and H. Tannady, “Total productive maintenance policy to increase effectiveness and maintenance performance using overall equipment effectiveness,” J. Appl. Res. Ind. Eng., vol. 6, no. 3, pp. 184–199, 2019.
[13] A. Sutoni, W. Setyawan, and T. Munandar, “Total Productive Maintenance (TPM) Analysis on Lathe Machines using the Overall Equipment Effectiveness Method and Six Big Losses,” J. Phys. Conf. Ser., vol. 1179, no. 1, 2019.
[14] A. Zarreh, H. Da Wan, Y. Lee, C. Saygin, and R. Al Janahi, “Cybersecurity concerns for total productive maintenance in smart manufacturing systems,” Procedia Manuf., vol. 38, no. 2019, pp. 532–539, 2019.
[15] J. C. Meca Vital and C. R. Camello Lima, “Total Productive Maintenance and the Impact of Each Implemented Pillar in the Overall Equipment Effectiveness,” Int. J. Eng. Manag. Res., vol. 10, no. 02, pp. 142–150, 2020.
[16] S. Nallusamy, “Enhancement of productivity and efficiency of CNC machines in a small scale industry using total productive maintenance,” Int. J. Eng. Res. Africa, vol. 25, no. September, pp. 119–126, 2016.
[17] S. Nallusamy, V. Kumar, V. Yadav, U. K. Prasad, and S. K. Suman, “Implementation of total productive maintenance to enhance the overall equipment effectiveness in medium scale industries,” Int. J. Mech. Prod. Eng. Res. Dev., vol. 8, no. 1, pp. 1027–1038, 2018.
[18] D. D. Shinde, S. Ahirrao, and R. Prasad, “Fishbone Diagram: Application to Identify the Root Causes of Student–Staff Problems in Technical Education,” Wirel. Pers. Commun., vol. 100, no. 2, p. 665, 2018.
[19] D. D. Shinde and R. Prasad, “Triangular Model: Ultimate Regime to Enhance Efficacy in Technical Education,” J. Eng. Educ. Transform., vol. 33, no. 4, p. 64, 2020.
[20] D. D. Shinde and R. Prasad, “Mobile Learning: Steps towards Transforming Traditional Learning to e-learning,” Int. J. Emerg. Trends Technol., vol. 7, no. 7, pp. 16001–06, 2020.
[21] D. D. Shinde, M. Srivastava, and R. Prasad, “An Initiative to Enhance Productivity in Higher Education (Technical) Using Yoga Which Interconnect Human Mind and Body,” 6th Glob. Wirel. Summit, GWS 2018, vol. 17, pp. 190–193, 2018.
Biographies

Dnyandeo Dattatraya Shinde, D.M.E., B.E. (Mechanical), M.E (Design Engineering) is an Associate Professor, Director (Admissions), Sandip University, Nashik, India. He is doing a Ph.D. at Aarhus University. His research area is Manufacturing Engineering, Total Productive Maintenance, Design Engineering, Higher Technical Education.

Ramjee Prasad is the Professorial Chair of Wireless Information and Multimedia Communication at Aalborg University, Denmark (AAU) since June 1999. Since 2004 he is the founding Director of the Center for TeleInfrastruktur (CTIF), established as a large multi-area research center at the premises of Aalborg University.
Ramjee Prasad is a Fellow of IEEE, the IET, and IETE. He is a worldwide established scientist, who has given fundamental contributions to the development of wireless communications. He achieved fundamental results towards the development of CDMA and OFDM, taking the leading role by being the first in the world to publish books in the Subjects of wireless CDMA (1996) and OFDM (1999). He is the recipient of many international academic, industrial and governmental awards and distinctions of which the most recent is the cross of the order of chivalry (Ridderkorset of Dannebrogordenen) from the Danish Queen due internationalization of top-class telecommunication research and education. He is the founding chairman of the Global ICT Standardization Forum of India (GISFI) and was the founding chairman of the European Center of Excellence in Telecommunications known as HERMES of which he is now the honorary chairman. He is the founding editor-in-chief of the Springer International Journal on Wireless Personal Communications. He is a member of the editorial board of other renowned international journals including those of River Publishers.
Ramjee Prasad is a member of the Steering, Advisory, and Technical Program committees of many renowned annual international conferences including Wireless Personal Multimedia Communications Symposium (WPMC) and Wireless VITAE. He is a Fellow of the Institute of Electrical and Electronics Engineers (IEEE), USA, the Institution of Electronics and Telecommunications Engineers (IETE), India, the Institution of Engineering and Technology (IET), UK, and a member of the Netherlands Electronics and Radio Society (NERG), and the Danish Engineering Society (IDA).
Journal of Mobile Multimedia, Vol. 17_1-3, 1–26.
doi: 10.13052/jmm1550-4646.17131
© 2020 River Publishers