AMobileQoE: An SPL Framework to Measure the QoE of Android Applications
Antonio Collazo Garcia* and Sandra Casas
Instituto de Tecnología Aplicada UARG Universidad Nacional de la Patagonia Austral, Río Gallegos, Santa Cruz, Argentina
E-mail: acollazog11@gmail.com
*Corresponding Author
Received 29 August 2021; Accepted 20 October 2021; Publication 04 January 2022
Abstract
Mobile applications are increasingly present in most aspects of our daily life, satisfying the needs of information, communication, and entertainment. Different factors can degrade the performance of these applications or services, and users can undergo unsatisfactory experiences. To achieve acceptance of mobile applications by the user, it is necessary to consider the Quality of Experience, which allows to measure the quality of an application based on the user’s perception. This work presents AMobileQoE, an SPL framework to automatically generate the code necessary to analyse the QoE of mobile applications following the Design Science Research approach. It enables developers to generate more than a thousand different product configurations to measure QoE from a set of network, device, and user metrics. The CovidInfo application was developed to test the SPL framework in a real context with real users, showing the ease of integration and the lightness of the framework. Furthermore, a quality assessment was performed on AMobileQoE showing a high degree of modularity and variability.
Keywords: Mobile application, quality of experience, SPL framework, metrics.
1 Introduction
QoE is defined as the general acceptance of an application or service according to the subjective perception of the end user, and it is influenced by the context and the user’s expectations [1]. Despite the different definitions that have been proposed for QoE, they all emphasize the subjective nature and the preponderant role of the end user. Thus, some objective characteristics were incorporated [2] and the capacity of integrality and multidimensionality was granted [3].
The properties of the mobile environment are complex because they impose multiple factors that interfere with the QoE of end users. The quality of a mobile app is affected by the heterogeneity of hardware, operating systems, user preferences, the dynamics of mobility conditioned by the connectivity network infrastructure, the context (weather conditions, open/closed spaces), among other variables.
Quality of Service (QoS) has been related to QoE in several studies. It has been shown that a QoS degradation can lead to an unacceptable QoE. Some properties related to network performance, such as delay, jitter, packet loss, error rate, bandwidth, and signal success rate, are applied to determine the QoE value, depending only on the QoS calculation [4].
Although the number of factors and indicators to evaluate QoE is considerable, previous studies [5] show that the capabilities to integrate and combine metrics are limited in existing tools. These tools analyse a few properties in a fixed way. This makes it difficult to analyse the various factors that impact QoE. Diversity in the types of devices, applications, content, and users requires the capacity to perform different tests and assessments depending on the specific context and requirements. To address the limitations present in the approaches of the existing tools, AMobileQoE is introduced, a software product line (SPL) framework that supports a full and customizable QoE analysis of Android applications. It allows developers to generate more than a thousand different product configurations to measure QoE from different objective metrics (latency, jitter, packet loss, memory, CPU, etc.). Two evaluations were applied to AMobileQoE. The first consisted of the use of AMobileQoE to generate different configurations in a real app, which was tested in an unsupervised field study. The second was an assessment of the quality of the SPL, where the results indicated a high level of supported variability.
SPL is a set of systems that share common and variable features to satisfy specific requirements [6]. It is built from a common set of software components with points of variability that allow the generation of multiple product configurations [7, 8]. The use of SPL brings significant improvements to the software development process [6, 9] in terms of costs, time to market, productivity, quality, and flexibility [7].
The rest of the article is structured as follows: Section 2 describes the research method based on the design science research approach. Section 3 introduces the main concepts about software product line and feature models. Section 4 presents the developed SPL framework for Android applications. Section 5 presents a real application as a case study from the SPL framework. Section 6 shows the quality assessment of the SPL. Section 7 presents related works. Finally, Section 8 presents the discussion and conclusion of the findings.
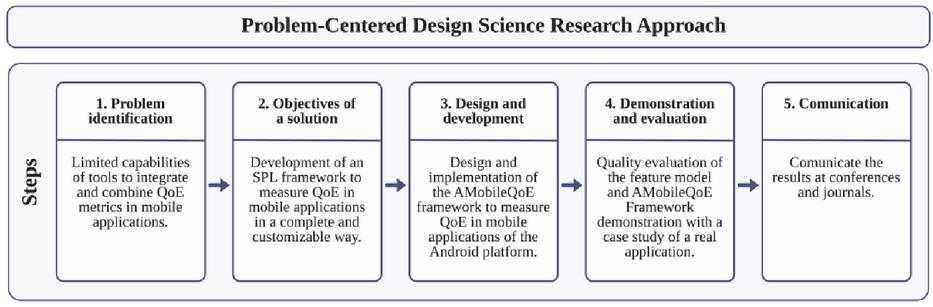
Figure 1 Design Science Research approach.
2 Methodology
In this work, the approach called Design Science Research [10] was applied. It is generally used in research related to engineering, computer science, and information systems. It proposes the production of artifacts, such as instances, constructs, models, or methods. Figure 1 shows the steps that have been followed in this study. The first step (1) was the Problem identification for which a solution is sought. The second step (2) was to set the Objectives of an inferred solution of the identified problem that helped determine the requirements of the framework. The third step (3) was the Design and development of the framework that represents a solution to the problem. Here, the Feature Model [11] approach was used for the construction of a generic model. Java language, FreeMaker library, and Android Studio IDE were used for the development of the AMobileQoE framework. The fourth step (4) was the Demonstration and evaluation with CovidInfo, a real application which was developed to be used by real users in a daily context. Furthermore, this step was completed with the evaluation of the model quality, using a specific method proposed in Montagud (2009). The fifth and the last step (5) was the Communication of results that is being carried out through this work. In addition, the case study was reported at the International Conference of the Chilean Computer Science Society (SCCC) [5].
3 Software Product Lines and Feature Models
SPL [12, 6] is an approach to developing families of systems based on using reusable assets to improve software quality and reduce production costs and time to market. The products developed with an SPL are specified in terms of various features. A feature is defined as an increase in the functionality of the product, and an SPL can offer both common and variable features.
Typically, the process of feature-based software product line is divided into four phases or steps [13], as shown in Figure 2. In the first phase, the domain is analysed to define the scope of the domain, that is, to decide which products should be covered by the product line and, consequently, which features are relevant and should be implemented as reusable artefacts. Next, in the domain implementation phase, the reusable artefacts that correspond to the features identified in domain analysis are developed. The needs of a specific product are analysed in the phase of requirements analysis. These requirements are mapped with the features identified during domain analysis. Finally, in the product derivation phase, reusable artefacts are combined to generate specific products based on feature selection and implementation.
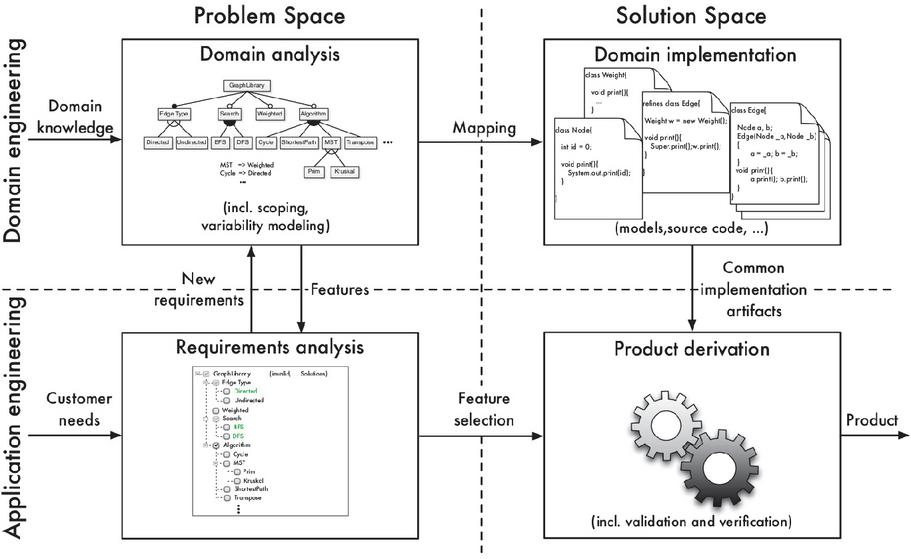
Figure 2 Phases of feature-based software product line development.
A Feature Model (FM) [14, 15] can be used to provide a compact representation of all products of a software product line in terms of features and relationships between them. FMs can specify which elements of the product family are similar or variable throughout the development life cycle. In addition, FMs can incorporate a set of rules in the form of logical expressions formed by features, logical connectives, and quantifiers.
Figure 3 shows that the FM nodes represent features, and the lines indicate the relationships between them. The root node, A, represents the domain concept being modelled. The features are classified as mandatory, optional, or alternative. Optional features, such as node C, are represented with an empty circle and may or may not be part of a product. Mandatory features, such as nodes B, D, and E, are represented by a filled-in circle and will be part of all products that the SPL can generate. Alternative features can be exclusive (XOR) or nonexclusive (OR). XOR (“Alternative”) indicates that only one subfeature can be selected, e.g., F or G; while OR (“Or”) allows more than one option to be selected for a product, e.g., H or I or both H and I. Besides, the diagram includes abstract and concrete features. Feature A, which is abstract, represents an interface; and the rest, which are concrete, are the features that implement the functionalities. FMs can also be specified through textual notations [16].

Figure 3 Feature Model representation.
Several tools [17] support the development of feature-oriented software. However, most of these tools are developed for academic purposes, and therefore, should be considered more as prototypes rather than as full-fledged tools. On the other hand, the full-fledged tools like FeatureIDE do not have support for Android Studio, which is the official Integrated Development Environment (IDE) for Android app development.
The proposed framework (AMobileQoE) has been developed following the steps in Figure 2. In AMobileQoE, the FM features represent QoE metrics with the particularity that all features are optional. This increases the number of different product configurations that can be generated. The complete description of steps and the feature model is presented in the next section.
4 AMobileQoE Framework
In this section, we present AMobileQoE, a new QoE framework, following the phases of feature-based software product line development [13].
4.1 Domain Analysis
The proposed approach focuses on defining an SPL to separate and independently manage the metrics for QoE analysis. The strategy allows metrics to be integrated and combined to generate different product configurations for different devices.
A key element in creating an SPL is the specification of the common and variable features of all similar products that the SPL will produce. In this work, all features are variable and related to QoE metrics. The features are classified into three groups: QoS metrics (Q); metrics related to the consumption of device resources (D); and user metrics (U). Each of these is described in Table 1. The list of metrics has been selected from a literature review carried out in a previous study [5].
Table 1 QoE metrics considered in SPL
| Metric | Description | Group |
| Latency | The time it takes for a packet to travel from origin to destination. | Q |
| Jitter | Variation in the arrival time of the packets. | Q |
| Packet loss | Amount of data packets that do not reach their destination. | Q |
| Bandwidth | Available capacity of a network link. | Q |
| Network type | Connection type used by the mobile device. | Q |
| Cpu | Capacity of the processor used by an application. | D |
| Memory | Amount of memory (RAM) used by an application. | D |
| User perceived latency | Time spent by the user waiting for a response from the application to a specific action. | U |
| User opinion | Users’ general level of satisfaction with the application. | U |
From the features identified above, the artefacts that support the software product line are built. As a result, the feature model presented in Figure 4 is defined. The model shows the features that represent the metrics of QoE.
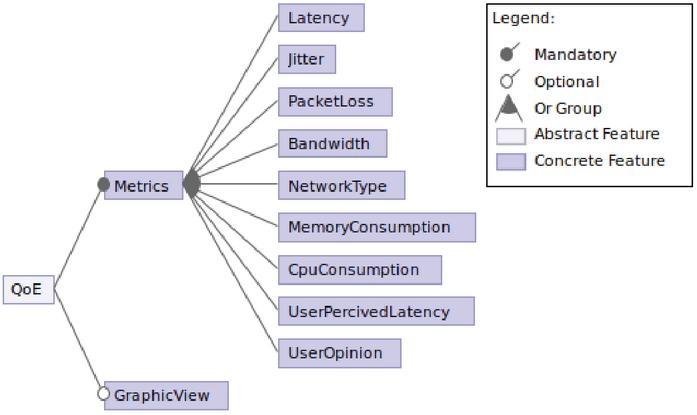
Figure 4 Feature Model.
The QoE feature is abstract and is defined to structure the model. This feature does not have an impact at the implementation level. The Metrics feature is intended to encapsulate the metrics that will be measured during the application execution, where all are optional. Another feature in the model is GraphicView, which intends to represent the captured values in line graphics.
Based on the defined FM, which represents a family of products, the SPL can compose different products by selecting the features that will be part of these. For example, a product derived from the selection of the features MemoryConsumption and GraphicView will record the memory consumption of the application and a line graph will represent the recorded values over time.
The modelled SPL and composition rules defined to address the variability of metrics are simple but offer significant configurability, considering that the SPL allows for 1022 different product configurations. The number of valid configurations (VCs) or valid products that can be derived from the SPL is calculated from the FM. In fact, we have constructed the following formula based on the combinatorial formula and the feature model structure:
| (1) |
where the VCs are calculated from the sum of all the combinations (C) formed from a total of 9 features and a selection of i features. Finally, this result is multiplied by 2 because the GraphicView feature is optional and doubles the total of possible combinations.
4.2 Domain Implementation
The framework was developed to facilitate its integration with the application. Thus, the process to add the metrics would be quick, easy, and at any time during the development of the application. In addition, another objective was to interfere as little as possible in the developer’s code. On the other hand, the library generated by the framework only includes the necessary code for the selected metrics, obtaining a lightweight library.
With respect to the dimensions of variability proposed by Apel [13], the SPL framework was developed with an implementation technique that supports compile time binding. It enables developers to decide which features to include in the product before compile time. Thus, all unnecessary code will be removed from the final product, reducing run-time overhead. A language-based approach was another implementation technique used in the framework, in which the feature and implementation code are located in the source code. This makes it easy for developers to analyse and understand the whole code. Also, the composition-based approach was applied to separate the logic of each feature in different units of code.
Figure 5 shows the class diagram of the general structure implemented. The first level contains the main class “MetricQoE” which starts and executes each of the metrics. Furthermore, at this level is the “MetricListener” interface, which defines the method to access the metric values obtained during the execution of the application. Furthermore, the “ChartViewActivity” class corresponds to the ChartView feature that implements the previous interface to listen to the metric values and display them into line charts. The second level contains the features that encapsulate the logic and code to measure each of the QoE metrics.
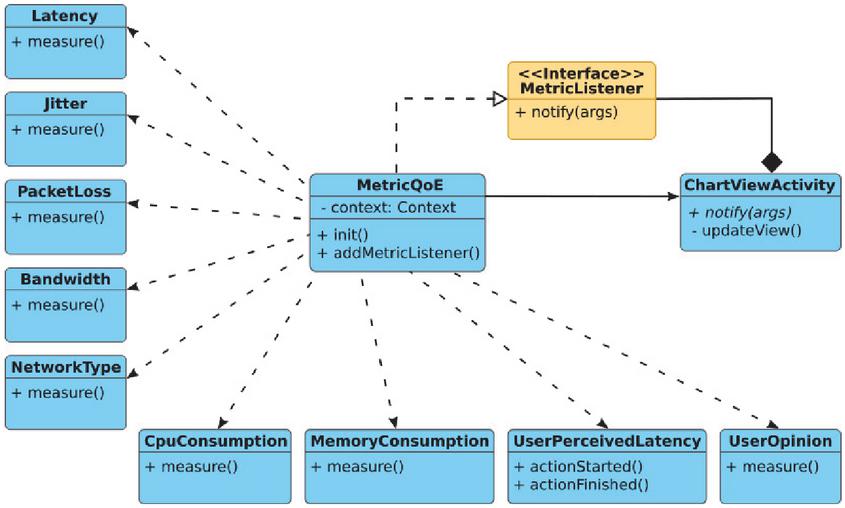
Figure 5 Class diagram.
The framework was developed to be integrated with Android Studio since it is the official Integrated Development Environment (IDE) for Android app development [18]. The features (metrics) of the feature model were implemented using Java as the programming language. For the generation of the code from the FM, a template engine was used that contains the code of the features because Android Studio uses this mechanism to generate the base code.
The SPL was implemented using FreeMarker Template Language (FTL) [19]. FreeMaker is a template engine and a Java library to generate text output (HTML web pages, e-mails, configuration files, source code, etc.) based on templates and changing data. This library is used by Android Studio to generate basic projects from templates. Thus, the SPL is integrated with Android Studio to specify the features and generate the code that measures the metrics of QoE.
The template files contain the Java code, but with FTL instructions to take action to the received parameters. For example, Figure 6 shows a portion of code from the template file “MetricQoE.java.ftl”. In this figure we can see the notations “#if memoryConsumption” and “/#if” that contain the Java code to declare and execute the “measureMemoryConsumption()” method. This will generate a Java code file that will contain the “measureMemoryConsumption()” method only in case the template is run with the memoryConsumption value being TRUE. Otherwise, if the template is run with the value FALSE, the resulting file will not contain this method. Thus, it is guaranteed that the resulting library only contains the code required for the desired features.

Figure 6 Portion of the code of MetricQoE.java.ftl template file.
The library begins metric measurement at the start of the application execution, it only needs to be called in the “onCreate” method of the “Application” class. Therefore, it is not necessary to add an additional code within the functional code of the application. The library is created from the selected features and only includes the necessary code for those features. Thus, the library does not contain an unnecessary additional code, avoiding affecting the weight and performance of the application.
The measured data of each metric are collected in real time during the application execution. At the moment each metric is measured, this value is notified to all subscriber objects. Thus, the application can know the value of each metric at all times and make decisions about network consumption, application performance, among others.
4.3 Requirements Analysis
The integration of the templates with the Android Studio IDE requires the definition of several files. These files contain the location of the templates and the definition of the parameters to generate the final code. Figure 7 shows a portion of the code from the “template.xml” file with the definition of the “memoryConsumption” parameter.
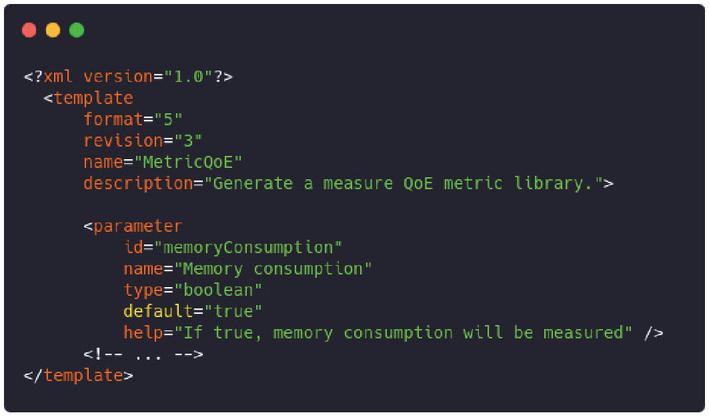
Figure 7 Portion of the code of template.xml file.
The “template.xml” file mentioned above is also used by the IDE to build the visual interface that allows the developer to add the library with the metric implementation of the selected metrics. Figure 8 shows the interface built by the IDE where the metrics to be included in the library can be selected. In this case, only the “Memory consumption” metric is selected, which will generate a library with only the code to measure the memory consumption by the application.
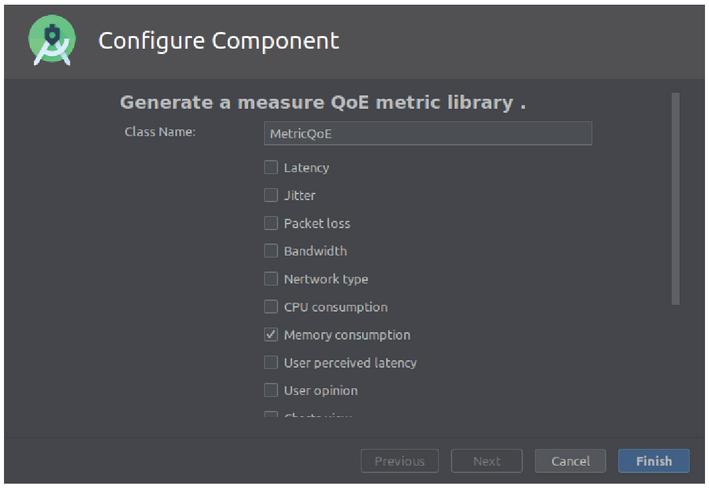
Figure 8 Android Studio interface to select metrics.
4.4 Product Derivation
Finally, Figure 9 shows the steps of how to use the framework to generate different product configurations. Step 1 represents the developer who is developing a particular Android application. In Step 2, using the Android Studio IDE, the developer selects the desired QoE metrics to measure in the application. Step 3 corresponds to the library generated from the metrics selected in the previous step. This library will only contain the code associated with the selected metrics. Step 4 represents the applications that can be built from different metrics configurations. These applications are used by several users, in different contexts, and with different expectations. Thus, in step 5, the metric values that are measured by the library within the application are collected. In this step, the developer can decide what to do with these values (to store in files, to send to a server, among others). Finally, the analysis of the metric values enables developers to get feedback on the performance and behaviour of the application in different contexts. Thus, the developer can take specific actions to improve some performance aspects of the application.
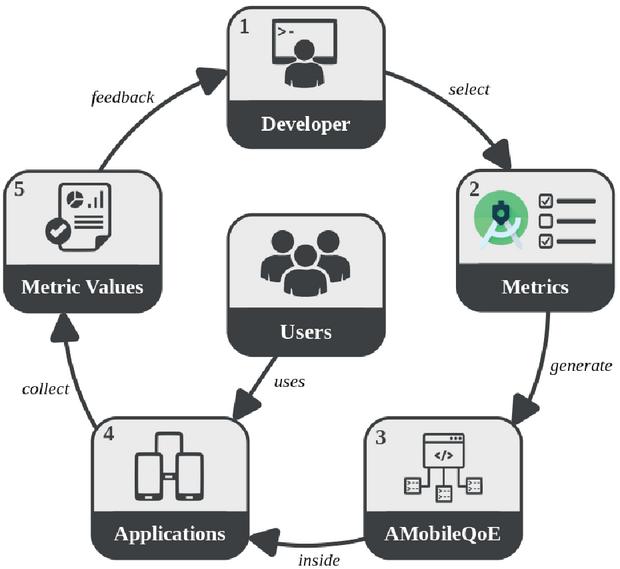
Figure 9 AMobileQoE framework steps.
In general, the framework is used from two points of view. The first is from the developer side. The developer interacts directly with the framework to generate a QoE library with the code necessary to measure a set of selected metrics. This library is integrated with the application in which the developer wants to perform the measurements. On the other hand, once the app is compiled, it is used by different users who interact with the functionalities implemented by the developer. The moment the user starts using the application, the framework starts executing the QoE library to measure the metrics, but it is transparent to the user without affecting its performance.
5 Case Study
The purpose of this section is to demonstrate the SPL Framework in a real application. For this, more than one configuration was generated for a native Android application showing the capacity to generate different tests according to different contexts. Then, for each configuration, different metrics were selected showing the flexibility and capacity to record the required metric values for a more detailed analysis.
The application developed was CovidInfo. It is an academic-technological development of the Research and Transfer Center of Santa Cruz (CIT Santa Cruz) and the Applied Technology Institute (ITA UARG-UNPA). Its objective is to provide updated information on the COVID-19 pandemic. Figure 10 shows some screenshots of the application. CovidInfo is available for download from https://gispunpauarg.github.io/CovidInfoUNPA. CovidInfo was available for free download from May 18 and the tests were carried out with the data collected until June 3 (17 days).
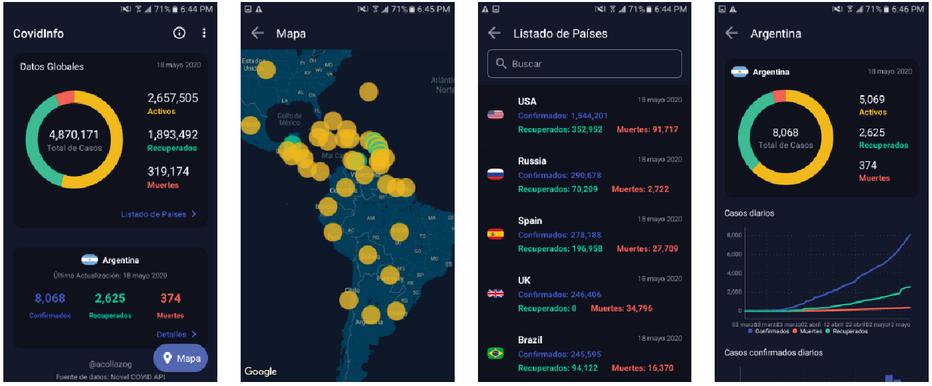
Figure 10 CovidInfo screenshots.
Three different configurations of CovidInfo were generated with the AMobileQoE framework. Each configuration refers to a different compilation of the CovidInfo application, resulting from the selection of a different set of metrics (features). The configurations targeted different countries with specific metrics. Table 2 shows the selected features (metrics) and target countries for each configuration..
Table 2 Specification of metrics and countries by configuration
| Configurations | |||
| Metric | C1: Argentina | C2: Cuba | C3: Rest of the world |
| Latency | x | x | |
| Jitter | x | ||
| Packet loss | x | ||
| Bandwidth | x | ||
| Network type | x | ||
| Cpu | x | x | |
| Memory | x | x | |
| User perceived latency | x | x | |
| User Opinion | x | x | x |
Many configurations can be generated for an application. In this case, only three were generated as a test. The target countries were selected with the aim of reaching a similar number of users per configuration, since the dissemination was mainly oriented to Argentina and Cuba (social networks, emails, direct contacts, etc.). On the other hand, the number of metrics in each configuration was made to show the power of AMobileQoE, which allows you to select all the metrics, a few, or even a single metric. The user opinion metric was added to each configuration because it represents the subjective value of QoE. Then, most of the metrics (CPU, memory, latency, jitter, bandwidth, packet loss, and user perceived latency) were added to the first configuration (Argentina); latency metrics (latency and user perceived latency) were added to the second configuration (Cuba); and finally, metrics related to the consumption of device resources (CPU and memory) were added to the third configuration (United States, Brazil, Spain, Mexico, Guatemala, Uruguay, Bulgaria, Germany, Czechia, Australia, India, and Honduras).
During the 17 days, CovidInfo was downloaded and used by 101 users and a total of 27914 metrics values were recorded. A part of these results have been published in [20]. Table 3 shows the details of users and records by configurations. The amount of records depends on the quantity of users and measured metrics in each configuration.
Table 3 Amount of users and records by configuration
| Configuration | Users | Records |
| C1 | 51 | 24818 |
| C2 | 29 | 1948 |
| C3 | 21 | 1148 |
| Total | 101 | 27914 |
Due to the different number of users and metrics in each configuration, a different number of records was obtained in each one. Therefore, percentage values were used to make the comparisons. Figures 11, 12, and 13 show the proportion of recorded values for each metric in the three configurations. Each bar represents the proportion of the qualitative values with respect to the total values collected for each metric, representing good metric values in green, regular metric values in yellow; and bad metric values in red.
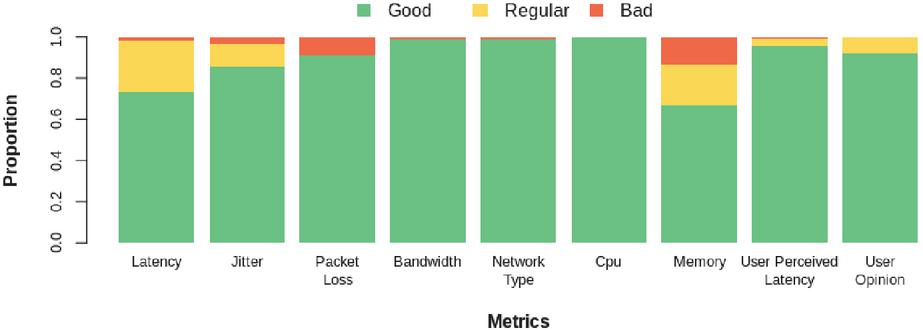
Figure 11 Configuration 1.
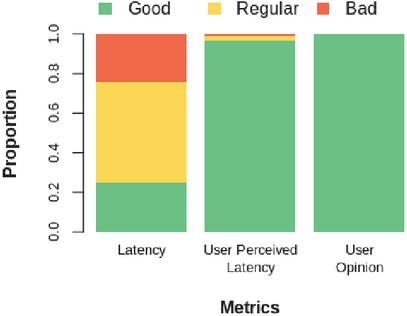
Figure 12 Configuration 2.

Figure 13 Configuration 3.
As seen in configurations 1 and 3 all the metrics exceed 69% of good quality values. However, latency and memory were the most affected metrics, although to a lesser extent. Thus, some points to improve in the application can be identified. On the other hand, in configuration 2, the latency was quite affected, reaching only 25% of good quality values. This was due to the fact that in the country where these tests were developed, users did not have a high-speed connection.
The weight of the code generated by the framework for measuring metrics was also analysed. For this, the weight of the CovidInfo application without the code generated by the framework was compared with the weight of the configuration in the worst case that can be generated. The worst case corresponds to the configuration in which all the metrics are selected and all the code is included to measure each of them. The application without the code for metric analysis registered a weight of 6249.96 kilobytes, while the application with the generated code for the worst case registered a weight of 6257.99 kilobytes. In this way, the maximum weight that the code generated by the framework for QoE analysis occupies is 8.03 kilobytes, which represents only 0.13% of the total weight of the application. This shows that the framework is lightweight and does not affect the weight of the final application.
6 SPL Evaluation
This section shows the SPL quality evaluation using the method proposed in [21]. This method is based on the SQuaRE quality standard: System and Software Quality Requirements and Evaluation [22]. Specifically, this method was used to evaluate the maintainability of the SPL. A high degree of maintainability indicates that the structure of the product facilitates the execution of future modifications. This property is one of the most evaluated properties for SPLs since it considers their modularity and reusability. Modularity analyses the active ratio per feature, and reusability uses four metrics to independently mediate commonality and variability. Commonality is evaluated taking into account aspects related to the reuse of assets, because they are common parts of different products, and variability is evaluated based on the richness and complexity of the SPL.
The purpose of the evaluation is to assess the maintainability quality. The product to be evaluated is the feature model defined in the SPL and the quality model to be used is shown in Table 4. Based on the selected quality characteristic and the software artefact to be evaluated, the selection of the metrics is made.
Table 4 Maintainability quality Model
| Sub-characteristics | Attribute | Metric | |
| Modularity | SPL Modularity | Asset Ratio by Feature | |
| Commonality | Functional commonality | Functional coverage of an asset | |
| Applicability of an asset | Cumulative applicability | ||
| Reusability | |||
| Variability | Coverage of variability in an asset | Variability coverage | |
| Complexity of SPL variability | Number of variabilities in the SPL | ||
Table 5 Quality evaluation
| Functional | Variability Coverage | Applicability of | Complexity of | ||
| Attribute | SPL Modularity | Commonality | in an Asset | an Asset | SPL Variability |
| Metric | Asset ratio by feature | Functional coverage of an asset | Variability coverage | Cumulative applicability | Number of variabilities in the SPL |
| Formula | X A / B A number of assets to be developed in the SPL. B number of features in the FM. | FC S / N A number of applications using functional feature i. B total number of applications in the SPL. S sum of A / B for each i from 1 to N. | VC A / B A number of implemented points in the asset. B number of points of variation within the scope of the SPL. | CA 0.5 * FC + 0.5 * VC FC functional coverage of an asset. VC coverage of the variability of an asset. | V (A + B) / N A number of alternative features. B number of optional features. N total number of features |
| Result | X 10 / 11 X 0.9 | FC 5 / 10 FC 0.5 | VC 1 / 10 VC 0.1 | VC 0.5 * 0.5 + 0.5 * 0.1 VC 0.3 | V (0 + 10) / 11 V 0.9 |
| Analysis and conclusion | The modularity of the SPL is accepted: high values favor the derivation of products. In the model, only one feature is not covered by any asset. | The functional features have an average commonality. Each functional feature will be part of half of all products generated by the SPL. The degree of reuse of the features is medium. | The value is accepted: indicates that most assets are covered by a point of variation of the SPL. At a higher value, there is less coverage of the variability of the asset. | The low value indicates that the assets are less applicable for developing several products. They do not apply to more than half of the products generated by the SPL. | This value is accepted: most features are optional and present a high variability. |
The possible values of the metrics are continuous values between 0 and 1. Being subjective values, we consider each attribute evaluated as accepted or not accepted, for an independent reason. Following the evaluation plan, the metrics to apply to the SPL have been selected. Table 5 presents for each metric the formula to calculate it, the resulting value, and finally in the last row it presents the conclusion of the results based on the thresholds defined in the proposed method [21].
The SPL framework presented high modularity and variability, and a medium degree of reuse of features. However, the applicability of an asset did not reach good values, because each asset does not apply to more than half of the products. This is due to the high value of variability, since the feature model has the characteristic that all features are optional.
7 Related Works
This study presents an SPL framework to analyse the QoE in mobile applications. From this, two directions for related work were identified. The first, on tools for QoE analysis addressed in Section 7.1, and the second on the development of software product lines for mobile applications, addressed in Section 7.2.
Table 6 Tools to analyse QoE of mobile applications
| Tool | Amount of Metrics | Supports Customization |
| QoE Doctor [23] | 3 | No |
| Prometheus [24] | 5 | No |
| AppInsight [25] | 1 | No |
| Proteus [26] | 3 | No |
| Timecard [27] | 1 | No |
| Panappticon [28] | 1 | No |
| YoMoApp [29] | 2 | No |
| Mobile Agent [30, 31] | 9 | No |
| QX-probe [32] | 3 | No |
| AMobileQoE | 9 | Yes |
7.1 Tools to Analyse QoE
Several frameworks, methods, algorithms, and tools to analyse the QoE of mobile applications have been addressed by different authors. In a previous work [5], we conducted a systematic mapping study in which the tools presented in Table 6 were identified. The last row of the table corresponds to the tool proposed in this study. Thus, the number of metrics and the customization supported by the tools are represented, which are the main distinguishing features that we consider in our proposal.
These tools combine objective and subjective metrics for QoE analysis of mobile applications, as well as automatically collect and calculate the values of the metrics. However, they present a wide dispersion of metrics and do not support customization. Therefore, these tools make it difficult to perform an integral and customizable QoE analysis in mobile applications due to the limited approaches they present. The main contribution of our work to this problem is the implementation of an SPL framework that has the capacity to perform an integral and customizable QoE analysis. Thus, AMobileQoE enables developers to create different configurations of QoE metrics to perform different tests according to their requirements.
7.2 SPL for Mobile Applications
A second direction about software product lines for mobile applications has been studied.
A Nested SPL for the domain of mobile and context-aware applications is presented in [33]. The authors chose the Mobile Visit Guide domain and built a product configuration of the proposed SPL called GREat Tour Mobile Guide.
MSPLearning is proposed in [34], which is one SPL focused on the mobile learning applications domain. The main goal of MSPLearning is to provide benefits about the overall quality, domain comprehension, and reduction of the time spent in the development and maintenance of m-learning applications.
A domain model for building a software product line is proposed in [35]. The authors propose building a software product line for mobile collaboration in the emergency management domain, as there is a need for different products depending on user types, fire company needs, and evolving requirements.
In [36] a meta-model to bridge the gap between an application SPL and a mobile device is presented. The framework ApplIDE was implemented to support the meta-model approach. The main contribution of the authors was the combination of device and application feature model, supporting both device variability and application variability. The approach was validated using the Customer Relationship Management (CRM) domain.
Five architectural styles for developing software product lines of Android apps were proposed in [37] to simplify large-grained reuse and to easily create Android app SPLs. The authors built a SPL as a case study for the image processing domain using these architectural styles, demonstrating a large amount of reuse.
The main objective of these works is to build a software product line for mobile applications, where the configurations are functional products that respond to a specific domain. In contrast, the approach of the AMobileQoE framework is independent of the domain of the application, with the aim of measuring the QoE of the application interfering as little as possible in the developer’s code.
8 Discussion and Conclusions
In this paper, we presented AMobileQoE, an SPL framework to automatically generate the necessary code to analyse the QoE of mobile applications following the Design Science Research approach. Main concepts about software product lines were introduced. The SPL framework was presented together with the defined feature model and QoE metrics. An application (CovidInfo) was developed to test the SPL framework in a real context and a quality assessment of the SPL was performed.
The discussion is addressed in two lines, the first about the contribution of the AMobileQoE framework for the measurement of mobile QoE, and the second about aspects of the particular design and implementation of the FM and SPL that support the tool.
The related works about tools to analyse the QoE in mobile application present limited approaches. Those studies present a wide dispersion of metrics and offer a little support when analysing only certain quality attributes. The AMobileQoE framework presented in this work enables developers to choose the configuration of QoE metrics that they need to analyse. Therefore, the main difference of this study is the capacity to perform an integral and customizable analysis of QoE. On the other hand, the related works that are focused on building a software products line for mobile applications respond to specific domains. In contrast, the approach of the AMobileQoE framework is independent of the domain of the application. The library generated from the selected features represents a complement to the application to evaluate the QoE without intervening in its operation.
CovidInfo application allowed us to test the SPL framework with a real application. Distinct metrics values for each configuration were collected, showing good metrics values. Except for the second configuration, where only 25% of the latency values were good, the rest of the metrics in the three configurations presented good values above 65%. Thus, we have shown that the proposed tool enables developers to build different settings with minimal effort and obtain specific test results for each configuration.
On the other hand, SPLs in general and in particular for mobile apps, are defined and built to generate families with at least some common “asset” or feature that is later made mandatory and varies according to other optional features. In contrast, the proposed approach does not contemplate any common features, they are all optional, which from combinations without feature restriction (metrics) allow the automatic generation of more than a thousand different products. This has been verified in the quality evaluation of the SPL, which yielded good results. The SPL framework presented high modularity and variability, and a medium degree of reuse of features. However, the applicability of an asset did not reach good values, because each asset does not apply to more than half of the products. This is due to the high value of variability, as the feature model has the characteristic that all features are optional.
The proposed design, based on FM, has strengths. First, since each metric is encapsulated in a feature, it allows -with little effort- to incorporate new QoE metrics without the need to modify the model. Second, the FM that supports the framework, being generic and abstract, is applicable for its implementation on other mobile platforms.
The AMobileQoE framework was fully implemented because the tools for developing a feature-oriented SPL do not have support for Android Studio. Therefore, the steps, techniques, and approaches proposed by Apel for the efficient implementation of software product lines were applied. From this point of view, how the implementation has been carried out allows it to be adopted for other platforms.
The limitations of this study are in the composition mechanisms of the SPL of the AMobileQoE framework. The developer must compile the project each time it is required to compose a new configuration of a test or to decouple a configuration already integrated into a particular app. Although all of these processes are transparent to the developer, they indicate that there is a level of unwanted coupling. This drawback can be critical since the QoE measurement on a particular app is a non-central and temporary functionality.
Future work is aimed at incorporating new QoE metrics to the AMobileQoE framework, which will result in more test configurations. Furthermore, it is necessary to improve the composition and decoupling of the features to each configuration to reduce or eliminate the need for compilation.
Acknowledgment
This project was partially funded by the National University of Southern Patagonia – UNPA (Argentina) and the National Council for Scientific and Technical Research – CONICET (Argentina). Finally, we would like to thank LaIC, the Scientific English Laboratory at UNPA, for reviewing the English text.
References
[1] ITU-T. Definition of Quality of Experience (QoE). International Telecommunication Union, 2007.
[2] ETSI TR 102 643. Human Factors (HF); Quality of Experience (QoE) requirements for real-time communication services. Technical report, 2010.
[3] Selim Ickin. Quality of Experience on Smartphone: Network, Application, and Energy Perspectives. PhD thesis, Blekinge Institute of Technology, Faculty of Computing, 2015.
[4] Piotr Nawrocki and Adrian Sliwa. Quality of experience in the context of mobile applications. Computer Science, 17(3):371, sep 2016.
[5] Antonio Collazo Garcia and Sandra Casas. Quality of Experience in Mobile Applications: A Systematic Mapping of Metrics and Tools. International Journal of Interactive Mobile Technologies (iJIM), 14(08):126–139, may 2020.
[6] Klaus Pohl, Günter Böckle, and Frank Van Der Linden. Software product line engineering: Foundations, principles, and techniques. Springer Berlin Heidelberg, 2005.
[7] Paul Clements and Linda Northrop. Software Product Lines: Practices and Patterns. Boston, MA, 2001. Addison-Wesley Longman Publishing Co., Inc.
[8] Frank J Van der Linden, Klaus Schmid, and Eelco Rommes. Software product lines in action: the best industrial practice in product line engineering. Springer Science & Business Media, 2007.
[9] Alcemir Santos, Felipe Gaia, Eduardo Figueiredo, Pedro Santos Neto, and João Araújo. Test-based SPL extraction: An exploratory study. Proceedings of the ACM Symposium on Applied Computing, pages 1031–1036, 2013.
[10] Ken Peffers, Tuure Tuunanen, Marcus A. Rothenberger, and Samir Chatterjee. A design science research methodology for information systems research. Journal of Management Information Systems, 24(3):45–77, dec 2007.
[11] Don Batory. Feature models, grammars, and propositional formulas. In Lecture Notes in Computer Science (including subseries Lecture Notes in Artificial Intelligence and Lecture Notes in Bioinformatics), volume 3714 LNCS, pages 7–20. Springer, Berlin, Heidelberg, 2005.
[12] Paul Clements and Linda Northrop. Software product lines: Practices and patterns. In SEI series in software engineering, Boston, MA, 2002. Addison-Wesley Professional.
[13] Sven Apel, Don Batory, Christian Kästner, and Gunter Saake. Feature-Oriented Software Product Lines. Springer Berlin Heidelberg, 2013.
[14] Sven Apel and Christian Kästner. An overview of feature-oriented software development, 2009.
[15] Kyo C Kang Sholom G Cohen James A Hess William E Novak A Spencer Peterson. Feature-Oriented Domain Analysis (FODA) Feasibility Study. Technical report, Carnegie-Mellon Univ Pittsburgh Pa Software Engineering Inst., 1990.
[16] Rafael Capilla, Jan Bosch, Pablo Trinidad, Antonio Ruiz-Cortés, and Mike Hinchey. An overview of Dynamic Software Product Line architectures and techniques: Observations from research and industry. Journal of Systems and Software, 91(1):3–23, may 2014.
[17] Mohammed El Dammagh and Olga De Troyer. Feature modeling tools: Evaluation and lessons learned. In Lecture Notes in Computer Science (including subseries Lecture Notes in Artificial Intelligence and Lecture Notes in Bioinformatics), volume 6999 LNCS, pages 120–129, 2011.
[18] Meet Android Studio Android Developers. https://developer.android.com/studio/intro.
[19] FreeMarker Java Template Engine. https://freemarker.apache.org.
[20] Antonio Collazo Garcia and Sandra Casas. Mobile QoE exploration: An unsupervised field study in an Argentine Patagonian city. In Proceedings – International Conference of the Chilean Computer Science Society, SCCC, volume 2020-November. IEEE Computer Society, nov 2020.
[21] S Montagud. Un Método para la Evaluación de la Calidad de Líneas de Productos Software basado en SQuaRE. Tesis de master, Univeridad Politécnica de Valladolid, 2009.
[22] System and Software Quality Requirements and Evaluation (SQuaRE). ISO Standard 25000. https://iso25000.com.
[23] Qi Alfred Chen, Haokun Luo, Sanae Rosen, Z. Morley Mao, Karthik Iyer, Jie Hui, Kranthi Sontineni, and Kevin Lau. QoE Doctor: Diagnosing Mobile App QoE with Automated UI Control and Cross-layer Analysis. In Proceedings of the 2014 Conference on Internet Measurement Conference – IMC ’14, pages 151–164, Vancouver, BC, Canada, 2014.
[24] Vaneet Aggarwal, Emir Halepovic, Jeffrey Pang, Shobha Venkataraman, and He Yan. Prometheus: Toward Quality-of-Experience Estimation for Mobile Apps from Passive Network Measurements. In Proceedings of the 15th Workshop on Mobile Computing Systems and Applications – HotMobile ’14, pages 1–6, New York, USA, 2014. ACM Press.
[25] L. Ravindranath, J. Padhye, S. Agarwal, R. Mahajan, I. Obermiller, and S. Shayandeh. AppInsight: Mobile App Performance Monitoring in the Wild. In Proceedings of the 10th USENIX Conference on Operating Systems Design and Implementation, pages 107–120, 2012.
[26] Qiang Xu, Sanjeev Mehrotra, Zhuoqing Mao, and Jin Li. PROTEUS: network performance forecast for real-time, interactive mobile applications. In Proceeding of the 11th annual international conference on Mobile systems, applications, and services – MobiSys ’13, pages 347–360, New York, USA, 2013. ACM Press.
[27] Lenin Ravindranath, Jitendra Padhye, Ratul Mahajan, and Hari Balakrishnan. Timecard: Controlling User-Perceived Delays in Server-Based Mobile Applications. In Proceedings of the Twenty-Fourth ACM Symposium on Operating Systems Principles – SOSP ’13, pages 85–100, New York, USA, 2013. ACM Press.
[28] Lide Zhang, David R Bild, Robert P Dick, Z Morley Mao, and Peter Dinda. Panappticon: Event-based Tracing to Measure Mobile Application and Platform Performance. In Proceedings of the Ninth IEEE/ACM/IFIP International Conference on Hardware/Software Codesign and System Synthesis, CODESISSS ’13, pages 1–10, Piscataway, NJ, USA, 2013. IEEE Press.
[29] Florian Wamser, Michael Seufert, Pedro Casas, Ralf Irmer, Phuoc Tran-Gia, and Raimund Schatz. YoMoApp: A tool for analyzing QoE of YouTube HTTP adaptive streaming in mobile networks. In 2015 European Conference on Networks and Communications (EuCNC), pages 239–243. IEEE, jun 2015.
[30] Katrien De Moor, Istvan Ketyko, Wout Joseph, Tom Deryckere, Lieven De Marez, Luc Martens, and Gino Verleye. Proposed Framework for Evaluating Quality of Experience in a Mobile, Testbed-oriented Living Lab Setting. Mobile Networks and Applications, 15(3):378–391, jun 2010.
[31] Katrien De Moor, Istvan Ketyko, Wout Joseph, Adrian Juan Verdejo, Toon De Pessemier, Lieven De Marez, and Luc Martens. Evaluating ‘Quality of Experience’ of mobile applications and services in a Living Lab setting. In 1st Living Labs Summer School, 2010.
[32] Seokjun Lee and Hojung Cha. User interface-level QoE analysis for Android application tuning. Pervasive and Mobile Computing, 40:382–396, sep 2017.
[33] Fabiana G. Marinho, Rossana M.C. Andrade, Cláudia Werner, Windson Viana, Marcio E.F. Maia, Lincoln S. Rocha, Eldânae Teixeira, João B.Ferreira Filho, Valéria L.L. Dantas, Fabrício Lima, and Saulo Aguiar. MobiLine: A Nested Software Product Line for the domain of mobile and context-aware applications. In Science of Computer Programming, volume 78, pages 2381–2398. Elsevier, dec 2013.
[34] Venilton Falvo Júnior, Nemésio Freitas Duarte Filho, Edson OliveiraJr, and Ellen Francine Barbosa. Towards the Establishment of a Software Product Line for Mobile Learning Applications. In SEKE, pages 678–683, 2014.
[35] Pedro O. Rossel and Valeria Herskovic. Building a domain model for mobile collaborative systems: Towards a software product line. In Lecture Notes in Computer Science (including subseries Lecture Notes in Artificial Intelligence and Lecture Notes in Bioinformatics), volume 8224 LNCS, pages 290–305. Springer, Berlin, Heidelberg, oct 2013.
[36] Clément Quinton, Sébastien Mosser, Carlos Parra, and Laurence Duchien. Using multiple feature models to design applications for mobile phones. In ACM International Conference Proceeding Series, page 1, New York, USA, 2011. ACM Press.
[37] Tobias Durschmid, Matthias Trapp, and Jurgen Dollner. Towards Architectural Styles for Android App Software Product Lines. In 2017 IEEE/ACM 4th International Conference on Mobile Software Engineering and Systems (MOBILESoft), pages 58–62. IEEE, may 2017.
Biographies

Antonio Collazo García is a PhD student at the National University of Southern Patagonia (UNPA), Argentina. His research interests are Mobile Computing, User Experience, and Software Engineering.

Sandra Casas is an associate professor at the Institute of Applied Technology of the National University of Southern Patagonia, Argentina. She received her PhD from the University of Vigo of Spain at 2008. Her research interests include the study and application of software development improvement techniques.
Journal of Mobile Multimedia, Vol. 18_3, 495–520.
doi: 10.13052/jmm1550-4646.1832
© 2022 River Publishers