Instantaneous Approach for Evaluating the Initial Centers in the Agricultural Databases Using K-Means Clustering Algorithm
LNC Prakash, K.1, G. Suryanarayana2, Mohd Dilshad Ansari3,* and Vinit Kumar Gunjan4
1CVR College of Engineering, Hyderabad, India
2Vardhaman College of Engineering, Hyderabad, India
3CMR College of Engineering & Technology, Hyderabad, India
4CMR Institute of Technology, Hyderabad, India
E-mail: klnc.prakash@gmail.com; surya.aits@gmail.com; m.dilshadcse@gmail.com; vinitkumargunjan@gmail.com
*Corresponding Author
Received 29 April 2021; Accepted 31 May 2021; Publication 26 August 2021
Abstract
Clustering algorithms are most probably and widely used analysis method for grouping agricultural data with high similarity. For example, one of the most widely used approaches in previous study is K-means, which is simpler, more versatile, and easier to understand and formulate. The only disadvantage of the K-means algorithm has always been that the predetermined set of cluster centres must be prepared ahead of time and provided as feedback. This paper addresses the issue of estimating cluster random centres for data segmentation and proposes a new method for locating appropriate random centres based on the frequency of attribute values. As a consequence of calculating cluster random centres, the number of iterations required to achieve optimum clusters in K-means will be reduced, as will the time required to shape the final clusters. The experimental findings show that our approach is efficient at estimating the right random cluster centres that indicate a fair separation of objects in the given database. The technique observation and comparative test results showed that the new strategy does not use present manual cluster centres, is more efficient in determining the original cluster centres, and therefore more successful in terms of time to converge the actual clusters especially in agricultural data bases.
Keywords: Data segmentation, clustering, agricultural databases, K-means, random selection of cluster centres, frequency of the attribute values.
1 Introduction
In India, agriculture employs a large number of people. In past few years, ensuring the agricultural production of an ever-increasing population has been seen as a critical challenge. Mostly in agricultural sector, information sharing infrastructure technologies are used to meet people’s food demands. Agriculture-related operations are intertwined with a variety of causes, including economic, health and environmental impacts. Data segmentation for agriculture data is among the most important processes in the analysis of information because the accuracy of the final analysis outcome is crucial [1, 2]. In this regard, the literature [3, 4] suggested multiple data segmentation approaches in order to gather reliable information. The basic idea behind classification is to partition datasets into their elements or to categorise objects in an existing data base. Several studies provide a variety of partitioning methodologies [5] but the key category is clustering approaches that are widely used in data segmentation because of their good performance [6, 7]. Clustering approaches aim to define related clusters (regions) and to segment the database into several partitions. So many architectures for clustering operations have been presented in the literature. The k-means is among the most widely being used technique for the convenience and simplicity [8]. Furthermore, a few of its disadvantages, is to determine the random collection of the centroids required well before in the implementation of k-means is begun. The contribution of this study should be to provide clusters with a novel k-means algorithm that aims to overcome the downside of the random collection of centres., This system gives the automated collection initial centres for clustering that uses k-means algorithm from the frequency of attribute values by choosing the appropriate number k of cluster centres that gives us the improved segmentation performance. It is extremely important with regard to this selection, because this has a significant effect on the development of the ultimate clusters.
The remainder of this article is structured as given here: a thorough analysis of literature and the K-means mechanism is given in Sections 2 and 3 respectively. Section 4 shows our way of estimating the correct random selection of cluster centroids per data partition. Section 4 shows how our system works and is robust. At the end, Section 6 lays out conclusions and proposals for future research.
2 Literature Survey
A significant number of cluster analysis techniques are identified in the previous research, some of them are partition-based clustering [9], density dependent clustering [10], grid-based clustering [12], graph-based clustering and many more. For illustration, k-means clustering as well as its variations are major features of centroid dependent clustering techniques. Nevertheless, in all of these efficient methods, correct specifications of various parameters typically calculated and presented beforehand, which is viewed Might be one of the major disadvantages to such algorithms. For instance, the number of forecasted clusters is needed for the both hierarchical clustering techniques and partition clustering techniques, the optimum threshold value of a grid size is specified in advance for grid clustering techniques.
As a result, the obvious problem of cluster analysis would be how many exact number of clusters are sufficient for the definition of the clustering procedure in addition to that if the clustering technique is K-means we need to supply the initial centroids before going through the core technique [13]. The K-means algorithm often provided good outcomes whenever the initial separation was similar to the ultimate result (Jain and Dubes, 1988). So many suggestions are being published to resolve this issue of cluster initialization. A recursive form for the initialization of the means by attempting to run K clustering issues is mentioned by Duda and Hart (1973). Pena et al. [14] proposed a comprehensive evaluation for specific initialization Methodologies for the K-means clustering algorithm.
The outcomes of its research shows that such random and Kaufman initialization offers impeccable comparatively with the rest of the methods as those which create K-means more accurate and more efficient regardless on initial clustering and on the order of the instances of the database. As recommended in [15] the data condensation method includes determining the intensity at a point, arranging the objects in terms of the intensity metric, choosing a point as per the arranged list, and trimming all the points inside this disk at an object where the radius is negatively associated to the intensity at that point. The research [16] suggested an approach does not rely on a single index, but neither does it systematically and widely examine the state space which has been shown to be existed is time consuming, but scans for real clusters localized one by another in dimensional space that is driven by some basic global approaches. In the paper [17], the issue of evaluating Smoothing parameter and model selection in clustering are mentioned. For that strategy, the efficiency for its determination of number of clusters is significantly boosted. Ultimately, an effective gradient descent Smoothing estimation approach which not only declines the complex method of computing, but it also provides the Optimum outcome.
3 Problem Formulation
Most of the current clustering algorithms need to provide them with an initial cluster centroid that is difficult to adjust for perfect grouping [18, 19]. Effective grouping requires the separation of instances into highly similar areas. Within this study, we suggest a novel process that is relatively straightforward to approximate dynamically the initial cluster centres from the database without any clusters identified beforehand.
3.1 K-means Clustering Algorithm
Mac Queen suggested a partition-based grouping technique called K-means clustering algorithm widely used in several implementations, like information gathering, pattern identification, as well as picture partitioning [20]. It really is an unsupervised type of clustering technique [21, 23] that characterizes the source data instances in to the various groups relying on its proximity with one another and their fixed priority through some kind of number of clusters (assuming k groups) and initial centroids. Such points are grouped all over the centroids. As per a proximity scale, each data instance in the source data base is assigned towards the centre of the closest cluster. The k centroid points change their location in series of steps until there is no other moment for the centroids have been taken place; that means in other phrases, the centres will not be moved later words and the required clusters are formed. Lastly, the purpose of this algorithm would be to solve the optimization problem defined as squared error or to minimize the sum of intra-cluster distance. The working procedure of the K-Means clustering algorithm can be seen in the Figure 1.
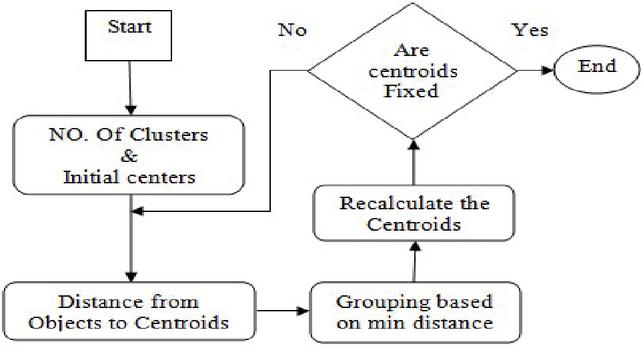
Figure 1 The K-Means technique.
After finding real clusters the existing cluster accuracy finding measurements are being implemented to rate the performance of clustering groups collected by various clustering algorithms. In this, it is identified two main contemporary cluster validity metrics which are cluster purity and F-Measure that will be used later in compared experiments. Purity is an objective measurement criterion for the consistency of clustering in the sense of analysis for clustering. Purity is the percentage of the total number of items (data points) which have been grouped correctly it is defined by
The well-known another method that is used to determine the performance of the clusters formed is F-Measure which uses precision and recall; these are defined in the following way.
4 Proposed Algorithm
In the standard K-Means process the cluster number K will always be set in advance as a parameter by the users; however, the initial cluster centres configurations be picked at random. So, in this context the concept is needed is to suggest a methodology that is capable of precisely predict the sufficient initial centres for clusters (classes). The initial centroids for the clusters will be determined automatically in the recommended process. An explanation of the approach proposed and, the procedure that could be explained in the given below sections.
The crucial concept behind the anticipated approach would be to split the progression of segmentation into the given different stages. Rather than always selecting randomly the initial centres of the clusters that are going to form is to have, this technique forecast cluster initial centres automatically through a few dispensation steps. As a result, to estimate it, it is proposed to concentrate on finding the frequency of the domain values of the attributes. In attempting to analyse the data base, we should consider the frequency of the domain values of the attributes as an essential way of understanding our objects at the first stage in the suggested approach it is to glance at the object frequency, which indicates the occurrence of the object values which gives an underlying pattern for the initial centres. The theme of the proposed selection of initial centres for clusters is the mechanism that relates to the mining of frequency dependent, which picks the objects depending on their involvement to frequency significance than the random selection. In market basket results, for example, the benefit gained against an object is depending on its frequency than its random transaction collection. Likewise, the values displayed for the attribute domain must be chosen on the basis of their frequency, rather than their participation in major transactions. This way of selecting values for objects as regards the attributes represents the frequency of attribute values. This is followed by detailed development of the proposed model.
Let DS be the set of data formed by record set, so that the objects include single or multiple attributes. Let ABS denotes the set of all attributes in the data set DS. The notation denotes values assigned to an attribute . In every list, each element in a set represents a single value of the respective attribute. The frequency scale introduced here demonstrates the importance of the attribute values that are included in the data set records. Furthermore, in the direction to estimate the frequency value of the specified data set, first estimate the distribution of the value of each attribute (see Equation (1)) as value frequency, so that attribute entries are treated as values in each record. Then the record-frequency of the record, the record-frequency is the summative value of the frequency of the values that are present in the respective record of the data set (see Equation (2)). Record-frequency further is used to evaluate the dataset-frequency, which is the summative value of the record- frequency of every record in the respective dataset (see Equations (3) and (4)). The mathematical description on the above construction is described below.
The exposure of every domain value of an attribute expressed as value frequency and is calculated as follows.
For each attribute , create a set which contains all the values of the attribute and create a set which contains all the domain values with no repetitions of the attribute . Now For each value find value frequency of each value of as given bellow.
| (1) |
The average of the frequency of all values with respect to data set in a record is represented as the record frequency which is denoted by and is defined as for each record ,
| (2) |
The aggregate of the frequency of all records represented as dataset frequency which is measured as given below:
| (3) |
The divergence of the record frequency , which is calculated as follows
| (4) |
The Thresh hold () of the dataset frequency ratio, which is calculated as follows
| (5) |
The thresh hold is used as an upper bound for all the values of record frequency. Consider all the records of the data set whose record frequency is above the thresh hold () and arrange all these records in ascending order of their record frequency. Select as many records as initial cluster centroids from the top and this number also represents the count of clusters that are going to form from the data base. The corresponding algorithm is specified in the Figure 2.
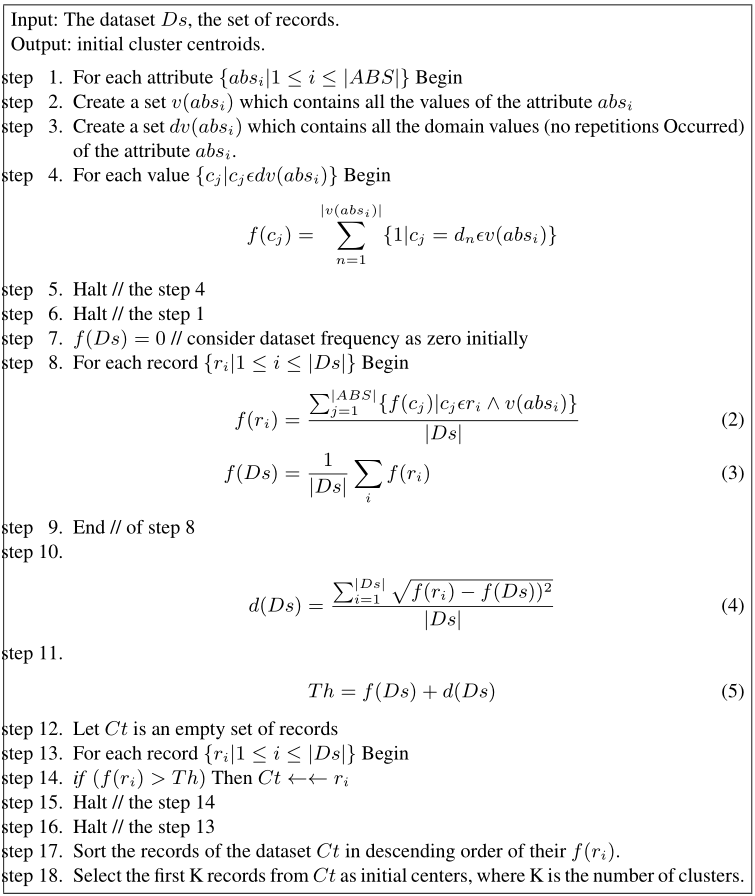
Figure 2 the Proposed algorithm.
5 Performance Evaluations
In this portion, we conducted a set of experiments on the synthesized, agricultural and some other realistic data sets to convey several numerous facets in this implemented process. Ten of the earliest studied data sources from both the UCI [22] and the UEF have been utilized to validate the efficiency of the suggested technique that is compared to the random selection of cluster centres, among these ten, four data sets which are Seeds, Dry Bean, Soybean and Mushroom are agriculture related data sets. The numbers of times the random sample of centroids is tested against the suggested set of centroids ranging from 10 to 30, the clusters that are generated are ranging between 3 and 23 and the number of the attributes ranging between 2 and 37. The specifics among these databases are set out in Table 1.
Table 1 Datasets
| Ds | Dataset Name | Instances | Classes | Dimensions |
| Ds1 | Synthetic dataset | 8 | 3 | 2 |
| Ds2 | Iris dataset | 150 | 3 | 4 |
| Ds3 | Seeds dataset | 210 | 3 | 7 |
| Ds4 | Dry Bean dataset | 13611 | 7 | 17 |
| Ds5 | Soybean dataset | 307 | 19 | 37 |
| Ds6 | Mushroom dataset | 8124 | 23 | 22 |
| Ds7 | Fertility Diagnosis | 100 | 2 | 9 |
| Ds8 | Wine dataset | 178 | 3 | 6 |
| Ds9 | Haberman dataset | 306 | 2 | 3 |
| Ds10 | Ecoli dataset | 336 | 8 | 7 |
Both the suggested algorithm and the random selection of cluster centres for the chosen databases were conducted for 10 to 30 iterations during this the findings are given in the following way. As prescribed in Table 2, in which cluster purity and F-Measure have been applied to determine the effectiveness of the prescribed technique and the random collection of cluster centres. On the other hand, the processing duration of the CPU and the iteration count needed to shape the necessary clusters are seen in Table 3. The processing time of CPU is considered in “second” which is also reported in Table 3. The Synthetic Dataset (Ds1) further utilized to investigate the effectiveness of the introduced approach is given in Figure 3. Clearly, this dataset contains two attributes and hence it is the two-dimensional data that consists of three different clusters. The clustering result is CS1 {{(2, 10), (5, 8), (4, 9)}, {(8, 5), (7, 5), (6, 4)}, {(2, 5), (1, 2)}}. The result CS1 represent that there are 3 clusters in the data and the clusters formed by using the prescribed and the traditional random selection procedure. According to our observations, the random collection of cluster centres may yield weaker results in
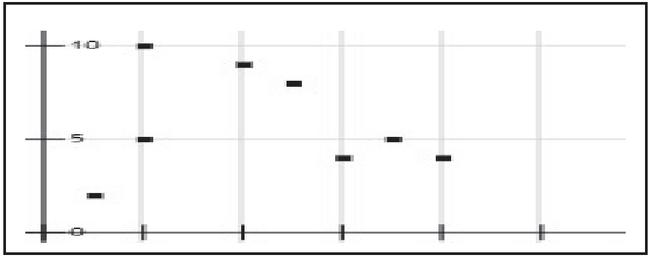
Figure 3 Synthetic dataset DS1.
Table 2 The comparisons of FSM and RSM on F-measure and Purity for the datasets
| Performance | K-Means with | K-Means with | |
| Dataset | Measure | FSM (Proposed) | RSM (Traditional) |
| DS1 | F-measure | 0.813 | 0.801 |
| Purity | 0.890 | 0.821 | |
| DS2 | F-measure | 0.83 | 0.80 |
| Purity | 0.800 | 0.721 | |
| DS3 | F-measure | 0.913 | 0.891 |
| Purity | 0.790 | 0.741 | |
| DS4 | F-measure | 0.843 | 0.810 |
| Purity | 0.790 | 0.730 | |
| DS5 | F-measure | 0.762 | 0.730 |
| Purity | 0.731 | 0.701 | |
| DS6 | F-measure | 0.837 | 0.802 |
| Purity | 0.820 | 0.802 | |
| DS7 | F-measure | 0.746 | 0.713 |
| Purity | 0.896 | 0.834 | |
| DS8 | F-measure | 0.798 | 0.743 |
| Purity | 0.863 | 0.860 | |
| DS9 | F-measure | 0.743 | 0.739 |
| Purity | 0.845 | 0.832 | |
| DS10 | F-measure | 0.712 | 0.701 |
| Purity | 0.867 | 0.841 |
Clustering, if the random collection of cluster centres of the data is beyond the limit of the resulting thresh hold. From the other side, random collection of cluster centres that has a larger collection of centroids from the entire dataset for the initial cluster centres can require an enormous amount of computational period of time and a greater number of iterations converging to the proper results. As a result, the proposed approach has a greater probability of finding the right initial cluster centroids by using the frequency selection method than the traditional random selection method which is used to check both efficiency and Processor time.
Table 3 The comparisons of CPU time and number of iterations to render the clusters
| Dataset | CPU Time | Number of Iterations | ||
| FSM | RSM | FSM | RSM | |
| DS1 | 0.125 | 0.25 | 2 | 4 |
| DS2 | 0.431 | 10.180 | 7 | 163 |
| DS3 | 0.452 | 11.342 | 8 | 182 |
| DS4 | 0.587 | 7.589 | 10 | 122 |
| DS5 | 3.657 | 44.347 | 59 | 670 |
| DS6 | 1.364 | 7.130 | 22 | 113 |
| DS7 | 0.368 | 13.385 | 6 | 215 |
| DS8 | 1.214 | 18.472 | 20 | 296 |
| DS9 | 1.940 | 16.381 | 32 | 263 |
| DS10 | 2.426 | 28.96 | 39 | 464 |
As seen in the Table 3, the frequency-based selection of the initial centroid function will clearly improve the computation time; it clearly indicates that the FSM offers a robust initialization. In brief, the proposed algorithm should not only increase the computational efficiency of the clustering technique as shown in the Table 3, but can also increase the convergence rate of the proposed clustering technique at the same time it boosts the detection accuracy of the initial cluster centres. The Figures 4–6 represents the Comparison of FSM and RSM Regarding the number of clusters and the corresponding number of iterations for the Three example datasets DS3, DS4 and DS5 respectively, these figures exhibit that FSM produces the better performance when compare with RSM irrespective with the number of clusters, RSM requires a greater number of iterations to form the required clustering results.
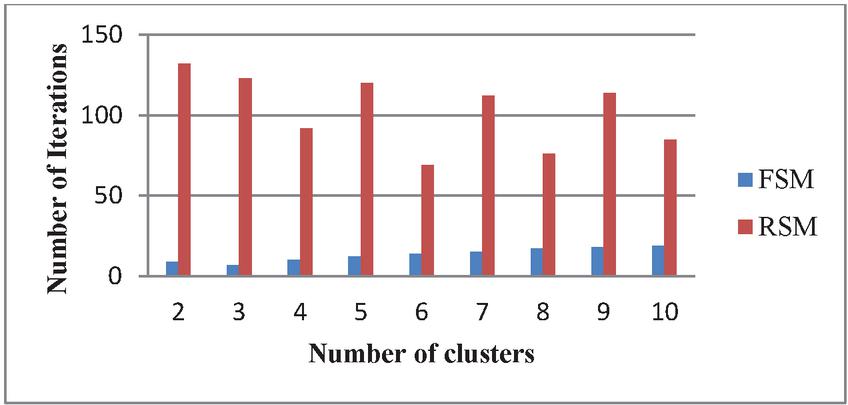
Figure 4 SComparison of FSM and RSM for the data set DS3.
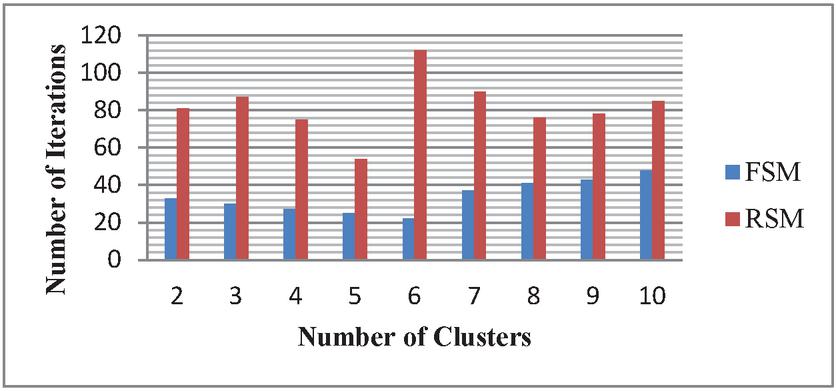
Figure 5 Comparison of FSM and RSM for the data set DS4.
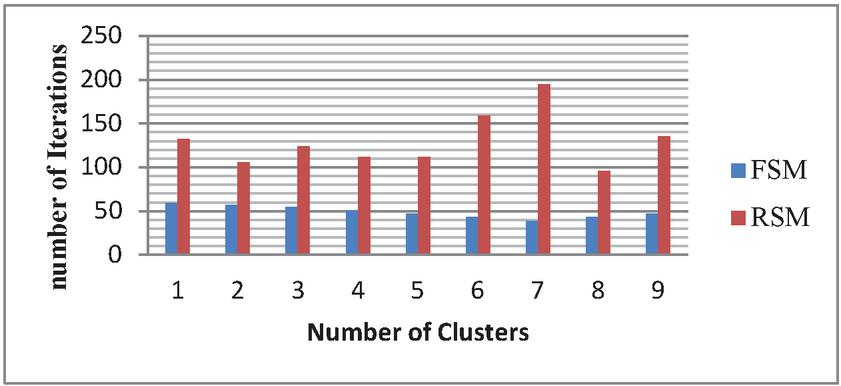
Figure 6 Comparison of FSM and RSM for the data set DS5.
6 Conclusion and Future Scope
This study presents the Frequency Selection Method (FSM), an operational automatic selection of initial centroids for clustering that provides reliable initial cluster centres the majority of the time. To reduce the significant amount of computing time needed to find the estimated precision of clustering, the suggested clustering architecture will have to include a robust set of cluster centroids initially for the K-Means clustering strategy. As a result, the FSM approach simply offers knowledge gathering in advance for the K-means technique in the concept of initial cluster centroids. The proposed technique’s findings were performed and compared to a random array of the original cluster centres for ten individual datasets, with the Seeds, Dry Bean, Soybean, and Mushroom being agriculture-related data sets. Observational tests revealed that the proposed solution outperformed other traditional clustering approaches in terms of instantaneous clustering efficiency. Nonetheless, research findings indicate that certain automated clustering approaches have failed to cluster datasets where the number of clusters is not explicitly determined in advance. This is not an exception in the proposed approach. To improve the utility of the proposed approach, in future we may seek to reinforce certain parameter values or techniques for classifying the required number of clusters in unlabelled results.
References
[1] Dimitriadou, E., Dolnièar, S. and Weingessel, A. “An examination of indexes for determining the number of clusters in binary data sets”. Psychometrika 67, pp. 137–159 (2002). https://doi.org/10.1007/BF02294713
[2] G. Milligan and M. Cooper, “An Examination of Procedures for Determining the Number of Clusters in a Data Set”,Psychometrika, vol. 50, pp. 159–179, 1985. doi: 10.1007/BF02294245
[3] P. Guo, C. Chen, and M. Lyu, “Cluster Number Selection for a Small Set of Samples Using the Bayesian Ying-Yang Model,” IEEE Trans. Neural Networks, vol. 13, no. 3, pp. 757–763, 2002. https://doi.org/10.1109/TNN.2002.1000144
[4] Chiang M.MT., Mirkin B. “Experiments for the Number of Clusters in K-Means. In: Neves J., Santos M.F., Machado J.M. (eds) Progress in Artificial Intelligence. EPIA 2007. Lecture Notes in Computer Science, vol. 4874. Springer, Berlin, Heidelberg doi: 10.1007/978-3-540-77002-2_33
[5] J. Grabmeier, A. Rudolph, “Techniques of cluster algorithms in data mining”, Data Mining and Knowledge Discovery, vol. 6(4), 2002, pp. 303–360. doi: 10.1023/A: 1016308404627.
[6] H. Yu, Z.G. Liu, G.Y. Wang, “Automatically determining the number of clusters using decision-theoretic rough set”, in: J. Yao et al. (Eds.), Proceedings of the 6th International Conference on Rough Sets and Knowledge Technology, RSKT’11, LNCS, vol. 6954, 2011, pp. 504–513, https://doi.org/10.1016/j.ijar.2013.03.018
[7] Narayana G. Surya, and D. Vasumathi. “Clustering for high dimensional categorical data based on text similarity.” In Proceedings of the 2nd International Conference on Communication and Information Processing (ICCIP-2016) pp. 17–21. 2016.
[8] LNC. Prakash K, Dr. K. Anuradha “Optimal Feature Selection for multi valued Attributes using Transaction Weights as Utility Scale” proceedings of second international conference on computational intelligence and informatics (ICCII-2017). https://doi.org/10.1007/978-981-10-8228-3.
[9] Ping Guo, C. L. Philip Chen, Michael R. Lyu, “Cluster Number Selection for a Small Set of Samples Using the Bayesian Ying–Yang Model”, IEEE Transactions on Neural Networks Volume: 13, Issue: 3, 2002, pp. 757–763, doi: 10.1109/TNN.2002.1000144
[10] G. Peters, F. Crespo, P. Lingras, R. Weber, “Soft clustering – fuzzy and rough approaches and their extensions and derivatives”, International Journal of Approximate Reasoning, 2012. https://doi.org/10.1016/j.ijar.2012.10.003.
[11] M. Ester, H. Kriegel, J. Sander, X. Xu, “A density-based algorithm for discovering clusters in large spatial databases with noise”, in: E. Simoudis, J. Han, U.M. Fayyad (Eds.), Proceedings of the Second International Conference on Knowledge Discovery and Data Mining, KDD’96, 1996, pp. 226–231.
[12] I. Foster, T. Freeman, K. Keahey, D. Scheftner, B. Sotomayor, X. Zhang, “Virtual clusters for grid communities”, in: Sixth IEEE International Symposium on Cluster Computing and the Grid, CCGRID’06, 2006, pp. 513–520. doi: 10.1109/CCGRID.2006.108.
[13] Still, S., Bialek, W. 2004. “How many clusters? An information-theoretic perspective. Neural Computation, 16(12), 2483–2506. https://doi.org/10.1162/0899766042321751
[14] Sangita O., Dhanamma J. (2011) ‘An Improved K-Means Clustering Approach for Teaching Evaluation”. In: Unnikrishnan S., Surve S., Bhoir D. (eds) Advances in Computing, Communication and Control. ICAC3 2011. Communications in Computer and Information Science, vol 125. Springer, Berlin, Heidelber, doi: https://doi.org/10.1007/978-3-642-18440-6_13.
[15] Peña, J.M., Lozano, J.A., Larrañaga, P., 1999. “An empirical comparison of four initialization methods for the K-means algorithm”. Pattern Recognition Lett. 20, 1027–1040. https://doi.org/10.1016/S0167-8655(99)00069-0.
[16] Shehroz S. Khan, Amir Ahmad, “Cluster center initialization algorithm for K-means clustering”, Pattern Recognition Letters, 25 (2004), pp. 1293–1302. doi: 10.1016/j.patrec.2004.04.007.
[17] Yang Zhengwu, Huo Hong, Fang Tao, “Automatically Finding the Number of Clusters Based on Simulated Annealing”, J. Shanghai Jiao Tong Univ. (Sci.), 2017, 22(2): 139–147 doi: 10.1007/s12204-017-1813-9.
[18] Liang Wang, Christopher Leckie, Kotagiri Ramamohanarao, and James Bezdek,” Automatically Determining the Number of Clusters in Unlabeled Data Sets”, IEEE transactions on knowledge and data engineering, vol. 21, no. 3, 2009, pp. 335–350, doi: 10.1109/TKDE.2008.158.
[19] Narayana G. Surya, and D. Vasumathi. “Clustering for high dimensional categorical data based on text similarity.” In Proceedings of the 2nd International Conference on Communication and Information Processing (ICCIP-2016) pp. 17–21. 2016.
[20] Tibshirani R, Walther G, Hastie T. “Estimating the number of clusters in a dataset via the gap statistic”, [J]. Journal of the Royal Statistical Society, Series B, 2001, 63: 411–423. https://doi.org/10.1111/1467-9868.00293
[21] L. Xie, G. Beni, “A validity measure for fuzzy clustering”, IEEE Trans. On Pattern Analysis and Machine Intelligence 13(8) (1991), pp. 841–847. doi: 10.1109/34.85677.
[22] MacQueen, J.B, Some Methods for classification and Analysis of Multivariate Observations .In: Proceedings of 5-th Berkeley Symposium on Mathematical Statistics and Probability, Berkeley, University of California Press, 1,281–1,297, 1967.
[23] Kapil, S., Chawla, M., and Ansari, M. D. (2016, December). On K-means data clustering algorithm with genetic algorithm. In 2016 Fourth International Conference on Parallel, Distributed and Grid Computing (PDGC) (pp. 202–206). IEEE.
Biographies

LNC Prakash, K., awarded doctorate in Computer Science & Engineering from JNTU Hyderabad, A State Government University, Hyderabad, India, He has more than 21 years of Teaching and 10 years of Research experience. He has 10 research publications in reputed journals which are indexed by SCI, SCOPUS and UGC. He guided 13 UG projects and 8 PG projects. He has filed 5 Indian patents, 1 international patent and wrote 1 Book. He has professional memberships of IE. He is currently working as an Associate Professor in the Department of Computer Science and Engineering, CVR college of Engineering, Hyderabad, India.

G. Suryanarayana, awarded doctorate in Computer Science & Engineering from JNTUH, Hyderabad, India. He has more than 12 years of Teaching and 7 years of Research experience. He has 22 research publications in reputed journals which are indexed by SCIE, SCOPUS and UGC. He guided 20 UG projects and 10 PG projects. He has filed 6 Indian patents and wrote 2 Books. His research interests are, Data Mining, Artificial Intelligence, Machine Learning.. He is currently working as an Associate Professor, department of CSE, Vardhaman College of Engineering, Hyderabad, India.

Mohd Dilshad Ansari is currently working as an Assistant Professor in the Department of Computer Science & Engineering at CMR College of Engineering & Technology, Hyderabad, India. He received his M.Tech and Ph.D. in Computer Science & Engineering from Jaypee University of Information Technology, Waknaghat, Solan, HP, India in 2011 and 2018 respectively. His research interest includes Digital & Fuzzy Image Processing, Artificial Intelligence & Machine Learning, IoT and Cloud Computing.
Journal of Mobile Multimedia, Vol. 18_1, 43–60.
doi: 10.13052/jmm1550-4646.1813
© 2021 River Publishers