The EEG Brain Signal Pattern Analysis During Touching Learning of the Blind and Normal People via a Low-cost Device
Wachira Lawpradit*, Thongchai Yooyativong and Roungsan Chaisricharoen
Department of Information Technology, Mae Fah Luang University, Chiang Rai, Thailand
E-mail: wachira18@hotmail.com; thongchai.mfu@gmail.com
*Corresponding Author
Received 21 May 2021; Accepted 05 November 2021; Publication 05 July 2022
Abstract
This research was designed for analyse and compare patterns of EEG signals while blinded and normal people performing touching-leaning. The pattern analysis focuses on important EEG wavebands during touching, such as delta, theta, alpha and gamma waveband. The EEG waveband-datasets were detected and recorded with inexpensive device, the NeuroSky Mindwave, where it is connected to a computer for data analysis through Bluetooth communication and had electric noise reduction chipset inside. The analysis for the EEG waveband pattern-comparisons is performed by utilizing waveband power spectrum and statistical technique based on FFT algorithm, Area Under Curve (AUC), mean, S.D., T-score, and P-value testing. The experiment shown that dominant EEG signal wavebands of blinded people when touching-learning are delta, theta, alpha and gamma. These wavebands were higher than normal people. Moreover, by using statistical analysis T-score and P-values testing, analyzed results illustrate that normal and blinded people EEG wave patterns are significantly different on gamma waveband where blinded people have significantly higher gramma wave during touching-learning activities. The objects used for touching-leaning in the experiments are square, triangle, circle, and hexagon shape of tactile pictures. The observation also shown that blinded people use their muscle in movement more than normal people which also strongly related to gramma wave. In addition, another wave did not relate to statistic significant. This result illustrated to normal and blinded people thinking and imagination with the same pattern.
Keywords: Electroencephalogram, EEG, brain computer interface, BCI, blinded people, touching learning, EEG pattern.
1 Introduction
There are still many blinded people in our society. Blinded people can be categorized into three major group-types i.e., partial visual impaired, blinded on one side and blinded on two sides. Blinded people learn and work in normal life like normal people. With reason, many of public company or government establishes school or foundation to educate them, for example, Lampang Foundation for the Blind in Thailand founded a school for blinded students. The method used for learning in blinded people schools is by touching learning. Nowadays, Brain Computer Interface (BCI) is an inexpensive technology, can be used to observe and analyze the chemical movement in brain [17]. This technology collects electrical data from electrode. The device collects data-signal from human activities which controlled by brain, including learning activity. BCI has many types of electrode placement, on scalp and inside brain. In addition, there are various technologies that used to interface with the brain signal, for example, electroencephalography (EEG) which placed the electrode on the scalp, electrocorticography (ECoG) which placed the electrode on the surface of the brain, magnetoencephalography (MEG), positron emission tomography (PET), functional magnetic resonance imaging (fMRI), and functional Near InfraRed (fNIR) [5]. The brain signal that is most common and easy to detect even with low-cost devices is electroencephalogram (EEG) which can be detected by placing measuring-electrode on scalp. The device then connects to a computer with several kinds of communication such as wire, Bluetooth, or Wi-Fi. In this research, the device called NeuroSky Mindwave, a product of NeuroSky Inc., is used to collect EEG data signal.
This research focusses on a comparison of brain signal-patterns between the blind and normal person where the brain signals patterns are detected utilizing an inexpensive device, NeuroSky Mindwave, during the touching-learning activities. The EEG signal-pattern comparisons are analysed between blinded people and normal people when they are performing touching-activities on tactile pictures. The EEG brain-wave bands used for the analysis are delta, theta, alpha, beta and gamma [5, 10].
2 Related Work
Brain Computer Interface (BCI) is the method used to collect the EEG signal from brain to computer for visualization and analysis. The method includes brain functions, signal theories and signal processing models as mentioned below.
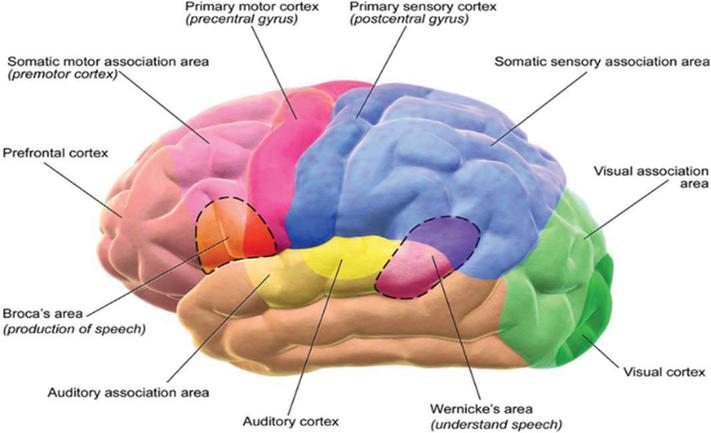
Figure 1 Brain parts and their functions [2].
2.1 The Brain Function
Human brain is one of large organs which contain complex components [19]. The brain is divided into four parts, including frontal lobe, parietal lobe, temporal lobe, and occipital lobe. Different brain parts relate to different body functions [8]. First, frontal lobe responses for executive function, memory and planned movement. Second, parietal lobe responses for perception and sensation. Next, occipital lobe focuses on visual perception. Last, temporal lobe responses for sound and speech activities. In this research, the EEG signal analyses for picture touching learning of blinded people as well as normal people are studied which will be dealing directly to the frontal lobe due to its functions concerning reasoning, learning, and creative abilities [5].
2.2 The Brain Wave Signal
Brain wave signal are created from neurotransmitter activity in brain [7]. Neurotransmitters transmit chemical substance, produce brain signal, between neuron to neuron or neuron to peripheral targets that neuroscientist call synapse. Then, electrical potential is created. There are many technologies that can detect this electrical signal, for example, electroencephalography (EEG), electrocorticography (ECoG) and magnetoencephalography (MEG) [5]. In this case, EEG brain wave signal is an electroencephalography which receive by electrode from the scalp like Figure 2(A). In this research, the EEG signal pattern is analysed to illustrate characteristics of each frequency bands.
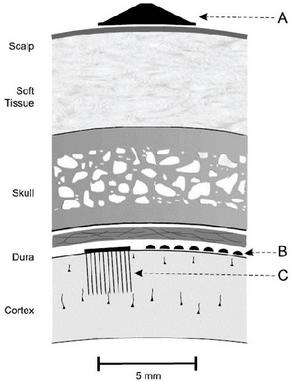
Figure 2 Electrode placement, (A) Electroencephalography (EEG). (B) Electrocorticography (ECoG), and (C) Single-neuron recordings [5].
Therefore, EEG signal consists of five frequency range [4], including delta wave frequency is between 0.1 Hz and 3 Hz, theta wave frequency range is 4 Hz to 7 Hz, alpha wave frequency range is 8 Hz to 12 Hz, beta wave has the frequency between 12 Hz and 30 Hz and the frequency of gamma is range from 30 Hz to 100 Hz. Each wave corresponds to different tasks [12] as shown in Table 1.
Table 1 EEG Frequency Bands and Brain States [12, 14]
| Brainwave Type | Frequency Range | Metal States and Conditions |
| Delta | 0.1 Hz to 3 Hz | Deep, dreamless sleep, non-REM sleep, unconscious |
| Theta | 4 Hz to 7 Hz | Intuitive creative, recall, fantasy, imaginary dream |
| Alpha | 8 Hz to 12 Hz | Relaxed, but not drowsy tranquil, integrated |
| Low Beta | 12 Hz to 15 Hz | Formerly, SMR, relaxed yet focused, integrated |
| Midrange Beta | 16 Hz to 20 Hz | Thinking, aware of self & surroundings |
| High Beta | 21 Hz to 30 Hz | Alertness, agitation |
| Gamma | 30 Hz to 100 Hz | Motor Functions, higher mental activity |
2.3 NeuroSky MindWave Device
One objective of this research is finding EEG brain signal patterns of blinded people during picture-learning activities by using low-cost device, one suitable device for the experiment is NeuroSky Mindwave. It is used to detect EEG signal in FP1 position electrode placement of 10–20 system electrode placement. NeuroSky Mindwave is an EEG brain computer interface device that contain ThinkGear chipset which is Neurosky Inc.’s single-channel [23]. This device has a dry electrode arm with chipset for filtering the electrical noise from EEG brain wave [15, 16]. In addition, this noise reduction chipset is TGAM [13]. The device shows in Figure 3.
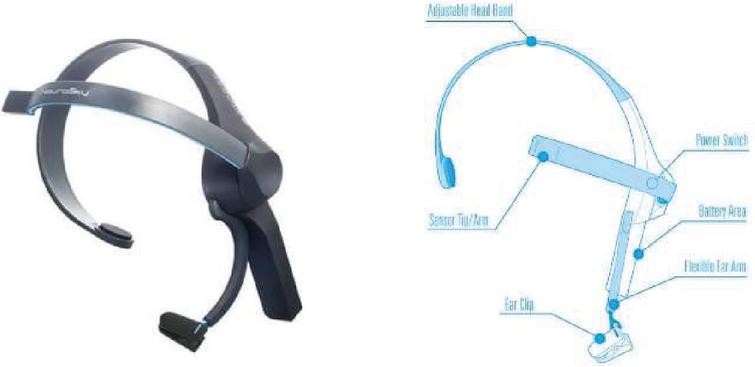
Figure 3 NeuroSky mindwave device [10].
According to EEG brain wave frequency bands, main EEG data source of NeuroSky Mindwave device are raw signal and power spectrum of wavebands (delta, theta, alpha, beta, and gamma) which corresponds to attention level, mediation level and eye blinking [23]. EEG raw signals are measured with 512 Hz sampling rate which is pre-set by the device.
2.4 Signal Processing
In brain-computer interface signal processing model, there are five main processes involving data gathering, data pre-processing, feature extraction, classification, and control interface method [9]. In pre-processing, feature extraction and classification process, many types of algorithms to process EEG data in each process were discovered. In this research, researchers focus on EEG signal from frontal lobe where it corresponds to learning and memorizing [1]. Moreover, the inexpensive device, NeuroSky Mindwave, used in the experiment is one-channel electrode device which contain Thinkgear chip to filter out electrical noise [13] and the device electrode is placed on Fp1 position on forehead to collect EEG data from frontal lobe. By this reason, Fast Fourier Transform algorithm is selected for feature extraction method to calculate power spectral density [17]. FFT convert EEG raw data from time domain to frequency domain [23]. Area Under Curve (AUC) is utilized as method of power estimation to calculate average EEG band power [18] and used for classification process. The example of raw EEG data shows in Figure 4.
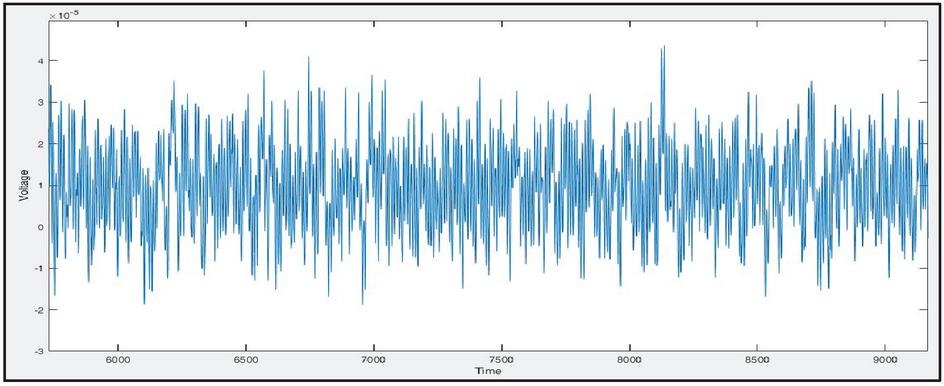
Figure 4 Example of raw EEG data with 512 Hz sampling frequency.
2.5 Fast Fourier Transform Algorithm
Fourier Transform algorithm is one of brain signal processing that transform between time domain and frequency domain of signal [20]. Fourier Transform function shows by following Equation (1). is the signal spectrum amplitude. is input signal data before processing.
| (1) |
In this research, Fast Fourier Transform algorithm is used to convert sampling dataset into signal spectrum. After that, the spectrum is used to analyse touching learning brain signal patterns. The equation of Fast Fourier Transform shows in Equation (2)
| (2) |
3 Research Methodology
3.1 Overview of Experiment Workflow
The experiment focuses on EEG signal patterns of normal people and blinded people when they are performing pictures-learning by touching the objects. Authors selected four basic shape tactile pictures, including square, triangle, circle, and hexagon shape. NeuroSky Mindwave was selected as data gathering device. NeuroSky Mindwave communicate to a computer by Bluetooth connection. Then, raw datasets were detected and monitored via OpenVIBE program. For analysing method, EEG signal datasets were stored into separated csv files. Then, Fast Fourier Transform is performed to extract separate EEG waveband into eight band-types as data filtering method. The entire FFT algorithm is coded in MATLAB. Furthermore, statistical mean and standard deviation were applied for average values analysis of each wave amplitude. The final step of experiment concerns with comparison of EEG patterns to find the differences between blinded people and normal people when touching objects in experiments. Statistical t-score and p-score are used to clarify the comparisons and hypothesis. The methodology is shown in Figure 5.
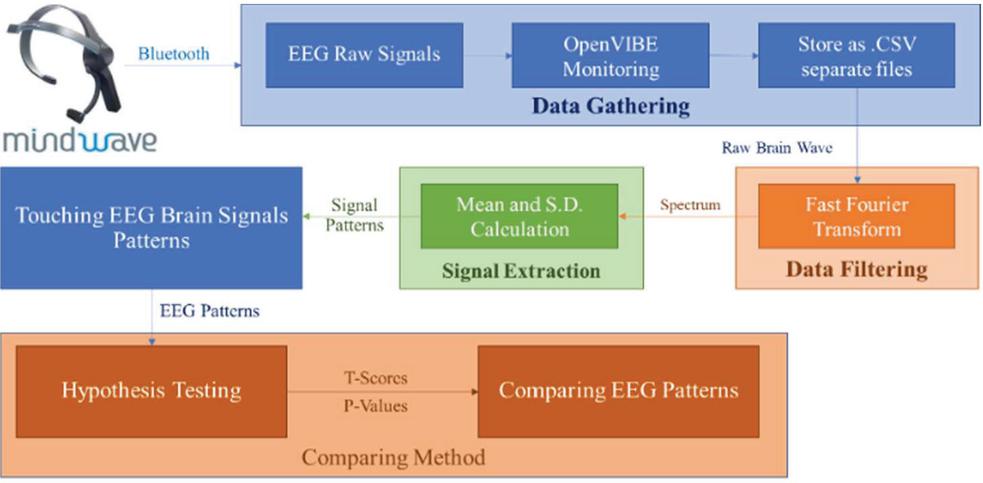
Figure 5 Overview of experiment workflow.
3.2 Data Collection Method
Four shapes of tactile picture were adopted as stimulus for experiments i.e., square, triangle, circle, and hexagon geometric shape as illustrated in Figure 6. Ten blinded people and ten normal people are participated.
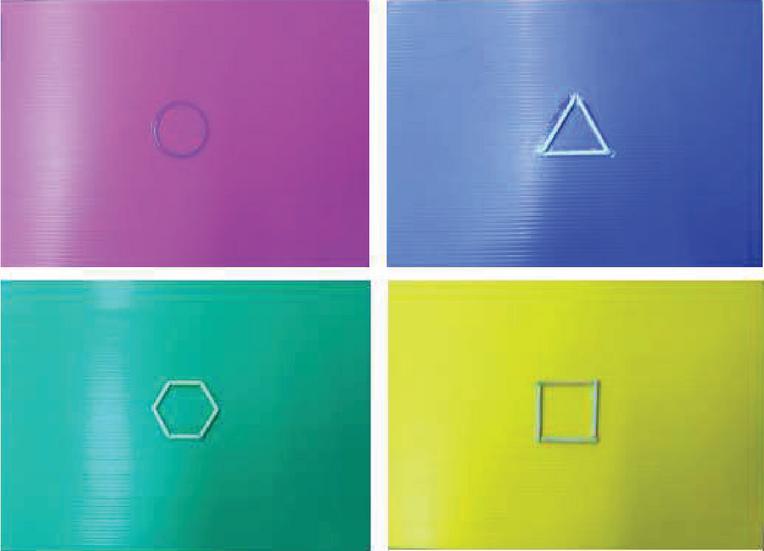
Figure 6 Tactile picture stimulus [21].
3.3 Data Collection Timing
In this part, timing diagram for data recording method is defined. The timing diagram, shown in Figure 7, is used to record data from five normal people and ten blinded people when they are touching on four shape tactile pictures.
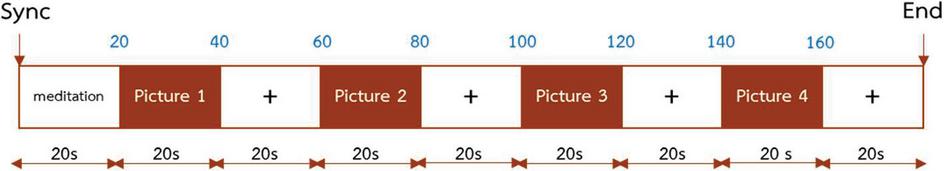
Figure 7 Timing diagram [21].
From Figure 7, one hundred and eighty seconds is spent for each person starting from meditation action period for twenty seconds. Then, participants began touching on first tactile picture for twenty seconds. Next, experimenters back to mediation again for twenty seconds. After that, they touched next tactile picture for another twenty seconds and back to meditation again. This process repeats until experimenter touch all tactile picture stimulus. All of data is recorded using OpenVIBE program while the EEG signal sampling rate on NeuroSky Mindwave is 512 Hz [21].
3.4 Data Analysing Method
In this research, six mathematic algorithms are used to describe experimental works i.e., voltage conversion formula, Fast Fourier Transform, mean values (), standard deviation values (), T-test score, and P-value. The mean values () calculate the sum of the dataset values divided by the number of datasets. value is an individual data points of brain wave signal in each type of them. value show the number of dataset size of each brain wave. The mean calculation shows with the following Equation (3)
| (3) |
The next calculation is standard deviation value (). This calculation is suitable for the measurement of variability. The equation is shown in (4).
| (4) |
is the Mean, relates to a sum of all individual data of each matrix in the same second, relate to the number of data points. The EEG signal sensed from the probe is converted to voltage using Equation 5 [3, 11] before being analysed by separating raw data into eight wave frequency bands using Fast Fourier Transform algorithm.
| (5) |
From (5) equation, is the Mean of raw values, 1.8 value relate to 1.8 V input voltage, value range set to 4096 and gain set to 2000. After that, MATLAB will be integrated to analyse spectrum of the wave from raw EEG signal by Fast Fourier Transform algorithm (FFT).
The final process of analysis is hypothesis testing with independent test. Statistical analysis is applied to compare each wave between normal people and blinded people EEG signal pattern while touching on tactile pictures. T-test score, Equation (6), were used with statistic significant at p 0.1. Moreover, all experiments were performed in switch-off electric instruments and quiet-sound control room. The recording computer was placed near EEG device in one-meter distance for reduce unnecessary signal when data recording. From (6) equation, is mean of each EEG signal value, is hypothesis, is variation of EEG signals and is a number of EEG.
| (6) |
4 Results and Discussion
After recording the EEG dataset from NeuroSky MindWave device via OpenVIBE, the datasets that are recorded in CSV files are analyzed using MATLAB tool. Then, the matrix variable was created and process by Fast Fourier Transform (FFT) algorithm. The Fast Fourier Transform results show the amplitude of each waveband spectrum which is important for finding the signal patterns of textile picture touching. Regarding general wave in EEG signal i.e., delta, theta, low-alpha, high-alpha, low-beta, high-beta, low-gamma, mid-gamma, and high-gamma [22], the EEG spectrum analysis show that the dominant EEG waves that response to picture touching activity are delta, theta, high-alpha and mid-gamma. Some examples of overall results from twenty volunteers, selected for only one normal volunteer (N1) and one blinded volunteer (B5), were shown in Figures 8 to 11 for explanation. Power spectral density unit was Volts-squared per Hz (V/Hz) [18].
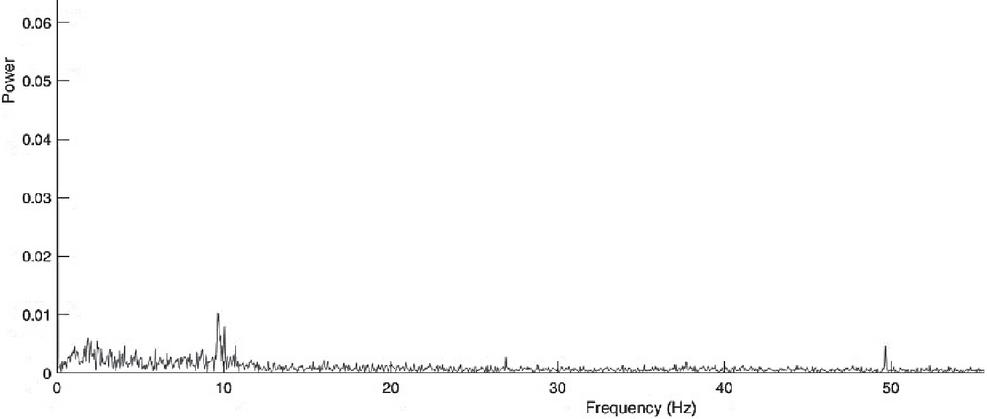
Figure 8 Circle shape meditation EEG power spectrum of normal volunteer (N1).
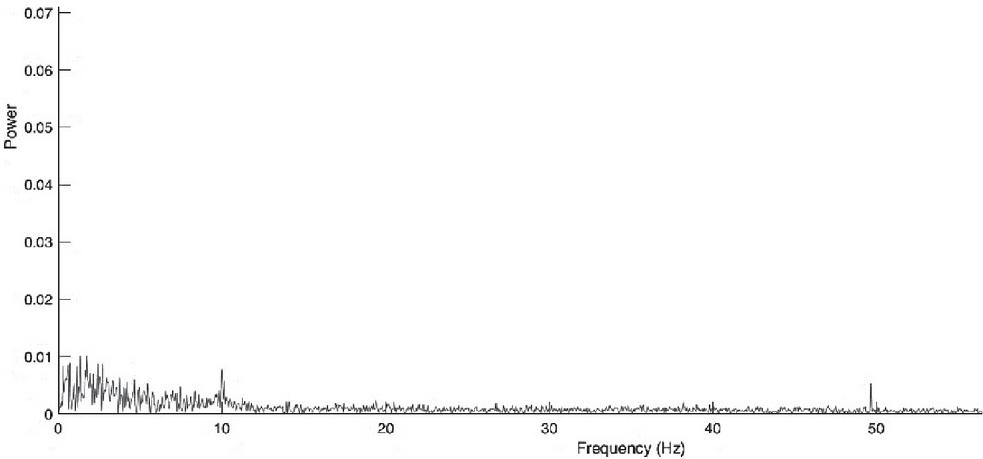
Figure 9 Circle shape touching EEG power spectrum of normal volunteer (N1).
From Figure 8, this sample graphs are EEG signal power spectral density of normal people while meditation before touching on tactile pictures. The graph shows powers spectral density of EEG dataset that was recorded at 512 Hz sampling frequency. The high amplitudes of power spectral density were shown in the graph at about 2, 10 and 50 Hz respectively.
In Figure 9, the graph presented the power of EEG signal spectrum of normal people while touching on circle shape tactile picture. The highest amplitudes of power spectral density were showed in the graph at about 2, 10 and 50 Hz similar to Figure 8, however, with more density on 0.1 to 10 Hz compared to Figure 8.
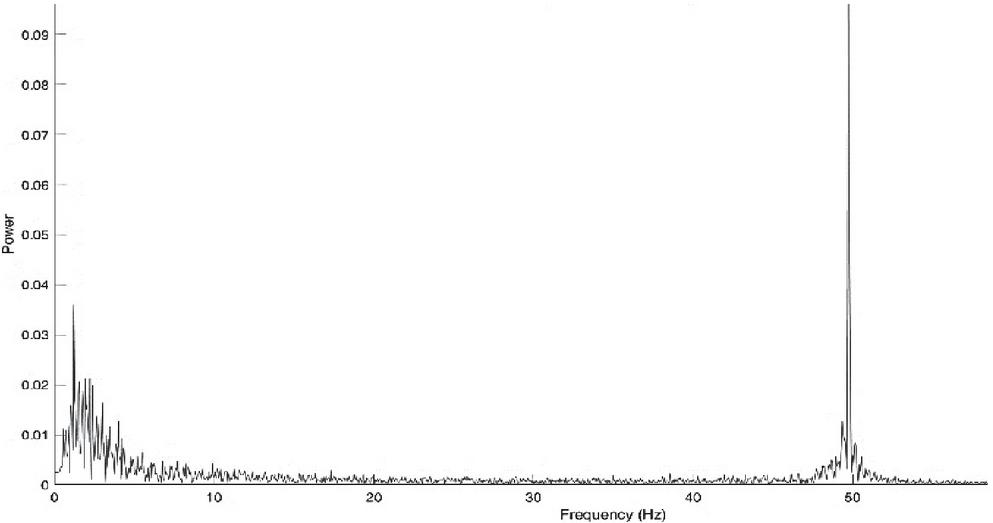
Figure 10 Circle shape meditation EEG power spectrum of blinded volunteer (B5).
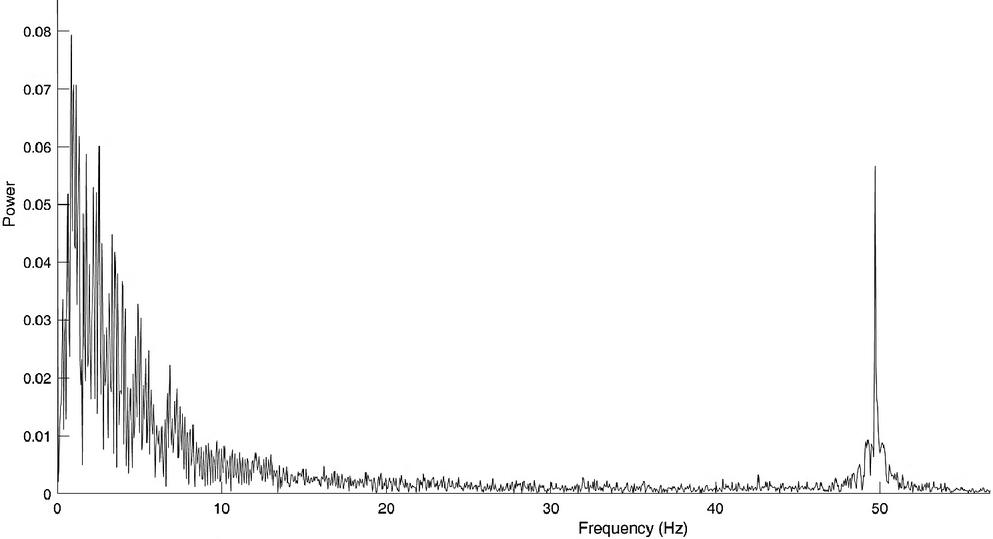
Figure 11 Circle shape touching EEG power spectrum of blinded volunteer (B5).
For Figure 10, this sample graph is EEG signal powers spectral density of blinded people while mediation before touching on tactile pictures. The graph showed high amplitude of powers spectral density on about 1 to 10 Hz and at 50 Hz while the amplitude at 50 Hz is much higher than normal volunteer like Figure 8.
In Figure 11, the graph presented the power of EEG signals spectrum of blinded people while touching on circle shape tactile picture. The amplitude of spectrum is much higher, compared to Figure 10, in the range 1 to 10 Hz, and the amplitude still high at 50 Hz.
The EEG voltage values during mediation and touching periods of four geometric shape tactile pictures were calculated. Then, amount of power under spectrum is calculated by finding area under curve (AUC) to compare numeric value of total power spectrum between normal people and blinded people dataset. The unit of absolute EEG power values was Volts-squared (V) [17].
Table 2 Comparison between normal people and blinded people EEG brain signal power when touching on circle shape tactile picture
| Normal People | Blinded People | |||||
| EEG Band | Mean | S.D. | Mean | S.D. | T-score | P-value |
| Delta | 0.018573 | 0.017490 | 0.023478 | 0.030303 | 0.331459 | 0.745581 |
| Theta | 0.013582 | 0.009403 | 0.019892 | 0.019571 | 0.673741 | 0.512278 |
| Low Alpha | 0.008852 | 0.011989 | 0.005547 | 0.003823 | 0.818458 | 0.427840 |
| High Alpha | 0.006088 | 0.002577 | 0.006174 | 0.003459 | 0.049310 | 0.961422 |
| Low Beta | 0.005658 | 0.001143 | 0.007297 | 0.003334 | 1.051903 | 0.312005 |
| High Beta | 0.013032 | 0.002246 | 0.015779 | 0.004725 | 1.216035 | 0.245592 |
| Low Gamma | 0.009089 | 0.001384 | 0.011469 | 0.004078 | 1.249068 | 0.233664 |
| High Gamma | 0.011380 | 0.003453 | 0.020422 | 0.008105 | 2.354712 | 0.034918* |
Table 3 Comparison between normal people and blinded people EEG brain signal power when touching on hexagon shape tactile picture
| Normal People | Blinded People | |||||
| EEG Band | Mean | S.D. | Mean | S.D. | T-score | P-value |
| Delta | 0.015911 | 0.013846 | 0.017416 | 0.018526 | 0.159549 | 0.875689 |
| Theta | 0.011792 | 0.006515 | 0.013359 | 0.008064 | 0.375388 | 0.713426 |
| Low Alpha | 0.007244 | 0.009013 | 0.004391 | 0.001446 | 1.013020 | 0.427840 |
| High Alpha | 0.005219 | 0.002073 | 0.004413 | 0.001002 | 1.036364 | 0.318930 |
| Low Beta | 0.005098 | 0.000804 | 0.005924 | 0.001318 | 1.274525 | 0.224789 |
| High Beta | 0.011649 | 0.001468 | 0.013715 | 0.002440 | 1.724325 | 0.108329 |
| Low Gamma | 0.007846 | 0.001146 | 0.009564 | 0.002235 | 1.595572 | 0.134597 |
| High Gamma | 0.012972 | 0.005711 | 0.016844 | 0.005415 | 1.283351 | 0.221775 |
The mean and standard deviation values of EEG brain signal power of normal people and blinded people are also calculated for used in pattern comparison analysis. All mean values of all shape tactile picture touching are compared and evaluated for hypothesis testing with independent test. The statistic significant was set at p 0.1 because of the sample group was small. In addition, the number of blinded people were ten persons and normal people are ten persons. The decreasing of sample size makes power of the test, one minus probability of Type II error, was decrease [6]. By using T-test scores and finding P-values to describe the meaning of blinded and normal people touching EEG wave. Results were showed in Tables 2 to 5.
For hypothesis testing with independent test, H and H were defined. The hypothesis was set to describe the different of each EEG frequency between normal and blinded people when touch on tactile pictures. H was define about blinded people use more brain operation than normal people that mention in Equation (7). H was define about blinded people use brain operation equal or less than normal people by Equation (8). was define to each EEG band of blinded people. was define to each EEG band of normal people.
| (7) | ||
| (8) |
Table 4 Comparison between normal people and blinded people EEG brain signal power when touching on square shape tactile picture
| Normal People | Blinded People | |||||
| EEG Band | Mean | S.D. | Mean | S.D. | T-score | P-value |
| Delta | 0.025988 | 0.038867 | 0.013226 | 0.010968 | 0.995292 | 0.337760 |
| Theta | 0.017025 | 0.018978 | 0.011494 | 0.004905 | 0.894330 | 0.387404 |
| Low Alpha | 0.012878 | 0.021257 | 0.003911 | 0.001122 | 1.384199 | 0.189600 |
| High Alpha | 0.007006 | 0.004261 | 0.004708 | 0.001499 | 1.569777 | 0.140479 |
| Low Beta | 0.006761 | 0.003667 | 0.005914 | 0.001441 | 0.655100 | 0.523827 |
| High Beta | 0.013401 | 0.004331 | 0.013805 | 0.003267 | 0.203474 | 0.841915 |
| Low Gamma | 0.008677 | 0.002133 | 0.009578 | 0.002288 | 0.733474 | 0.476289 |
| High Gamma | 0.011404 | 0.004317 | 0.017598 | 0.007478 | 1.696358 | 0.113617 |
Table 5 Comparison between normal people and blinded people EEG brain signal power when touching on triangle shape tactile picture
| Normal People | Blinded People | |||||
| EEG Band | Mean | S.D. | Mean | S.D. | T-score | P-value |
| Delta | 0.013321 | 0.008347 | 0.020452 | 0.024023 | 0.634524 | 0.536746 |
| Theta | 0.014088 | 0.011426 | 0.015549 | 0.012868 | 0.214348 | 0.833601 |
| Low Alpha | 0.009399 | 0.013905 | 0.004681 | 0.002325 | 1.083233 | 0.298388 |
| High Alpha | 0.006206 | 0.003815 | 0.005353 | 0.002138 | 0.563151 | 0.582915 |
| Low Beta | 0.005974 | 0.002345 | 0.006106 | 0.001387 | 0.137859 | 0.892464 |
| High Beta | 0.013195 | 0.003267 | 0.014329 | 0.002198 | 0.804275 | 0.435700 |
| Low Gamma | 0.008269 | 0.001714 | 0.010786 | 0.002764 | 1.845789 | 0.087814* |
| High Gamma | 0.011795 | 0.002982 | 0.019772 | 0.008194 | 2.075988 | 0.058295* |
Tables 2–5 show comparison between normal people and blinded people EEG brain signal power using statistical analysis quantities related to statistic significant at p 0.1 when touching on circle, hexagon, square and triangle shape tactile picture respectively. The results also show significant difference value on low-gamma and high-gamma (all gamma range) wave for blinded people as supposed to normal people. These results are similar to the ones from the previous spectrum analysis. But, delta, theta, low-alpha and high-alpha show in high value when touching learning [22]. P-value of these waves are not significant for blinded people as supposed to normal people.
5 Conclusion
This research performed EEG signal pattern analysis for touching learning of normal people and blinded people with inexpensive device. The following procedures were conducted, EEG datasets were recorded with NeuroSky Mindwave device connected to computer via Bluetooth. Then, EEG signal raw datasets were stored in csv format for analysis. Meaningful information was analyzed using FFT, Area Under Curve (AUC), mean, S.D., T-score, and P-value by sequence.
The first analysis process of EEG signal patterns during textile picture touching between normal people and blinded people had been studied by using power spectrum pattern comparison approach. A low-cost device with a single EEG prob, NeuroSky Mindwave, was used to detect EEG signals and recorded as dataset files in CSV format by OpenVIBE tool for later power spectrum analysis. By using FFT and AUC technique, the analysis shows that dominant EEG brain wave signals during tactile picture touching learning in normal people are delta, theta, high-alpha and mid-gamma while for blinded people, EEG signal wave patterns are observably higher than normal people in delta, theta, all alpha and all gamma ranges.
Besides spectrum analysis approach, statistical analysis using mean, S.D., T-score, and P-value were performed to verify the hypothesis of differences in EEG signal between normal people and blinded people. The results also show that both normal people and blinded people EEG signal are high on delta, theta, alpha and gamma during touching learning activities, however; blinded people EEG amplitude is usually higher than normal people especially in gamma range. The implication of these results are blinded people must use thinking, analysis, and recognition more than normal people. Also, gamma wave of blinded people is much higher due to the more muscle movement during touching learning process [12, 14].
Following from above conclusion, the touching learning method of blinded people is learned by touching used muscle moving activities more than normal people. In contrast, thinking and imagination method of them were the same with normal people learned. Additionally, important EEG band waves for learning with touch of normal and blinded people are delta, theta, alpha and gamma.
References
[1] A. Collins, E. Koechlin, ‘Reasoning, Learning, and Creativity: Frontal Lobe Function and Human Decision-Making’, PLoS Biol 10(3): e1001293, doi: 10.1371/journal.pbio.1001293, 2012.
[2] Blausen Medical, ‘Medical gallery of blausen medical 2014’, https://upload.wikimedia.org/wikiversity/en/7/72/Blausen\_gallery\_2014.pdf, 2014, Accessed 2017-03-29.
[3] C. Chenghu, S. Wicha, and R. Chaisricharoen, “Analysing the EEG Signal Effectiveness of Chiang Rai Arabica Drip Coffee on Individual Human Brainwave”, in ECTI-CIT, vol. 13, no. 2, pp. 178–187, Mar. 2020.
[4] E. A. Larsen, ‘Classification of EEG signals in a brain-computer interface system’, Master’s Thesis. Norwegian University of Science and Technology, Trondheim, Norway, 2011
[5] G. Schalk, and J. Mellinger, ‘A Practical Guide to Brain–Computer Interfacing with BCI2000’, pp. 9–10, Springer, London, March., 2010.
[6] K. Jae. How to Choose the Level of Significance: A Pedagogical Note’, https://mpra.ub.uni-muenchen.de/66373/1/MPRA\_paper\_66373.pdf, 2015, Accessed: 2021-10-20.
[7] L. Squire, D. Berg, F. Bloom, S. D. Lac, N. Spitzer, ‘Fundamental Neuroscience 3rd Ed’, Academic Press, North Carolina, USA, 2008.
[8] Meningitis Now and Meningitis Research Foundation, ‘Structure and function of the brain’, https://www.meningitis.org/getmedia/d6bf5d34-3b3a-453b-9811-72ccc6545685/Structure-and-function-of-the-brain-August-2017?disposition=attachment, 2017, Accessed: 2021-08-23.
[9] M. Z. Ilyas, P. Saad, M. I. Ahmad, ‘A Survey of analysis and classification of EEG signals for brain-computer interfaces’, in 2nd International Conference on Biomedical Engineering (ICoBE), Penang, 2015
[10] NeuroSky, ‘Brain Wave Signal (EEG) of NeuroSky’, Inc. http://www.frontiernerds.com/files/neurosky-vs-medical-eeg.pdf, December 2009, Accessed: 2021-08-16.
[11] NeuroSky, ‘How to convert raw values to voltage?’, http://support.neurosky.com/kb/science/how-to-convert-raw-values-to-voltage, 2016, Accessed: 2021-10-24
[12] NeuroSky, ‘MindWave mobile: user guide’, NeuroSky, Inc., CA, USA., 2015
[13] NeuroSky, ‘TGAM’, https://cdn.hackaday.io/files/11146476870464/TGAM\%20Datasheet.pdf, 2011, Accessed: 2021-10-20
[14] NeuroSky, ‘What are the different EEG Band Frequencies?’, http://support.neurosky.com/kb/science/eeg-band-frequencies, 2009, Accessed: 2021-07-15
[15] O. M. Matamoros, J. J. M. Escobar, R. T. Padilla, I. L. Reyes, ‘Neurodynamics of Patients during a Dolphin-Assisted Therapy by Means of a Fractal Intraneural Analysis’, Brain Sciences, 10(6), 403, 2020.
[16] S. Ramakuri, V. Kumar and B. Gupta, “Feature Extraction from EEG Signal through One Electrode Device for Medical Application”, in 1st International conference on Next Generation Computing Technologies (NGCT 2015), pp. 4–5, Dehradun, September 2015.
[17] V. Gandhi, ‘Brain-Computer Interfacing for Assistive Robotics’, Academic Press, London, UK, 2015.
[18] V. Raphael, ‘Compute the average bandpower of an EEG signal’, https://raphaelvallat.com/bandpower.html. 2018. Accessed: 2021-09-23.
[19] WebMD, ‘Picture of the Brain’, http://www.webmd.com/brain/picture-of-the-brain\#1, 2014, Accessed: 2019-04-30.
[20] W. Huang, ‘Fast fourier transform and MATLAB implementation’, https://personal.utdallas.edu/~dlm/3350\%20comm\%20sys/FFTandMatLab-wanjun\%20huang.pdf, N.d., Accessed: 2019-01-12.
[21] W. Lawpradit and T. Yooyativong, ‘Analysing Blinded People EEG Signals while Touching using Lightweight Device’, in The 6th International Conference on Digital Arts, Media and Technology (DAMT) and 4th ECTI Northern Section Conference on Electrical, Electronics, Computer and Telecommunications Engineering (NCON), pp. 407–411, Online Conference, 2021.
[22] W. Lawpradit and T. Yooyativong, ‘The brain signal patterns of surfaces and shapes touching behavior representation in EEG with the inexpensive device’, in The International ECTI Northern Section Conference on Electrical, Electronics, Computer and Telecommunications Engineering 2018 (ECTI-NCON 2018), pp. 115–120, Chiang Rai, 2018.
[23] W. Salabun, ‘Processing and spectral analysis of the raw EEG signal from the MindWave’, Przeglad Elektrotechniczny, nr 2, p. 90, 2014.
Biographies

Wachira Lawpradit received the bachelor’s degree in computer science from Mae Fah Luang University in 2006, the master’s degree in Internet and Information Technology from Naresuan University in 2008. Respectively. He is working as lecturer at the Department of Computer Information System, Faculty of Business and Liberal Art, Rajamangala University of Technology Lanna Lampang. His research areas include brain computer interfacing, geometric information system, management information system and community-based research.

Thongchai Yooyativong has received a Ph.D. degree in Electrical Engineering from Colorado State University, USA. Currently, he is a senior lecturer at School of Information Technology, Mae Fah Luang University, Thailand. He used to be a Vice President of Mae Fah Luang University and Dean of School of Information Technology. At Mae Fah Luang University, he has been involving in many projects concerning rural area developments such as the Tele-centre for rural education and rural area development, the digital ancient city: Chiang Saen Project, the IT entrepreneur development in Chiang Rai Province, and IoT for smart farming.

Roungsan Chaisricharoen received his Ph.D. degree in 2009 from the Department of Computer Engineering, King Mongkut’s University of Technology Thonburi, Thailand. He is an Assistant Professor of Computer Engineering at the School of Information Technology, Mae Fah Luang University, Thailand. He is now the chairperson of both the Master and Ph.D. programs in Computer Engineering. His research interests are Computational intelligence, data communication, optimization, application of ICT in agriculture, embedded system, and Analogue integrated circuits.
Journal of Mobile Multimedia, Vol. 18_6, 1777–1796.
doi: 10.13052/jmm1550-4646.18613
© 2022 River Publishers