Bi-level Flow Based Anomalous Activity Identification System for IoT Devices
Meenigi Ramesh Babu* and K. N. Veena
School of Electronics and communication Engineering, Reva University, Bangalore, Karnataka, India
E-mail: Ramesh010777@gmail.com
*Corresponding Author
Received 30 May 2021; Accepted 01 July 2021; Publication 26 August 2021
Abstract
With the advanced technologies, IoT has widely emerged with data collection, processing, and communication as well in smart applications. The wireless medium in the IoT devices would broadcast the data, which makes them easily targeted by the attacks. In the local network, the normal communication attack is restricted to small local domain or local nodes. However, the attack present in IoT devices gets expanded to a large area that would cause destructive effects. The heterogeneity and distribution of IoT services/applications make the security of IoT a more challenging and complex one. This paper aims to propose a bi-level flow based anomalous activity identification system in IoT. Initially, the flow based features get extracted along with the statistical features like mean, median, variance, correlation, and correntropy. Subsequently, Bi-level classification is carried out in this work. In level 1, the presence of attack is detected and the level 2 classification classifies the type of attack. A decision tree is used for detecting the attacks by checking whether the network traffic is anomalous traffic or normal traffic. In level 2, an Optimized Neural network (NN) is used for categorizing the attacks in IoT with the knowledge of flow features and statistical features. To make the detection and classification more accurate, the weight of NN will be optimally tuned by a new Combined Whale SeaLion Algorithm (CWSA) that hybridizes the concepts of both SLnO and WOA. At last, the performance of the adopted method is computed over other traditional models in terms of accuracy, sensitivity, specificity, precision, FPR, FDR, FNR, NPV, F1-score, and MCC.
Keywords: IoT, security, neural network, anomalies behaviour, optimization.
1 Introduction
IoT is one of the well-accepted frameworks that support many recent services and applications like public security, smart healthcare, smart homes, environment protection, and industrial monitoring [9, 10]. The majority of the existing smart devices could build a collaborative multichip IoT network. These devices collect the information from different control units or sensors that appropriates for certain strategies [11–13]. Moreover, these devices make use of different IoT protocols to transfer their data through Bluetooth, WI-Fi, ZigBee, etc. The multi-hop IoT network’s topology is adaptable, yet, it is susceptible, i.e. it suffers from certain attacks that reside in the network. In a multi-hop IoT network, the attackers could compromise those devices and use these devices launch DoS attacks or drop attacks, tamper with data and infer sensitive information [14. 15]. Hence, an efficient security mechanism for distinguishing the malicious nodes in IoT is mandatory.
The detection of attacks in IoT is performed in the fog layer. Each fog nodes present in fog layer is responsible to detect the attacks in IoT devices [16, 17]. At the fog layer, the storage and complex computation are offloaded from IoT devices by distributed attack detection. Moreover, the attack detection in IoT devices is broadly divided into two groups; they are an anomaly and signature-based detection. However, each group has its advantages and drawbacks [18, 19]. The attacks present in IoT devices were determined by gathering several data and computing those data with a set of rules or patterns in signature-based detection. Moreover, anomaly-based detection has designed an approach that includes the samples of normal behaviors with the consideration of deviation in the model. Nevertheless, these methods could not support the zero day attack detection [20, 21]. The most important problem in the attack detection model is to detect the attack without any predefined patterns or rule sets.
Recently, IoT devices have only some security features to protect against attacks. However, the systems must be safe from outside attacks and threats for better processing. It is not possible to provide device-level protection in heterogeneous environments [22, 23]. Stateful methods of the protocol are very expensive and protocol-dependent in computing, whereas the deep packet inspection in a high-speed network becomes a bottleneck. Because of these limitations, the research is focused on flow-based IDS as an option to secure IP networks. Still, the cyber attacks in CPS leads to failures and faults in physical systems. The most challenging aspect in the system is the automated compensation of fault effect and the maintainability of device performance to the acceptable level [24, 25]. The purpose of the control system is to maximize the availability of the system by implementing control algorithms which can maintain the stability and the performance of the network even in the presence of attacks. More research works explicitly with the impact of Met heuristic algorithms in enhancing the detection performance of the attacks [35, 37, 39, 40].
The main contribution of the adopted method is as follows:
• Introduces a bi-level classification process to detect anomalous activity in IoT. Level 1 reveals the presence of attack in the network and Level 2 determines the type of attack.
• Proposes a new CWSA to enhance the detection rate via optimizing the NN model.
In this paper, Section 2 describes the literature review of conventional attack detection models in IoT devices. Proposed intrusion detection system for IoT is described in Section 3. Feature extraction: flow-based features and statistical features are explained in Section 4. Section 5 portrays bi-level classification: impact of decision tree and optimized NN in detecting and classifying the attacks. Section VI depicts the proposed combined whale sea lion algorithm for optimal tuning of weight. The results and discussions of the proposed work are represented in Section 5. Finally, Section 6 concludes the paper.
2 Literature Review
2.1 Related Works
In 2020, Sudhakaran et al. [1] have presented the avoidance framework, attack detection, and authorization structure for IoT devices. The traffic collection agent has collected the flow level information and packet-level data based on a specific period. Here, the DA has validated the gathered data with the attack rules table. If the attack pattern was matched, the attack type was informed to RA. Moreover, if no matching pattern is obtained, then the classification agent has applied the multi-class SVM algorithm. At last, the experimental outcomes of the presented work have shown better detection accuracy, improved FPR, and reduced unauthorized access than other existing models.
In 2020, Hossain et al. [2] have introduced an attack scenario in co-located CR-IoT network. The attack could interfere the transmission via HTE attack. The behavior of HTE attacker and the benign hidden terminal was captured by parsimonious Markov models. The proposed method has implemented the hypothesis based on Markov chain testing (i.e.), 3rd eye based on the solution of context-aware detection. This is the first work that the benign interference sources are considered by hidden terminals and leverages the traditional carrier sensing approach as an efficient way for detecting the various attacks.
In 2018, Shailendra et al. [3] have proposed the fog-based attack detection approach, which has relied on the fog computing environment. Also, they have proposed an ESFCM method. The cloud computing process was extended to fog computing that supported the distributed attack detection and has allowed the attack detection in network edges. Also, the proposed ESFCM framework has handled the labeled data problems. ELM algorithm was used to obtain the fast detection rate. Finally, the performance of the adopted method has achieved less detection time and a higher detection accuracy rate than the traditional models.
In 2019, Liang et al. [4] have developed a PD model that used K-means and perceptron model for detecting the malicious nodes and also for computing the IoT nodes’ trust values. The proposed method has examined the problems and then formalized a multiple-mix-attack framework. For increasing the accuracy during detection, the route of the network was optimized and designed a PDE based on the enhanced perceptron learning process. At last, the simulation outcomes of the presented framework have achieved improved performance and higher detection accuracy of malicious nodes.
In 2020, Manimurugan et al. [5] have introduced a DBN algorithm for IDS. The DBN has included the stacked RBMs to perform the execution during the unsupervised domain and also the greedy layer-wise training. Here, the DBN training was done layer by layer. Moreover, each one was executed as RBM trained and hence utilized in the pre-training stage. Also, they are turned to the feed-forward network by tuning the weights via various techniques. The performance analysis was carried out using CICIDS 2017 dataset. At last, the performance of the implemented model has shown better outcomes in terms of accuracy, F1-score, detection rate, precision, and recall.
In 2019, Raoof et al. [6] have determined RPL and the mitigation technique to counter the attacks in the network. Moreover, a detailed study on RPL standard has been included along with a recently proposed modification. A first-of-its-kind classification approach was introduced for the mitigation process. The hybrid IDS along with RPL’s Specification-based IDSs and SVELTE were the best solution for mitigating various RPL attacks. Finally, the simulation outcomes of the adopted model have revealed the faster detection of attacks, longer network lifetime, and better delivery rate as well.
In 2020, Farivar et al. [7] have presented a hybrid intelligent-classic control model used for compensation and reconstruction of cyber attacks. Here, the cyber attacks were initiated in the inputs of industrial IoT systems and nonlinear CPS worked in a shared communication network. The class of n-order nonlinear approaches was known as the CPS model when the presence of cyber attacks in the forward channel. To compensate the cyber-attacks, the proposed work has developed an intelligent classic control system. Moreover, the GRBFNN was used for the reconstruction of cyber attacks and also for the online estimation launched in network systems. At last, the performance of the adopted method has achieved better efficiency, increased safety, and reliability than other existing models.
In 2020, Latif et al. [8] have implemented a novel lightweight RaNN-based prediction model for predicting the attacks in devices. While applying the machine learning techniques, several Cybersecurity attacks like scan, data type probing, malicious operation, wrong setup, spying, and malicious control DoS were predicted in the proposed work. Certain evaluation parameters like accuracy, F1 score, recall, and precision were calculated and compared with conventional SVM, DT, and ANN for estimating the performance of the proposed RaNN-based prediction method. Finally, the performance of the adopted framework has proven lower processing time, higher accuracy, improved precision, recall, and F1 score when compared to other traditional models.
Table 1 Review on conventional attack detection model in IoT: features and challenges
| Author | Adopted | ||
| [Citation] | Scheme | Features | Challenges |
| Sudhakaran et al. [1] | SVM method |
• Reduced unauthorised access • Better FPR • Increased detection accuracy • Improved throughput. |
• The attack response was not performed based on the severity of the attack. |
| Hossain et al. [2] | Markov Model |
• Better attack performance • Improved detection strategy • Increased packet service rate. |
• The computational cost is higher than some traditional techniques. |
| Shailendra et al. [3] | ESFCM method |
• Better performance • Lower detection time • Improved accuracy rate |
• The ELM applied in the adapted method provided low performance based on the random assignment of input bias and weights. |
| Liang et al. [4] | Multivariable linear regression model |
• Higher detection accuracy • Increased malicious nodes • Reduced error rates |
• The exact malicious node present in various attack types was not identified. |
| Manimurugan et al. [5] | DBN Model |
• Better accuracy • Improved recall • Maximum precision • Better detection rate • Higher F1-score |
• Several IDS datasets and different types of attacks against the IoT devices were not considered. |
| Raoof et al. [6] | SGSD method |
• Better delivery rate • Longer network lifetime • Faster detection of attacks |
• Need to optimize the resource usage in IDSs. |
| Farivar et al. [7] | GRBFNN method |
• Improved efficiency • Improved reliability and safety |
• Adjustment in mean, standard deviation, and weighting vectors of Gaussian functions was not considered. |
| Latif et al. [8] | RaNN model |
• Lower processing time • Higher accuracy • Improved precision, recall, and F1 score |
• Real-time experiments were not conducted in the proposed model. |
2.2 Review
Table 1 demonstrates the reviews on conventional attack detection in IoT. Initially, SVM method was presented in [1] that offers reduced unauthorized access, better FPR, increased detection accuracy, and improved throughput. Nevertheless, the attack response was not performed based on the severity of the attack. Markov Model was developed in [2] that offer better attack performance, improved detection strategy, and increased packet service rate, but the computational cost is higher than some traditional techniques. In addition, ESFCM method was used in [3], which provides better performance, lower detection time, and improved accuracy rate; nevertheless, the ELM applied in the adapted method provided low performance based on the random assignment of input bias and weights. Also, Multivariable linear regression model was employed in [4] that provides higher detection accuracy, increased malicious nodes, and reduced error rates. However, the exact malicious node present in various attack types was not identified. Likewise, the DBN model was presented in [5] that efficiently better accuracy, improved recall, maximum precision, better detection rate, and higher F1-score. However, need to focus more on several IDS datasets and different types of attacks against the IoT devices. In addition, SGSD method was deployed in [6] that ensure a better delivery rate, longer network lifetime, and faster detection of attacks. Nevertheless, it needs to optimize the resource usage in IDSs. GRBFNN method was deployed in [7] that provide better efficiency, improved reliability, and safety; however, an adjustment in mean, standard deviation, and the weighting vectors of Gaussian functions was not considered. RaNN model was presented in [8, 42] that offer lower processing time, higher accuracy, improved precision, recall, and F1 score; but, the real-time experiments were not conducted in the proposed model. These limitations have to be taken in account for enhancing the attack detection model in IoT.
3 Proposed Intrusion Detection System for IoT
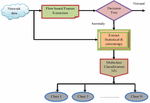
This paper proposed a bi-level flow-based anomalous activity identification system for IoT devices. Figure 1 illustrates the overall architecture of the proposed methodology. The steps are as follows:
• Step 1: The input data are subjected to a feature extraction process, where the flow-based features get extracted. Meanwhile, the statistical features are also evaluated like mean, median, variance, correlation, and correntropy.
• Step 2: Subsequently, the bi-level classification is carried out, where the Level-1 classification uses the decision tree to identify the presence of attack in the network based on the flow information.
• Step 4: The Level-2 classification results in the type of attack present in the network via the knowledge of both the flow features and the evaluated statistical features. For this classification, an Optimized Neural network (NN) is introduced, in which the weights are optimally tuned.
• Step 5: A new CWSA is introduced for solving this optimization issue, which is the hybrid form of both the SLnO and.
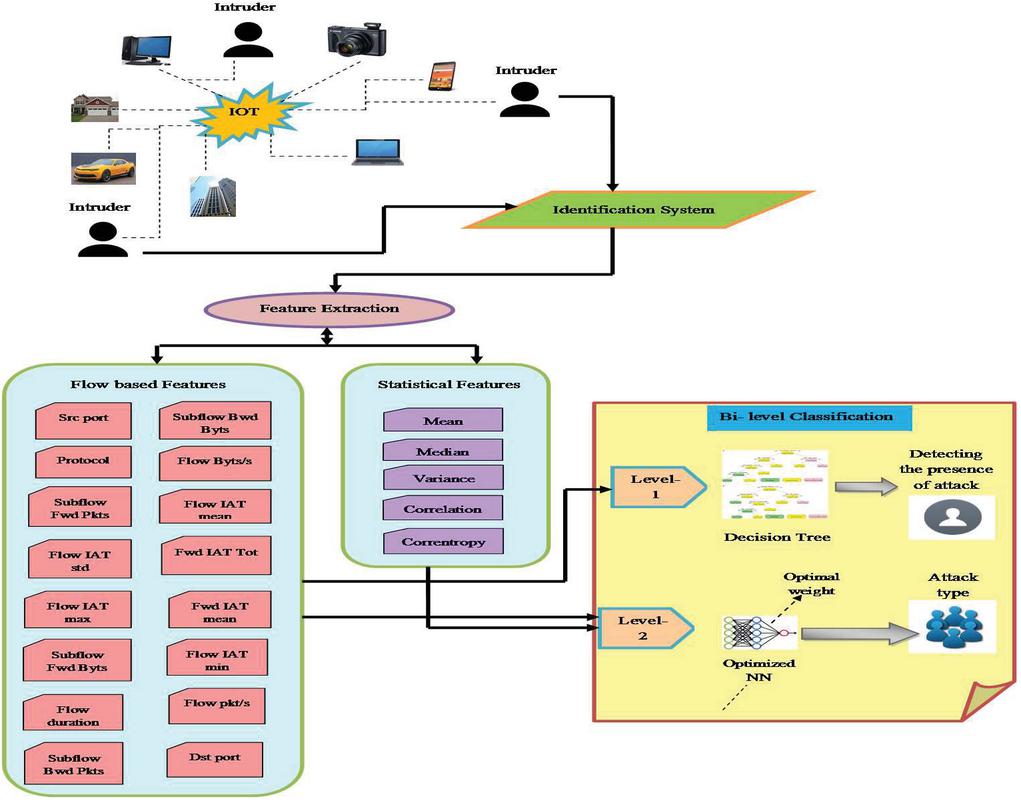
Figure 1 Overall architecture of proposed methodology.
4 Feature Extraction: Flow-based Features and Statistical Features
The feature extraction phase consists of the extraction of two types of features including flow-based features from data and statistical features. Here, the flow-based features are selected from the database as in source-destination IP address, port-protocol types, and transaction flow details. Figure 2 shows the flow diagram of the proposed work.
Flow-based Features : The flow based features are selected from the database includes 16 features like Src port, Fwd IAT mean, Sub flow Bwd Byts, Flow IAT min, Protocol, Flow Byts/s, Flow IAT mean, Subflow Fwd Pkts, Flow IAT std, Fwd IAT Tot, Flow IAT maxSubflow Fwd Byts, Flow duration, Flow pkt/s, Sub flow Bwd Pkts, and Dst port. Based on the flow-based features, the binary classification will be performed.
Statistical Features : The statistical features [41] like mean, median, variance, correlation, and correntropy are calculated.
Mean (Average): The process in which the sum of all values divided by the total number of values is known to be mean value. the
| (1) |
In Equation (1), refers to the observed value, represents the sample size, and indicates the symbol of the sample mean.
Median: Median is defined as the process in which the middle value in a dataset is organized in ascending order. If the dataset contains two values in middle, then the mean of two middle values is taken as the median of the dataset.
| (2) |
In Equation (2), represents the number of values and denotes the ordered list of values in the dataset.
Variance: “Variance is the expectation of squared deviation in the random variable from its mean”. Moreover, it calculates how far a group of numbers is extended from its average value.
| (3) |
In Equation (3), indicates the number of observations, represents the value of one observation, describes the sample variance, and denotes the mean value of all observations.
Correlation: The correlation is known to be the statistical measure of the relationship among two variables. In addition, the correlation coefficient specifies the strength of the relationship among two variables as expressed in Equation (4), Where, refers to the correlation coefficient among the variables and , indicates the mean values of -variable, specifies the values of the -variable in a sample, indicates the mean values of the -variable and specifies the values of -variable in a sample.
| (4) |
Correntropy: The correntropy measure is used to estimate the similarities of the adopted feature vectors, in which the measures would find the difference between attack and normal instances. The correntropy is expressed as in Equation (5), where, specifies the kernel size and denotes the Gaussian kernel function.
| (5) | |
| (6) |
Finally, the obtained . Subsequently, the bi-level classification is carried out based on the extracted features.
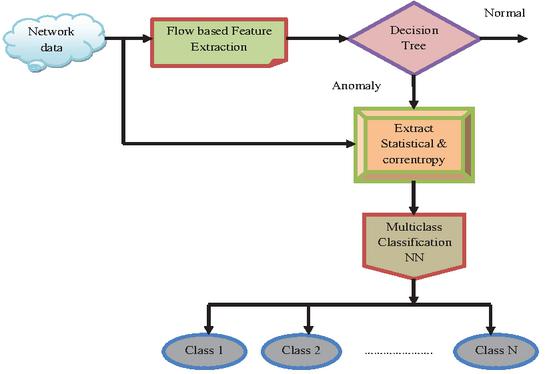
Figure 2 Flow diagram of proposed work.
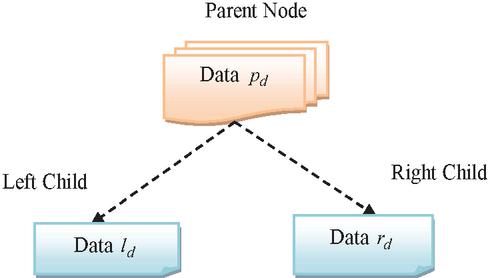
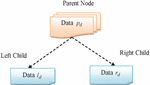
Figure 3 Pictorial representation of decision tree.
5 Bi-Level Classification: Impact of Decision Tree and Optimized NN in Detecting and Classifying the Attacks
5.1 Level-1 Classification
In level-1 classification, the Decision Tree classifier is used for identifying the presence of attack in IoT. Each node in the DT [29] has allowed for evaluating the possible actions against each other depending on their probabilities, costs, and benefits. Generally, the DT is a map with possible resultant to a sequence of related options. Here, the DT begins from a single node and it branches to the expected outcome. The outcome obtained from each node leads to extra nodes that branch into various instances. Figure 3 illustrates the pictorial representation of the decision tree working scenario. The two children node such as a right child and a left child is divided from a parent node. Moreover, the right child left child, and parent node hold the data such as , and , correspondingly. Let us consider the impurity measure , the number of samples present in parent node is indicated as , features , the number of samples present in right child represented , and the number of samples in the left child is denoted as . Moreover, the DT’s target would increase the information gain in Equation (7).
| (7) |
The impurity measure is computed using 3 techniques such as Entropy , Gini Index and Classification Error . Furthermore, the different impurity measures are defined in Equation (8) to Equation (10), where, refers to any node, indicates the classes or labels, and describes the ratio of with respect to .
| (8) | ||
| (9) | ||
| (10) |
Here, the level-1 model is trained for binary classification. If the obtained class (binary value) is 1, then it indicates that the network (IoT) [44] exists with the attack and if the binary value is 0, then it indicates that there is no attack present in IoT (i.e., normal). Both the decisions are based on the flow based features. Once if the anomalous flow is detected in this level, the control is forward to the level 2 classification to differentiate the type of attack in IoT.
5.2 Level-2 Classification
As mentioned above, both the flow based features and statistical features are subjected to Optimized NN model. The input given to the NN [30, 36, 38] is the extracted features defined in Equation (11).
| (11) |
Moreover, the NN structure includes the input, hidden and output layers. The hidden layer output is defined as in Equation (12), where, and refers to the neurons in hidden layer and input layer respectively, indicates the weight between the input neuron to hidden neuron, denotes the input neurons count, depicts the bias weight with hidden neuron and portrays the activation function. In addition, the network output is given in Equation (14), where, specifies the number of hidden neurons, refers to the output neurons, specifies the weight among the hidden layers to output layer, and portrays the output bias weight of output layer. Consequently, the error that occurred between the predicted and actual values is defined in Equation (14), which should be minimal for the precise classification of the attack types. Here, indicates the output neuron count, the actual and predicted outputs are indicated as and , correspondingly. The weights are optimally tuned by a new CWSA algorithm.
| (12) | ||
| (13) | ||
| (14) |
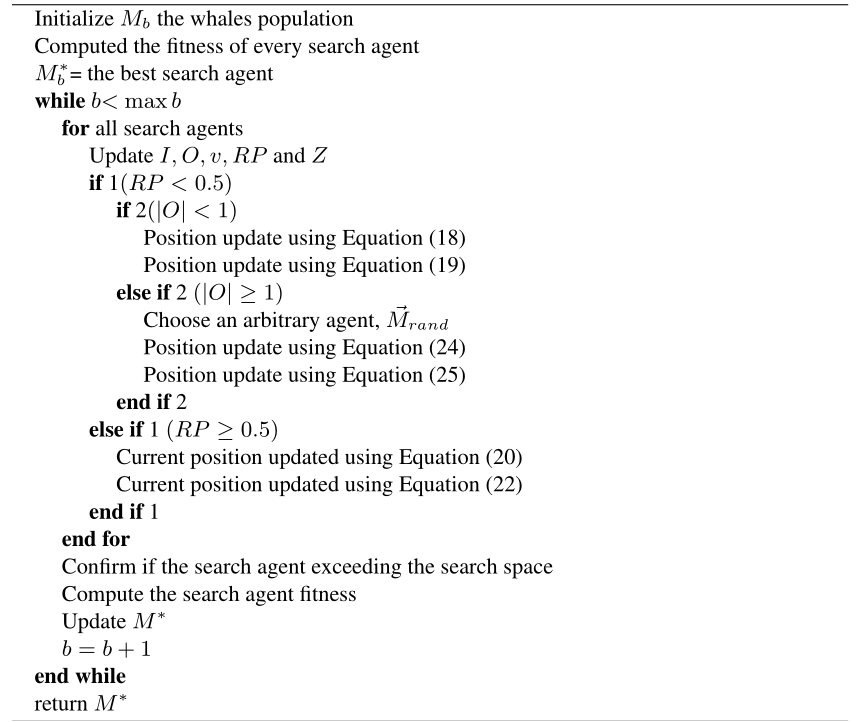
6 Proposed Combined Whale SeaLion Algorithm for Optimal Tuning of Weight
6.1 Proposed CWSA
Even though the existing WOA scheme provides better outcomes, the algorithm gets stuck with local optima that affect the optimization process and convergence rate. Consequently, to conquer the disadvantages of the traditional WOA model, the concept of SLnO is combined with the WOA [32] to make the model stronger in each updating process. The hybrid optimization algorithms have been reported to be promising for certain search problems [28].
The procedure of implemented CWSA method is as follows: Conventionally, the position is updated depending on the neighborhood of the present best solution in WOA. However, as per the proposed CWSA method, once the position gets updated by the WOA, it is again updated by the SLnO updates.
If the best search agent is once find, the other search agents try to update their positions as shown in Equations (17) and (18). Here, denotes the current iteration, indicates the best solution attained always, ‘’ specifies an element-by-element multiplication, and represents the coefficient vectors, and portrays the absolute value. Moreover, the and vectors in WOA are specified in Equation (15) and Equation (16), where, indicates the random vector ranges from [0, 1] and is reduced from 2 to 0 in both exploitation and exploration phases during iterations.
| (15) | |
| (16) | |
| (17) | |
| (18) |
Subsequently, the sea lion update takes place as per Equation (19), where, specifies the next iteration, denotes the distance between the target prey and sea lions, is linearly reduced from 2 to 0 for further iterations, indicates the current iteration, and specifies the location vectors of the sea lions and target prey, correspondingly.
| (19) |
Exploitation phase: “Shrinking encircling model”: In this phase, the value is decreased as per Equation (15).
“Spiral Updating position”: The spiral formula was generated between the whale and position of prey are expressed in Equation (20), where, specifies the distance between the whale and prey, is a parameter that lies between and indicates the spiral variable. Equation (21) can be modified as in Equation (25), where depicts the arbitrary integer between .
| (20) | ||
| (21) |
Equation (22) describes the position update for bait ball of fishes chased and attacked by sea lion, where, ||specifies the correct value, is a random number in , represents the distance among the search agent, and target prey.
| (22) |
Exploration phase: The search agent position is randomly updated by the selected search agent as in Equations (23) and (24), where, specifies the random position vector selected from the current population.
| (23) | |
| (24) |
Additionally, the sea lions are changing their positions based on the best searching agent. The position update is represented as in Equations (25) and (26).
| (25) | |
| (26) |
In Equation (25), represents the random sea lion chosen from the current population, variable is reduced from 2 to 0 throughout the iterations. The pseudo code of the adopted CWSA method is represented in Algorithm 1.
Algorithm 1 Pseudocode of proposed CWSA model
7 Results and Discussions
7.1 Simulation Procedure
The proposed attack detection model in IoT was implemented in MATLAB. Moreover, the proposed NNCWSA scheme was computed over other existing schemes like SVM [1] and KNN [31, 43] in terms of certain measures like “accuracy, sensitivity, specificity, and precision, FPR, FDR, FNR, NPV, F1-score, and MCC”. Here, the performances were carried out concerning varied learning rate that ranges from 60, 70, 80 and 90. In addition, error analysis was carried out for both proposed and conventional models. The dataset was collected from https://sites.google.com/view/iotbotnetdatset/home.
Performance Analysis
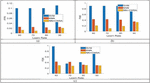
The performance analysis of the adopted attack detection model by NNCWSA over the conventional models like SVM and KNN in terms of certain measures are represented in Figures 4–6. Moreover, the performance analysis of the proposed NNCWSA method over other traditional models for positive measures such as accuracy, sensitivity, specificity, and precision are illustrated in Figure 4. The accuracy of the proposed NNCWSA method obtains the maximum values (0.9) at learning rate 90 and the traditional models obtain the minimum values for SVM (0.15) and KNN (0.78) as per Figure 4(a). Moreover, Figure 4(b) indicates the sensitivity of the proposed NNCWSA algorithm for learning rate 60 and is 88.09% and 32.14% better than the existing schemes like SVM and KNN. Furthermore, the conventional models like SVM and KNN have shown the least values for specificity measure at learning rate 70, however, the proposed NNCWSA method holds a maximum value of (0.9) in Figure 4(c). Similarly, in Figure 4(d) the adopted NNCWSA model is 30.55% and 16.67% superior to the conventional models like SVM and KNN, respectively for learning rate 80with higher precision.
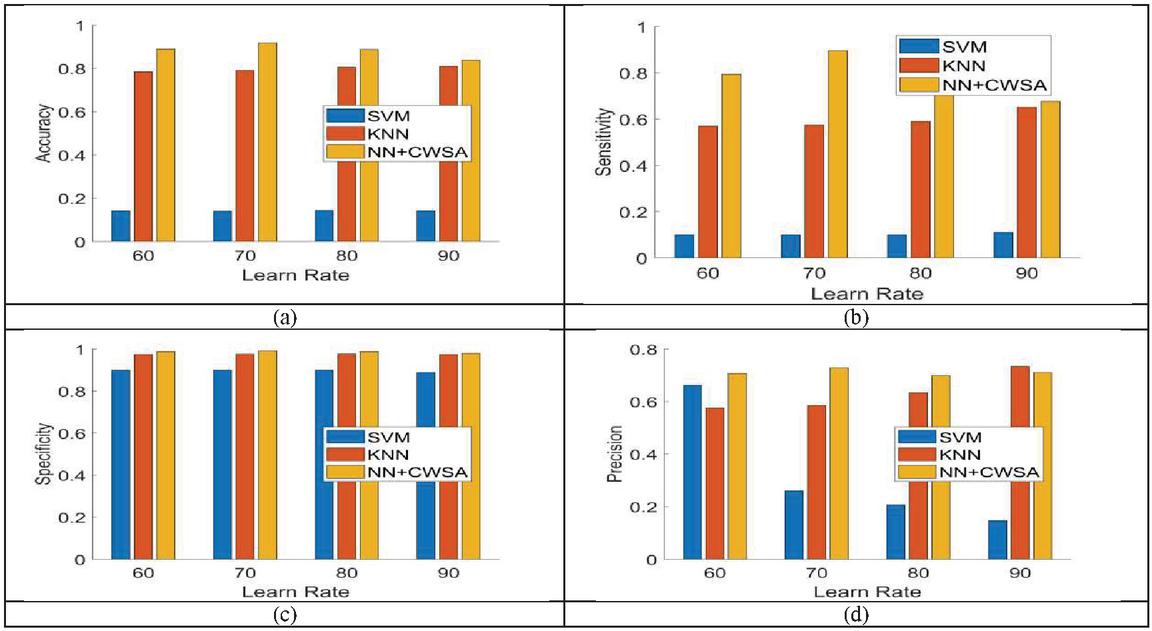
Figure 4 Performance analysis of adopted NNCWSA scheme over existing models for positive measures like (a) accuracy (b) sensitivity (c) specificity (d) precision.
The performance analysis concerning negative measures like FPR, FNR, and FDR is revealed in Figure 5. To obtain better performance in Figure 5(a), the values of FPR measures should be low. The adopted NNCWSA method remains with less FPR (0.01) when the learning rate is 60 and the conventional models like SVM and KNN have obtained the values of (0.1) and (0.025). In Figure 5(b), the proposed NNCWSA method for all learning rates has shown minimum values with better performance, but the existing schemes like SVM and KNN obtain higher values. An improvement of 46.15% and 15.38% is obtained by the proposed NNCWSA method for learning rate 90 over the existing models like SVM and KNN in terms of FDR (Figure 5(c)).
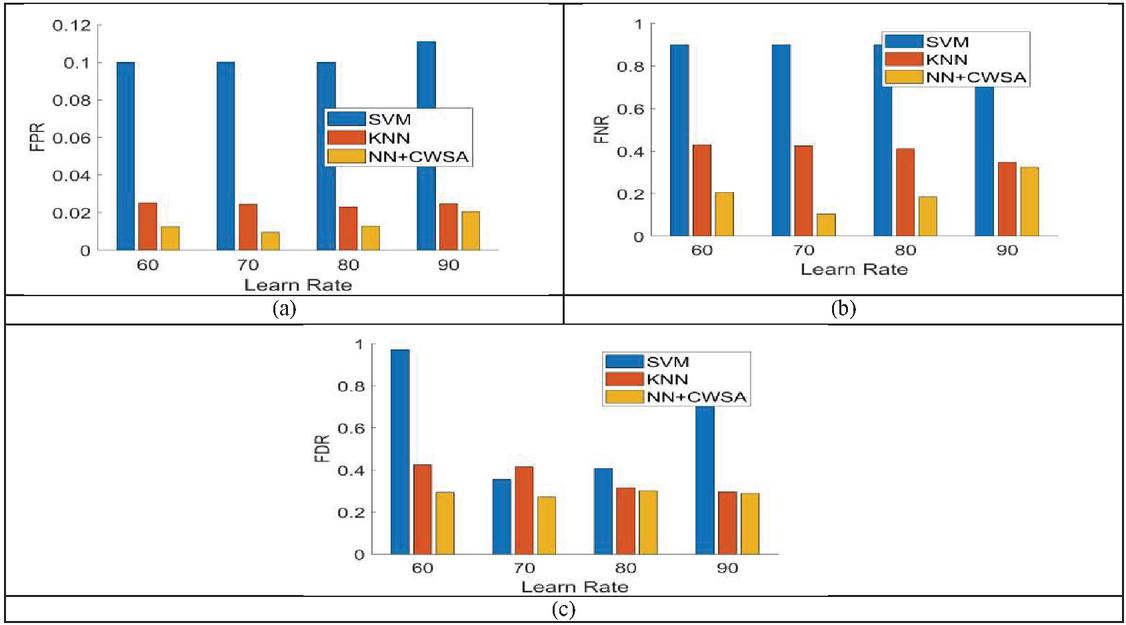
Figure 5 Performance analysis of adopted NNCWSA scheme over existing models for negative measures like (a) FPR (b) FNR (c) FDR.
Figure 6 illustrates the performance analysis under other measures like NPV, F1-score, and MCC. In Figure 6(a), the NPV measure of the proposed NNCWSA method attains the highest value (0.99) for learning rate 70, whereas the compared conventional models like SVM and KNN have attained lowest values of 0.9 and 0.96, correspondingly. For better performance, the F1-score hold the maximum values. However, in Figure 6(b) the F1-score of the adopted NNCWSA scheme shows an improvement of 93.90% and 21.95% over the existing models like SVM and KNN for learning rate 90. Furthermore, the performance of the proposed NNCWSA method for learning rate 80 obtains a maximum value (0.7) than other traditional models like SVM and KNN for MCC measures in Figure 6(c). Finally, the adopted NNCWSA method is superior to other existing models concerning various performance measures.
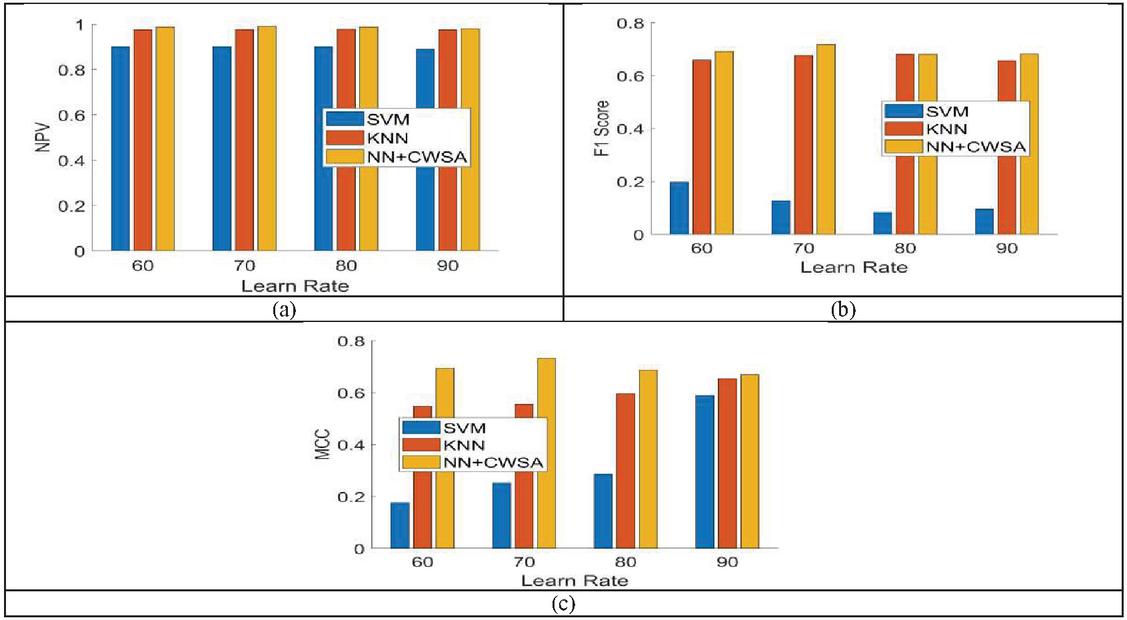
Figure 6 Performance analysis of adopted NNCWSA scheme over existing models for other measures such as (a) NPV (b) F1-score (c) MCC.
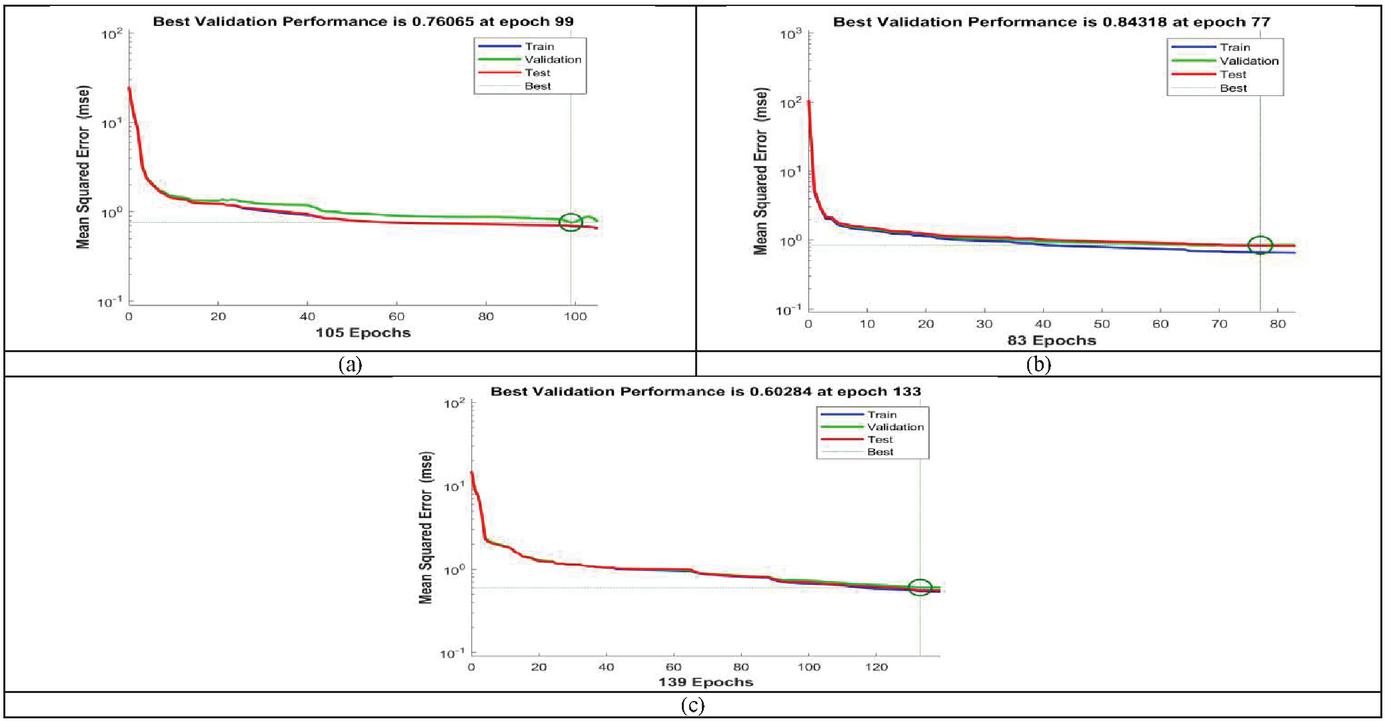
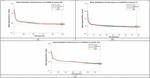
Figure 7 Error analysis (a) NNWOA (b) NNSLnO (c) NNCWSA.
Error Analysis
The error analysis of the proposed NNCWSA method over the conventional model like NNWOA and NNSLnO is shown in Figure 7. Moreover, the error analysis was performed based on train, validation test, and best values of each algorithm. From the figure, it is shown clearly that the adopted NNCWSA method attains best outcomes than other traditional models. Here, the error analysis was taken by varying the Epochs. In Figure 7(a), the error analysis of the conventional model (i.e.) NNWOA obtains best validation performance of 0.76065 at epoch 99. Furthermore, the error analysis of NNSLnO model holds the best validation performance of 0.84318 at epoch 77 in Figure 7(b). Finally, the error analysis of the proposed NNCWSA method attains the best validation performance of 0.60284 (i.e.) lowest values at epoch 133 as shown in Figure 7(c). When comparing with the traditional models like NNWOA and NNSLnO, our proposed NNCWSA method holds the least error performance, which shows the precise detection of attacks by the proposed system.
7.2 Performance Analysis Under Level 1 Classification
The overall performance analyses of RF [32], NB [34], and DT [33] in level-1 classification for various measures at learn rates 60, 70, 80, and 90, respectively is illustrated in Tables 2–5. On observing the table, the proposed model (DT) shows high accuracy, NPV, sensitivity, F1-score, specificity, and MCC at learn rate 60. Similarly, the proposed model (DT) attains minimal FPR, FNR, and FDR values for all the learning rates when compared to other conventional models like RF and NB. This proves the impact of DT in detecting the presence of attack in IoT.
Table 2 Level 1 classification analysis for learning rate 60
| Metrics | RF | NB | DT |
| Accuracy | 0.98175 | 0.94688 | 0.997 |
| Sensitivity | 0.63727 | 0.13168 | 0.96398 |
| Specificity | 1 | 0.99006 | 0.99875 |
| Precision | 1 | 0.41245 | 0.9761 |
| FPR | 0 | 0.009938 | 0.00125 |
| FNR | 0.36273 | 0.86832 | 0.036025 |
| FDR | 0 | 0.58755 | 0.023899 |
| NPV | 1 | 0.99006 | 0.99875 |
| F1-score | 0.77845 | 0.19962 | 0.97 |
| MCC | 0.79073 | 0.21168 | 0.96844 |
Table 3 Level 1 classification analysis for learning rate 70
| Metrics | RF | NB | DT |
| Accuracy | 0.98142 | 0.94683 | 0.99742 |
| Sensitivity | 0.63622 | 0.12072 | 0.97227 |
| Specificity | 1 | 0.99131 | 0.99877 |
| Precision | 1 | 0.42775 | 0.97705 |
| FPR | 0 | 0.008694 | 0.00123 |
| FNR | 0.36378 | 0.87928 | 0.027732 |
| FDR | 0 | 0.57225 | 0.022951 |
| NPV | 1 | 0.99131 | 0.99877 |
| F1-score | 0.77767 | 0.1883 | 0.97465 |
| MCC | 0.78993 | 0.20691 | 0.97329 |
Table 4 Level 1 classification analysis for learning rate 80
| Metrics | RF | NB | DT |
| Accuracy | 0.981 | 0.94612 | 0.99787 |
| Sensitivity | 0.63462 | 0.11779 | 0.97596 |
| Specificity | 1 | 0.99156 | 0.99908 |
| Precision | 1 | 0.43363 | 0.98305 |
| FPR | 0 | 0.008439 | 0.000923 |
| FNR | 0.36538 | 0.88221 | 0.024038 |
| FDR | 0 | 0.56637 | 0.016949 |
| NPV | 1 | 0.99156 | 0.99908 |
| F1-score | 0.77647 | 0.18526 | 0.97949 |
| MCC | 0.78876 | 0.20574 | 0.97838 |
Table 5 Level 1 classification analysis for learning rate 90
| Metrics | RF | NB | DT |
| Accuracy | 0.978 | 0.942 | 0.9975 |
| Sensitivity | 0.61233 | 0.11454 | 0.96035 |
| Specificity | 1 | 0.99178 | 0.99973 |
| Precision | 1 | 0.45614 | 0.99543 |
| FPR | 0 | 0.008216 | 0.000265 |
| FNR | 0.38767 | 0.88546 | 0.039648 |
| FDR | 0 | 0.54386 | 0.004566 |
| NPV | 1 | 0.99178 | 0.99973 |
| F1-score | 0.75956 | 0.1831 | 0.97758 |
| MCC | 0.77355 | 0.20755 | 0.97643 |
8 Conclusion
This paper has introduced a bi-level flow-based anomalous activity identification system in IoT. Initially, the flow-based features were extracted along with the statistical features like mean, median, variance, correlation, and correntropy. Subsequently, Bi-level classification was carried out in this work. In level 1, the presence of attack was detected and the level 2 classification classifies the type of attack. Moreover, the decision tree was used for detecting the attacks by checking whether the network traffic was anomalous traffic or normal traffic. In level 2, Optimized Neural network (NN) was used for categorizing the attacks in IoT with the knowledge of flow features and statistical features. To make the detection and classification more accurate, the weight of NN was optimally tuned by a new Combined Whale SeaLion Algorithm (CWSA) that hybridized the concepts of both SLnO and WOA. Moreover, the performance of the adopted method was computed over other traditional methods with respect to certain measures. On observing the graph, the accuracy of the proposed NNCWSA method obtains the maximum values (0.9) at learning rate 90 and the traditional models obtain the minimum values for SVM (0.15) and KNN (0.78). Furthermore, the F1-score of adopted NNCWSA scheme shows an improvement of 93.90% and 21.95% over the existing models like SVM and KNN for learning rate 90. Finally, the error analysis of the proposed NNCWSA method attains best validation performance of 0.60284 (i.e.) lowest values at epoch 133. Thus, the improvement of the proposed CWSA method has been validated effectively.
References
[1] P. Sudhakaran and C. Malathy, “Authorisation, attack detection and avoidance framework for IoT devices,” IET Networks, vol. 9, no. 5, pp. 209–214, 9 2020, doi: 10.1049/iet-net.2019.0167.
[2] M. Hossain and J. Xie, “Third Eye: Context-Aware Detection for Hidden Terminal Emulation Attacks in Cognitive Radio-Enabled IoT Networks,” IEEE Transactions on Cognitive Communications and Networking, vol. 6, no. 1, pp. 214–228, March 2020, doi: 10.1109/TCCN.2020.2968324.
[3] Shailendra Rathore, Jong Hyuk Park, “Semi-supervised learning based distributed attack detection framework for IoT”, Applied Soft Computing, vol. 72, pp. 79–89, Nov 2018.
[4] Liang Liu, Zuchao Ma, Weizhi Meng, “Detection of multiple-mix-attack malicious nodes using perceptron-based trust in IoT networks”, Future Generation Computer Systems, vol. 101, pp. 865–879, Dec 2019.
[5] S. Manimurugan, S. Al-Mutairi, M. M. Aborokbah, N. Chilamkurti, S. Ganesan and R. Patan, “Effective Attack Detection in Internet of Medical Things Smart Environment Using a Deep Belief Neural Network,” IEEE Access, vol. 8, pp. 77396–77404, 2020, doi: 10.1109/ACCESS.2020.2986013.
[6] A. Raoof, A. Matrawy and C. Lung, “Routing Attacks and Mitigation Methods for RPL-Based Internet of Things,” IEEE Communications Surveys & Tutorials, vol. 21, no. 2, pp. 1582–1606, Secondquarter 2019, doi: 10.1109/COMST.2018.2885894.
[7] F. Farivar, M. S. Haghighi, A. Jolfaei and M. Alazab, “Artificial Intelligence for Detection, Estimation, and Compensation of Malicious Attacks in Nonlinear Cyber-Physical Systems and Industrial IoT,” IEEE Transactions on Industrial Informatics, vol. 16, no. 4, pp. 2716–2725, April 2020, doi: 10.1109/TII.2019.2956474.
[8] S. Latif, Z. Zou, Z. Idrees and J. Ahmad, “A Novel Attack Detection Scheme for the Industrial Internet of Things Using a Lightweight Random Neural Network,” IEEE Access, vol. 8, pp. 89337–89350, 2020, doi: 10.1109/ACCESS.2020.2994079.
[9] Abebe Abeshu Diro, Naveen Chilamkurti, “Distributed attack detection scheme using deep learning approach for Internet of Things”, Future Generation Computer Systems, vol. 82, pp. 761–768, may 2018.
[10] N. Ravi and S. M. Shalinie, “Learning-Driven Detection and Mitigation of DDoS Attack in IoT via SDN-Cloud Architecture,” IEEE Internet of Things Journal, vol. 7, no. 4, pp. 3559–3570, April 2020, doi: 10.1109/JIOT.2020.2973176.
[11] A. Y. Khan, R. Latif, S. Latif, S. Tahir, G. Batool and T. Saba, “Malicious Insider Attack Detection in IoTs Using Data Analytics,” IEEE Access, vol. 8, pp. 11743–11753, 2020, doi: 10.1109/ACCESS.2019.2959047.
[12] A. Samy, H. Yu and H. Zhang, “Fog-Based Attack Detection Framework for Internet of Things Using Deep Learning,” IEEE Access, vol. 8, pp. 74571–74585, 2020, doi: 10.1109/ACCESS.2020.2988854. Zuchao Ma, Liang Liu, Weizhi Meng, “Towards multiple-mix-attack detection via consensus-based trust management in IoT networks”, Computers & Security, vol. 96, Art.no. 101898, Sep 2020.
[13] Zubair A. Baig, Surasak Sanguanpong, Chakchai So-In, “Averaged dependence estimators for DoS attack detection in IoT networks”, Future Generation Computer Systems, vol. 102, pp. 198–209, Jan 2020.
[14] Zuchao Ma, Liang Liu, Weizhi Meng, “Towards multiple-mix-attack detection via consensus-based trust management in IoT networks”, Computers & Security, vol. 96, Art.no. 101898, Sep 2020
[15] H. Al-Hamadi, I.-R. Chen, D.-C. Wang and M. Almashan, “Attack and Defense Strategies for Intrusion Detection in Autonomous Distributed IoT Systems,” IEEE Access, vol. 8, pp. 168994–169009, 2020, doi: 10.1109/ACCESS.2020.3023616.
[16] V. Sharma, I. You, K. Yim, I. Chen and J. Cho, “BRIoT: Behavior Rule Specification-Based Misbehavior Detection for IoT-Embedded Cyber-Physical Systems,” IEEE Access, vol. 7, pp. 118556–118580, 2019, doi: 10.1109/ACCESS.2019.2917135.
[17] I. Hafeez, M. Antikainen, A. Y. Ding and S. Tarkoma, “IoT-KEEPER: Detecting Malicious IoT Network Activity Using Online Traffic Analysis at the Edge,” IEEE Transactions on Network and Service Management, vol. 17, no. 1, pp. 45–59, March 2020, doi: 10.1109/TNSM.2020.2966951.
[18] D. Yin, L. Zhang and K. Yang, “A DDoS Attack Detection and Mitigation With Software-Defined Internet of Things Framework,” IEEE Access, vol. 6, pp. 24694–24705, 2018, doi: 10.1109/ACCESS.2018.2831284.
[19] H. H. Pajouh, R. Javidan, R. Khayami, A. Dehghantanha and K. R. Choo, “A Two-Layer Dimension Reduction and Two-Tier Classification Model for Anomaly-Based Intrusion Detection in IoT Backbone Networks,” IEEE Transactions on Emerging Topics in Computing, vol. 7, no. 2, pp. 314–323, 1 April–June 2019, doi: 10.1109/TETC.2016.2633228.
[20] Q. Shafi, A. Basit, S. Qaisar, A. Koay and I. Welch, “Fog-Assisted SDN Controlled Framework for Enduring Anomaly Detection in an IoT Network,” IEEE Access, vol. 6, pp. 73713–73723, 2018.
[21] Yisroel Mirsky, Tomer Golomb, Yuval Elovici, “Lightweight collaborative anomaly detection for the IoT using blockchain” Journal of Parallel and Distributed Computing, vol. 145, pp. 75–97, Nov 2020.
[22] Kashif Naseer Qureshi, Shahid Saeed Rana, Awais Ahmed, Gwanggil Jeon, “A Novel and Secure Attacks Detection Framework for Smart Cities Industrial Internet of Things” Sustainable Cities and Society In press, journal pre-proof Available online, Art.no. 102343, 20 June 2020.
[23] Syed Rizvi, RJ Orr, Austin Cox, Prithvee Ashokkumar, Mohammad R. Rizvi, “Identifying the attack surface for IoT network”, Internet of Things, vol. 9, Art.no. 100162, March 2020.
[24] Y. Liu, M. Ma, X. Liu, N. N. Xiong, A. Liu and Y. Zhu, “Design and Analysis of Probing Route to Defense Sink-Hole Attacks for Internet of Things Security,” IEEE Transactions on Network Science and Engineering, vol. 7, no. 1, pp. 356–372, 1 Jan.–March 2020, doi: 10.1109/TNSE.2018.2881152.
[25] A. Tandon, T. J. Lim and U. Tefek, “Sentinel based malicious relay detection in wireless IoT networks,” Journal of Communications and Networks, vol. 21, no. 5, pp. 458–468, Oct. 2019, doi: 10.1109/JCN.2019.000049.
[26] Seyedali Mirjalili and Andrew Lewis, “The Whale Optimization Algorithm”, Advances in Engineering Software, vol. 95, pp. 51–67, 2016.
[27] Masadeh, Raja, Mahafzah, Basel and Sharieh, Ahmad. “Sea Lion Optimization Algorithm”, International Journal of Advanced Computer Science and Applications, vol. 10, pp. 388–395, 2019.
[28] M. Marsaline Beno, Valarmathi I. R, Swamy S. M and B. R. Rajakumar, “Threshold prediction for segmenting tumour from brain MRI scans”, International Journal of Imaging Systems and Technology, Vol. 24, No. 2, pp. 129–137, 2014.
[29] Mahmudul Hasan, Md. Milon Islam, Md. Ishrak Islam Zarif, M. M. A. Hashem, “Attack and anomaly detection in IoT sensors in IoT sites using machine learning approaches”, Internet of Things, vol. 7, Art.no. 100059, Sep 2019.
[30] K. Krishna Jyothi, Shilpa Chaudhari, “Optimized neural network model for attack detection in LTE network”, Computers & Electrical Engineering, vol. 88, Art.no. 106879, Dec 2020.
[31] Ming-Yang Su, “Real-time anomaly detection systems for Denial-of-Service attacks by weighted k-nearest-neighbor classifiers”, Expert Systems with Applications, vol. 38, no. 4, pp. 3492–3498, April 2011.
[32] Reda M. Elbasiony, Elsayed A. Sallam, Mahmoud M. Fahmy, “A hybrid network intrusion detection framework based on random forests and weighted k-means” Ain Shams Engineering Journal, vol. 4, no. 4, pp. 753–762, Dec 2013.
[33] Wang Chao, Wang Junzheng, “Cloud-service decision tree classification for education platform”, Cognitive Systems Research, vol. 52, pp. 234–239, Dec 2018.
[34] Kangyi Wang, “Network data management model based on Naïve Bayes classifier and deep neural networks in heterogeneous wireless networks”, Computers & Electrical Engineering, vol. 75, pp. 135–145, May 2019.
[35] V. Tejaswini and Dr. D. Susitra, “Hybrid PSO-WOA for Solving ORPD Problem under Unbalanced Conditions”, Journal of Computational Mechanics, Power System and Control, Vol. 2, No. 2, pp. 10–20, 2019.
[36] Vinolin V and S Vinusha, “Enhancement in Biodiesel Blend with the Aid of Neural Network and SAPSO”, Journal of Computational Mechanics, Power System and Control, Vol. 1, No. 1, pp. 11–17, 2018.
[37] Inumula Veeraraghava Rao, Malleswara Rao V, “An Enhanced Whale Optimization Algorithm for Massive MIMO System”, Journal of Networking and Communication Systems, Vol. 2, No. 4, pp. 12–22, 2019.
[38] R. Cristin, Dr. V. Cyril Raj and Ramalatha Marimuthu, “Face Image Forgery Detection by Weight Optimized Neural Network Model”, Multimedia Research, Vol. 2, No. 2, pp. 19–27, 2019.
[39] Nipanikar S I, Hima Deepthi V, “Enhanced Whale Optimization Algorithm and Wavelet Transform for Image Steganography”, Multimedia Research, Vol. 2, No. 3, pp. 23–32, 2019.
[40] Chithra R S, Jagatheeswari P, “Enhanced WOA and Modular Neural Network for Severity Analysis of Tuberculosis”, Multimedia Research, Vol. 2, No. 3, pp. 43–55, 2019.
[41] https://en.wikipedia.org/wiki/Statistic.
[42] Dr. Seetaiah Kilaru, Hari Kishore K, Sravani T, Anvesh Chowdary L, Balaji T “Review and Analysis of Promising Technologies with Respect to fifth Generation Networks”, 2014 First International Conference on Networks & Soft Computing, ISSN: 978-1-4799-3486-7/14, pp. 270–273, August 2014.
[43] A Murali, K Hari Kishore, C P Rama Krishna, S Kumar, A Trinadha Rao “Integrating the Reconfigurable Devices using Slow-changing Key Technique to achieve High Performance”, Proceedings 7th IEEE International Advance Computing Conference, IACC 2017, 7976849 ISSN: 2473-3571, pp. 530–534, July 2017.
[44] Avinash Yadlapati, Kakarla Hari Kishore, “Constrained Level Validation of Serial Peripheral Interface Protocol”, Proceedings of the First International Conference on SCI 2016, Volume 1, Smart Innovation, Systems and Technologies 77 (Publisher: Springer Nature Singapore Pvt. Ltd), ISSN No: 2190–3018, ISBN: 978-981-10-5544-7, Chapter No: 77, pp. 743–753, 25th December 2017.
Biographies

Meenigi Ramesh Babu is a Research scholar in school of Electronics and communication Engineering, Reva University, Bangalore, Karnataka, India. He has received M.Tech Digital Systems and Computer Electronics from Jawaharlal Nehru Technological University (JNTU), Anantapur, Alpha has received B.Tech Degree from KSRM College of engineering, Kadapa, which is affiliated to Sri Venkateshwara University, Tirupati. He presented papers in international and national conferences. His area of interest is Internet of Things attacks detection model using Deep learning.

K. N. Veena is currently working as Associate Professor in the school of Electronics and Communication Engineering, REVA University. She has won national level teachers’ competition in Robotics conducted by IIT Bombay in 2013. She has 2 patents published and 6 patents filed in the field of Robotics. She has published paper in National and International conference and journals. She is currently guiding 4 PhD students, Her research area are Sensor networks, Computational Intelligence and Robotics.
Journal of Mobile Multimedia, Vol. 18_1, 61–88.
doi: 10.13052/jmm1550-4646.1814
© 2021 River Publishers