Predicting Vasovagal Syncope for Paraplegia Patients Using Average Weighted Ensemble Technique
V. Vinodhini1, Akula Vishalakshi2, G. Naga Chandrika3, S. Sankar1 and Somula Ramasubbareddy3,*
1Department of Computer Science and Engineering, Sona College of Technology, Salem 636005, India
2Department of CSE, Sreedattha Institute of Engineering and Sciences, Hyderabad 500361, India
3Department of Information Technology, VNRVJIET, Hyderabad 500090, India
E-mail: vinodhinigiri@gmail.com; visali1203@gmail.com; gnchandrika@gmail.com; sankarcsharp@gmail.com; svramasubbareddy1219@gmail.com
*Corresponding Author
Received 01 June 2021; Accepted 16 July 2021; Publication 26 August 2021
Abstract
Vasovagal syncope (VVS) refers to fainting of people with a drop in blood flow to the brain more serious disease in paraplegia patients. Precognitive diagnoses are characterized by lightheadedness, nausea, severe fatigue, and an elevated heart rate. As a result, it’s important to seek care as soon as possible after experiencing syncope. Since receiving a correct diagnosis and appropriate care, the majority of patients may avoid complications with syncope. Syncope appears to be a sign of COVID 19 in people with coronary artery disease. Furthermore, a sudden heart attack might result in acute syncope. In a few circumstances, machine learning classification techniques may not be precise. For paraplegia patients, prediction vasovagal syncope needs more precise results in order to save their lives. The aim of this paper is to use the ensemble technique to improve the accuracy of conventional machine learning algorithms. EEG (ElectroEncephaloGram) brainwave dataset from kaggle is used to implement it. The accuracy of the proposed AWET algorithm is 82%. It improves the accuracy by 17% compare to Support Vector Machine, Random Forest, Naive Bayes, and MultiLayer Perceptron classifiers.
Keywords: Vasovagal syncope, ensemble technique, paraplegia patients, arousal, dominance, brainwave.
1 Introduction
In India, 2.68 million people are categorized as “disabled,” accounting for 2.21% of the overall population. In 1.46 people use wheel chair for survival [1]. Mostly People were affected by the Paralyze attack compared to other diseases so it plays a major effective role for people in Usage of wheelchairs. Paralyze attacked people majorly use wheelchair for their survival. Mostly people who are been attacked by Paralyze are drove into usage of Wheel Chair System [2]. Paraplegia is a condition in which both legs and, in some cases; portions of the lower abdomen are completely or partially paralyzed [3]. As these people sits for too long in wheel chair, they might not be noticed in case of emergency. Synocope refers to fainting of people with a drop in blood flow to the brain due to prolong sitting. It is a very common occurrence. At any point in their lives, it affects lesser of men and more of women [4].
Vasovagal Syncope (VVS) becomes more popular as you grow older, affecting up to 6% of population over the age of 75 [5]. The disease can strike someone during any age, and it can strike someone with or without other medical issues. Paraplegia Patients often sense the onset of a syncopal episode. Lightheadedness, nauseous, and extreme fatigue, raised heart rate are the signs of precognitive diagnoses [6]. It can be avoided if the person sits or lie down. In case of paraplegia patients it is difficult to identify and Syncope is a symptom of a more severe illness. As a result, it’s important to seek care as soon as possible after experiencing syncope. Since receiving a correct diagnosis and appropriate care, the majority of patients may avoid complications with syncope [7]. Independent wheel chair use, redesigning furniture for comfortable access, repositioning patients to prevent bed sores, routine catheter tracking, and the need for an assistant for everyday chores are some of the challenges that these patients experience [8].
Humans have a reflex response that causes them to feel and behave in some ways. Fear or shock may cause an increase in Blood Pressure (BP) and Heart Rate (HR). It’s worth noting that if the fear lasts long enough, HR and BP will raise, which a sign of syncope [9] is. Many researchers state unequivocally that changes in HR and BP alone cannot rule out syncope symptoms [10]. Fear/danger are the most common emotion in animals, which causes them to stay motionless in order to avoid predators, increasing their HR. This is an active response, followed by a freeze response [11]. The VVS develop in animals in life-threatening situations, as per electroencephalographic recordings [12]. Birds, reptiles, carnivores, and amphibians were included in the study. The animals’ responses were observed, and it was revealed that each of them had different ways of expressing fear, such as urinating, motionless, defecating, and salivation, indicating that there is an emotional VVS [13].
According to one of the hypotheses, VVS is the cause of hypotension and bradycardia, which may lead to loss of consciousness [14]. A minority of patients participated in a study using the fick method. The cardiac index and pressure were calculated, and the electrocardiogram was continuously monitored, yielding significant results [15]. Eight out of eight individuals had a lower heart rate, seven out of seven had a lower arterial blood pressure, and eleven out of eleven had a lower cardiac index. Five of the six patients had lower pulmonary arterial mean pressure, while one had no change. The patients’ heart rates, cardiac index, and mean arterial pressure all increased. Total systemic resistance and stroke index changed in different ways [16].
Coronavirus infection 2019 (COVID-19) is characterized by a rheumatic fever accompanied by symptoms of the respiratory system [17]. Atypical manifestations, such as syncope, are possible. Syncope causes an estimated twelve lakhs admissions to disaster sector and four lakhs and forty thousand hospitalizations in the United States annually, costing $2.4 billion [18]. However, there is a wide range of techniques to evaluating syncope among physicians, and the reason of syncope has yet in more than half of the instances. The introduction of SARS-COV-2 could make evaluating syncope much more difficult [19]. Due to a unique appearance, a missing or delayed diagnostic of COVID-19 could result in avoidable exposures and rapid spread [20].
As of March 31, 2020, 163 of the 1,950 patients that were tested had a positive diagnosis. After reviewing the first 102 cases, we discovered that syncope, or a sudden fall was mostly the common reason for seeking medical help [21]. High body temperature or the normal breathing illness is the symptoms discovered. When compared to those who did not report syncope, near syncope, or a sudden fall, a larger portion of VVS patients needed oxygen, had respiratory problems, or had elevated troponin levels. These differences, however, were not substantial. Furthermore, as measured by random blood glucose level, there was no discernible change in excessive fluid status [22].
The Highlights of this study using AWET is as follows
• To increase accuracy by developing a novel prediction method AWET that will aid in the early detection of syncope.
• The dataset has been pre-processed to remove all except the most critical values.
• The classifier is constructed by various algorithms.
• The final output of the classifier is weighted in order to select the best classification model.
• However machine learning classification algorithms are common in early prediction, to make successful and accurate prediction of Vasovagal Syncope in patient’s ensemble technique is proposed.
1.1 Overview of Syncope
Syncope or near syncope can be caused by a variety of underlying diseases, both cardiogenic and noncardiogenic. Similarly, syncope in COVID-19 patients is likely to be complex [23]. COVID-19 individuals who have cardiovascular illness have a higher mortality rate, and it’s unclear that VVS is a symptom of COVID-19 disease [24]. Angiotensin-converting enzyme 2 dysregulation is associated with cardiovascular illness, while SARS make use of the same to start contagion [25]. Syncope has not been identified as a presenting symptom in any studies to yet. The investigation reports of china recoded 9.4% of people reported dizziness and others with chest pain. As of inconsistency in the occurrence of tobacco and the statics of cardio illness, may not be fully curable [26].
VVS patients experienced a lower Health Related Quality of Life (HRQoL) than healthy people, according to the results of the RAND36 survey [27]. VVS patients had worse HRQoL and medical histories than healthier non fainting people, and both performance criteria are adversely associated for VVS patients, according to the research study [28]. Muscle contractions normally assist in the emptying of the filled veins toward the heart, balancing for both the enormous volume of blood in muscle and gravity’s hydrostatic effects. The laboratory evidence that a decline in blood pressure might be caused by blood pooling in hypotonic muscles seemed to reinforce our theory that the depressor reflex is caused by blood pooling in hypotonic muscles [29]. Such tragic circumstances do not lend themselves to a thorough clinical investigation. The ramifications of this notion for patient care and sudden death prevention are a research factor in the emergence [30].
Table 1 VVS versus COVID 19 common factors
| Vasovagal | Cardiogenic | COVID 19 | |
| Factors | (Approximate) | (Approximate) | (Approximate) |
| Age | 50–60 | 45–80 | 40—80 |
| Gender | 50% (M), 60% (F) | 60% (M), 40% (F) | 60% (M), 40% (F) |
| Hypertension | 60% | 70% | 60% |
| Heart Failure | 70% | 80% | 80% |
| Abnormal EEG | 80% | 80% | 80% |
| Diabetes | 60% | 80% | 80% |
| Smoking | 80% | 80% | 80% |
| Hospitalization | 40% | 40% | 98% |
| Death | 20% | 20% | 95% |
COVID-19 symptoms can range in severity from mild to severe. Table 1 denotes the approximate values that are common with COVID 19 and syncope. Fever, cold, chest tightness, nausea, gastrointestinal, nausea, difficulty breathing, stuffy nose, hypoglycemia and pains are common symptoms 2 to 14 days after virus contact. Syncope is the only early sign of COVID-19 virus in the series case of individuals [31]. Since all patients had a PPM (post permanent pacemaker) that showed no anomalies, cardiac syncope with tachyarrhythmia or brad arrhythmia as the major cause was ruled out in the case series. Syncope caused by structural heart disease or blood clot has also been ruled out [32]. The postulated pathophysiological theory could be a non classical cognitively influenced mechanism (lack of a specific trigger) or a major or minor autonomic malfunction. The association between COVID-19 infection and “abnormal” sinus tachycardia, which typically characterizes individuals with atypical corona virus infection even in the absence of renal distress, could be another reinforcing element for this type physiological imbalance [33]. Syncope is the only early indication of COVID-19 infection in these patients. Regardless of the specific mechanism, knowing this potential is critical for taking necessary isolation barriers and perhaps taking medications while the infection is still in its early stages [34].
The paper organization is as follow Section 2: Shows the related works. Section 3: The proposed method is explained. Section 4: Exploratory data analysis is shown. Section 5: Comparative study of various methods is tabulated. Section 6: The paper is concluded and the future work is given.
2 Related Works
Subasi et al. [35] proposed an approach for identifying emotions that is both lightweight and automated. As a feature extraction method, the Tunable Q Wavelet Transform (TQWT) is used. Support Vector Machine (SVM), K-Nearest Neighbor (KNN), Artificial Neural Network (ANN), Random Forest (RF), and Decision Tree (DT) were among the classifiers applied. For implementation, the SEED dataset is used. Noise is reduced at first. To enhance the scaling factor, the proposed Tunable Q-factors in wavelet are rebuilt. As this tuning may be done by manipulating its three parameters, Q, r, and j, it is easily changeable as a function of the intended use. The proposed method is indented to enhance accuracy. The accuracy of SVM is increased to the maximum by using a Receiver Operating Characteristic (ROC) curve for evaluation. However, this research is limited to some emotions, whereas additional signals and emotions are still under investigation.
Abdulla et al. [36] developed a method for early detection of insomnia based on the classification of sleep into cycles. The modularity of a graph is employed as an input feature for an ensemble classifier. The data are merged into a correlation graph using a variety of classifiers. The graph is classified using the ensemble methodology, which is then compared to current sleep stages. PysioNet was chosen as the dataset. Six classifiers are used to build the ensemble model. The correlation coefficient was used to assess the performance. The results were more accurate, with a 93 percent accuracy rate. Individual sleep patterns, however, vary, particularly when sedatives are used. ElectroEncephaloGram (EEG) monitoring under anesthesia is still a challenge.
Ren et al. [37] a novel extreme ensemble learning method was proposed. To reduce redundant and redundant features, feature selection based on class separability is utilized to find the best feature subset. There were two datasets used in this study. As a feature extraction method, an autoregressive model with wavelet transform is applied. The original training dataset is processed using a bootstrap approach. The results of the first dataset are classified using an extreme learning machine; the second dataset is classified using the same procedure using maximum voting the results are derived. As a result, the strategy yields successful results. This method, however, is not appropriate for every application.
Avot et al. [38] proposed a methodology to identify depression using EEG and ensemble technique. To improve accuracy, a variety of linear and nonlinear classifiers are applied. Cross validation is used to improve the algorithm’s efficiency. For a total of ten iterations, ten folds of validation were used. Individuals were divided into two groups: healthy people and depressed people. The algorithm increased precision by 90%. The dataset, on the other hand, collected data through EEG and questioners. However Participants’ mental states changes with time, and there is research on the subject.
Chen et al. [39] proposed an approach for increasing the rate of emotion recognition accuracy. As a result of the EEG preprocessing, the Eigen vector is produced. Feature selection reduces the dimension. Adaboost uses the ensemble methodology to train classifiers on the DEAP dataset, raising accuracy to 88.70%. However, the parameters must be fine-tuned for best results, and the participant’s mental state must be determined using EEG.
Shen et al. [40] proposed a novel ensemble and multi-scale frequency band using two datasets, DEAP and SEED developed to increase accuracy. The researchers employed a fivefold cross validation method. The findings of the classifiers were combined using the weighted learning method, resulting in improved emotion recognition ability. However, not all cases yielded optimal results.
The following are the research gaps identified
• The research on automatic emotion recognition is limited to only a few emotions.
• The outcomes of the sleep pattern are unsuitable and may vary depending on the medication and sedatives used.
• It’s still difficult to diagnose depression, as well as the participant’s mental condition is indeed not steady.
• It’s tough to anticipate patient emotions accurately because they change throughout time.
3 The Proposed AWET
Since the amount of data to be managed in health care is so high, a data mining technique is needed to obtain the necessary data to process for prediction. Vasovagal Syncope is one of these diseases (VVS). It is a form of reflex syncope that can be classified as classical or non-classical. The classical syncope causes discomfort while standing for long periods of time, while the non-classical syncope causes only minor discomforts. The elderly are disproportionately affected. Many hypotheses about syncope were investigated in order to learn more about its origin [41]. Some researchers discovered that it affected some vertebrates as a result of a sudden shock, which triggered the VVS reflex [42]. VVS is present in a higher percentage of healthy people. In space, even the most physically fit astronauts experience pre syncope symptoms. VVS is described as a disease in which different types of treatment are available for various symptoms.
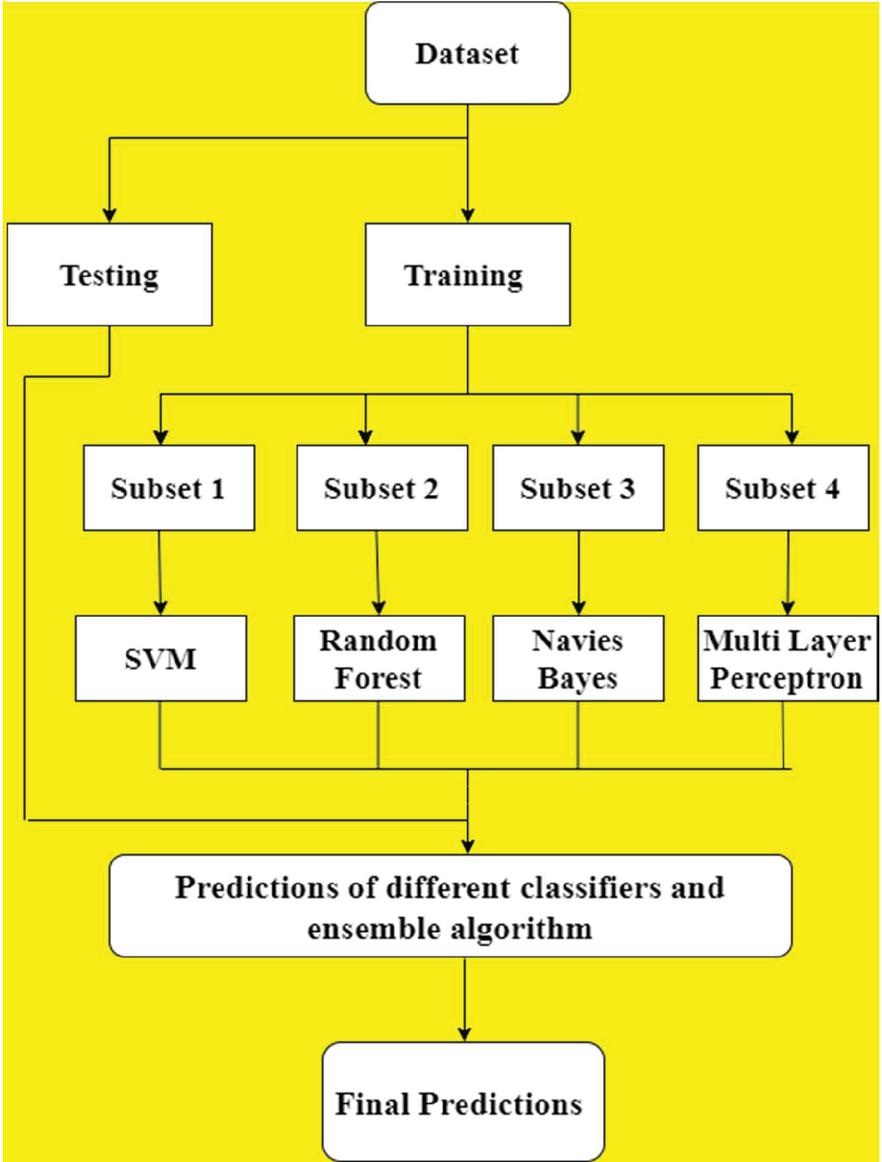
Figure 1 Process of proposed method AWET.
The Figure 1 shows the process of the proposed method Average Weighted Ensemble Technique (AWET). The following Sections 3.1 and 3.2 details the entire process.
Table 2 Dataset summary
| Dataset summary | |
| Total No of videos | 120 |
| No of video selected | 40 |
| Duration of video highlights | 1 minute |
| No of participants involved | 32 |
| Rating scale | Arousal, valance, liking, dominance, familiarity |
| Rating value | 1 to 9 |
Table 3 EEG rhythms
| Category | Rhythms in Hz | Description |
| Delta | 0.5 to 4 | Deep sleep state or infant irregular activity |
| Theta | 4 to 7 | Early sleep state or drowsiness |
| Alpha | 8 to 12 | Relaxed state or eye closed state |
| Beta | 13 to 30 | Worrying situation |
| Gamma | 30 | Advanced function of intelligence |
3.1 Dataset Summary
The EEG brainwave dataset from kaggle is used to implement the ensemble technique. Training data is split into subset and trained by several classifiers; the best results under each classifier are identified. Thus applying the average weighted ensemble technique the accuracy is improved. Emotion recognition is a crucial area of study in the science of Cognitive Interactions. Automatic emotion recognition systems are becoming more feasible as technology and knowledge of emotions improve. EEG analyses brain signals to detect various emotions. It is a way of identifying health problems [43]. Electrical potentials vary as a result of thousands of neurons communicating in the brain. The Table 2 indicates the dataset for EEG brainwave contains 120 musical videos with 1 minute affective highlights. Arousal, valence, dominance, liking, and familiarity comprise the ranking scale [44]. The rating scale is discrete, with values ranging from 1 to 9. The study includes thirty-two people and forty videos.
ElectroEncephaloGram is categorized into five rhythms as shown in Table 3 where delta (0.5–4) indicates a person in deep sleep, if it’s an infant then their irregular activity is recorded in delta rhythm. Theta (4–7) indicates the early sleep mode or it may be a state of drowsiness. The alpha (8–12) indicates a relaxed state with eye closed. All the above 3 rhythms state refers to a normal healthy person [42]. Beta (13–30) indicates stressful state where the person syncope is activated. Gamma (30) it is usually referred to higher order function of the brain.
The EEG rhythms respond to three stimuli which include both internal emotions and external interruptions. Table 4 shows the evoked potential of three stimuli and the evoked potential (EP). It may vary to different person of gender, age etc. Evoked potential is recorded pattern of the response of different stimuli [45]. The visual stimuli can be light or any visual effects. The bright (cool colors) colorful lighting may induce a soothing response of the person and dark (hot colors) lights may induce anger, stress or fear.
The auditory stimuli may be crying which can cause stress emotions; a loud applause may induce happiness. Somatosensory is a complex part of the nervous system. It is a feel connected to the sensory nervous system. It can be a pain, warmth or a pressure on the body [46]. VEP is a positive waveform peak of 100 ms means latency. The normal values of VEP are P100, N70 and N155 were significantly found. The following are the normal values of SEP P15, P45, P25, N35 and N55, N30. The P200, P250, P300 are the normal AEP values [47].
Table 4 EEG evoked potential
| Positive Waveform | ||
| Stimulus | Evoked Potential (EP) | Peak (Approximate) |
| Visual | Visual evoked potential (VEP) | P100 |
| Auditory | Auditory evoked potential (AEP) | P300 |
| Somatosensory | Somatosensory evoked potential (SEP) | P15 |
3.2 Classification and Ensemble Technique
Classification is a method for labeling records into a set of classes. The key of classification dilemma is to find which category the latest records will fit in to. The dataset is categorized into training and test Figure 8, which shows the process of early prediction syncope in paraplegia patients where the patient sits for prolong period of time. The dataset has alienated into two one to train and another to test with new records [48]. Training data is further split into several subsets, the machine learning algorithm such as the Support Vector Machine, Navies Bayes, Random Forest and Multi Layer Perception are used for classification.
The test data and the classified data are in turn processed with ensemble technique. In Suport vector machine (SVM) the data to be trained is correspond to as peak divided into categories by a plain space in support vector machine [49]. The Naive Bayes technique is fast and supposed to be a pair of independent feature. Several such classification and filtering process are benefitted from Naive Bayes (NB) classifiers. Necessary parameters can be extracted with this algorithm with limited of training data [50].
A decision tree can identify data from several attributes by satisfying the rules. The Random Forest (RF) consists of sub trees derived from decision trees [51]. The subset is same of the new key set, but the key set are drawn with substitution. The MLP is a feed forward system the data streams from the input (forward) to the output layer [52]. The neurons can back propagates and solve linear separable problems.
The following are the primary reasons why ensemble algorithms, among other techniques, are used.
• The results of machine learning performance are improved by using the ensemble algorithm on diverse models.
• It lowers model performance dispersion.
• Ensemble is reliable for reducing overfitting and optimizing performance.
Ensemble is an algorithm with the intention it combines the result of several classification algorithms to generate the best predictions. Bagging and boosting methods are used to train the classifier. Individual classifiers are combined to form an ensemble framework in the first step. Since the classifiers performance is a discrete value, a weighted majority vote is used. The class labels of emotions ( are combined by converting the score above 5 as 1 in Equation (1) and score below 5 as 0 in Equation (2).
| (1) | ||
| (2) |
Majority weighted voting is performed if all the classifier produces same results then the vote will be unanimous, if half classifier agrees then 50% of positive response is taken otherwise majority of the votes are considered. The sum of Maximum Emotional scale (Es) with all the classifiers from cs 1 to C (C 4) is computed in Equation (3). The weighted average voting is given in Equation (4).
| (3) |
Where ES is the emotional scale , cs to C are the classifier
| (4) |
Where Wi is the weight, cs to C are the classifiers
The ensemble algorithm employs bagging and boosting techniques as the dataset are split into several subsets it suits. Boosting is a method of grouping the data. The original dataset is partitioned into subsets in boosting [54]. The working principles of bagging using the weight function on the training model are given in Algorithm 1. This works on the subset by providing maximum value of the random subset that enhances the performance of the prediction.
Algorithm 1 Algorithm for bagging
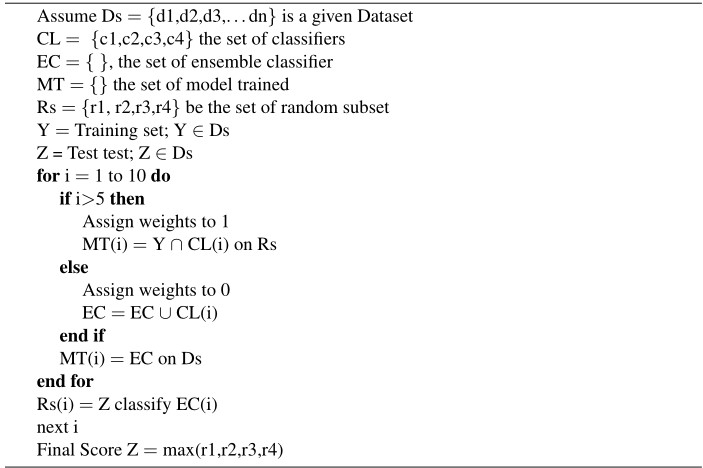
From the Algorithm 1, where Ds is a dataset, CL is a set of classifiers; EC is a set of ensemble classifiers which are trained Y and tested Z on random subset Rs. The parameter I defines the score 1 to 10. The score above 5 is weighted as 1 else 0. The subset is used to train the classifier, which results in a sequence of models with modest performance [55]. The items that the previous model could not correctly classify are used to construct new subsets. In ensemble, the bagging obtains much weak structure and cumulates the forecast to find the finest one. The feeble algorithm focus on precise region of the characteristic, allowing bagging utilizes forecast better accuracy [56].
Figure 2 shows that using the ensemble technique increased the accuracy by minimum 17%. This can lead to early syncope forecasts for paraplegia patients, allowing life to be saved in a fraction of a second. The caretakers of the patient might be notified to seek emergency medical care. Syncope is a prevalent ailment that can strike anyone at any time in their lives. Syncope has recently been discovered as a precognitive sign in COVID 19 patients, indicating that by making early predictions, the risk of a medical emergency can be decreased.
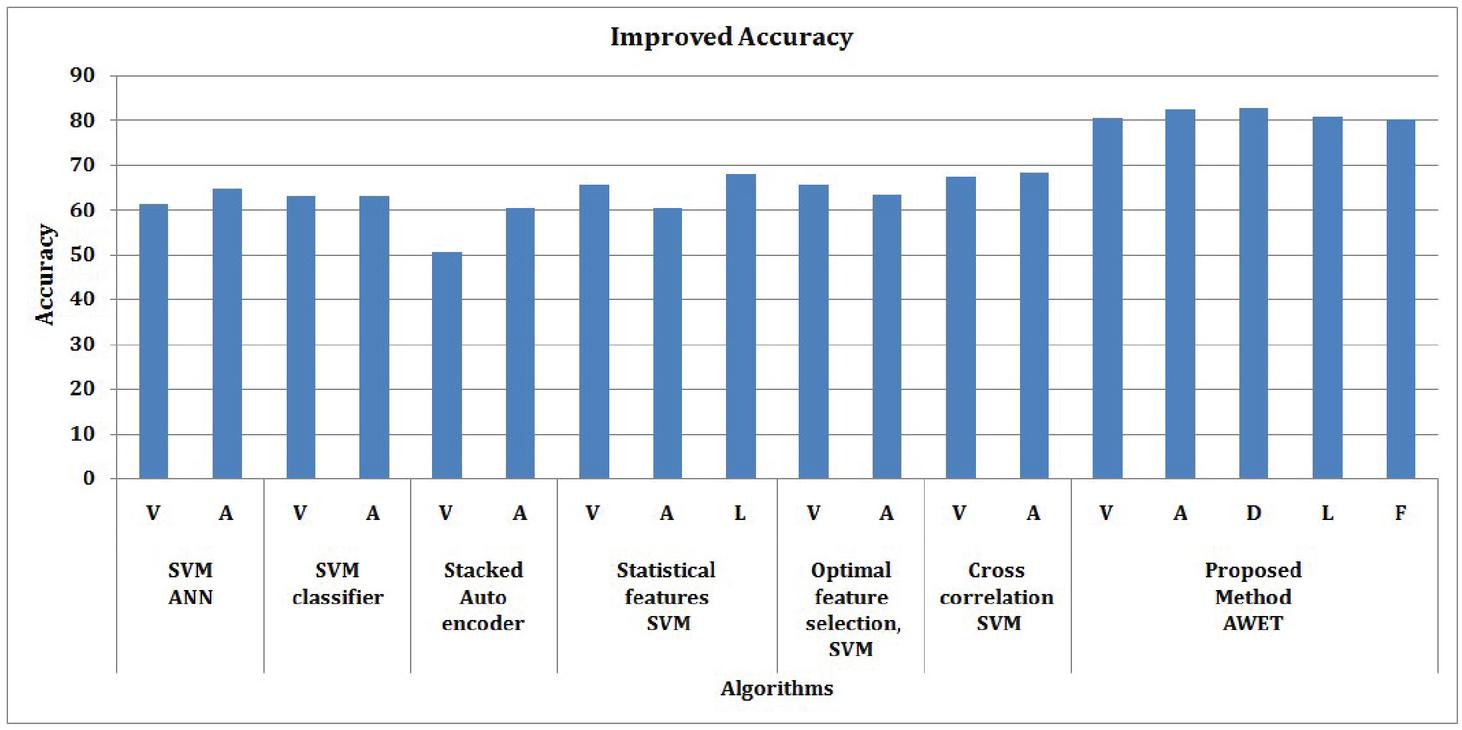
Figure 2 Improved accuracy by ensemble technique.
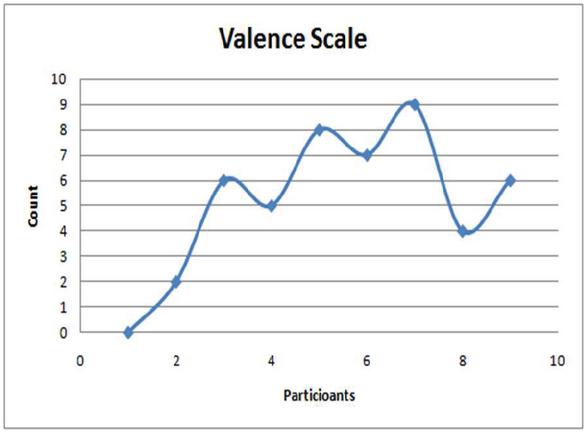
Figure 3 Valence scale rating.

Figure 4 Arousal scale rating.
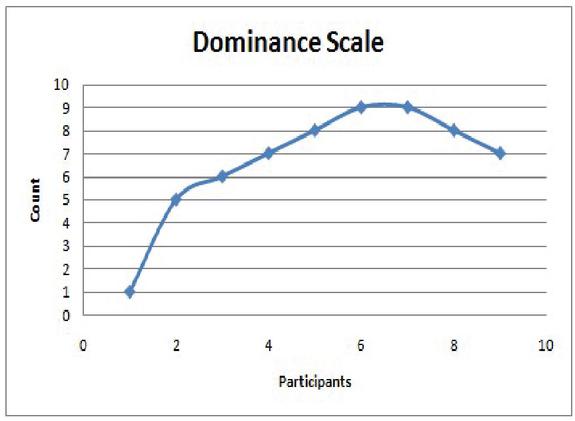
Figure 5 Dominance scale rating.

Figure 6 Liking scale rating.
4 Exploratory Data Analysis
Exploratory Data Analysis (EDA) is primarily used to examine what data can provide outside of formal modeling or research design tasks, and to gain a better knowledge of data set variables and their correlations [57]. It might also assist in determining whether the statistical methods contemplating for data analysis are suitable. It is a perception of knowledge that can be used to elicit questions to test understandings. Similarly, it might exert influence over knowledge sources in order to compel the solutions desired. The main concept is to do an analysis that will aid in determining which techniques should be utilized to process, modify, standardize, and extract information from data in order to improve predictive model implementation [58]. The EEG dataset comprises five separate ratings as shown in the Figures 2, 3, 4, 5 and 6 which represents the valence, arousal, liking, dominance and familiarity scale rating of the video clip for 1 minute. The Figure 7 represents sum of total emotional scale rating where the dominance scale is highest among all the scales [59]. It is easy to see how the ratings are distributed in detail, which aided in the diagnosis of any inclinations toward any given rating. A smaller bias would aid in improved classification accuracy in this scenario, while a bigger bias causes machine learning models to swing to anticipate the biased class.
It is feasible to execute multiple binary classification on five separate categories of valence, arousal, dominance; liking and familiarity after extracting formatted data into various archive holding the preset records from the numpy collection have one hot encoding comprising various class [60]. On a scale of 1 to 9, the participants scored each of the 60 second video clip based on all of these characteristics. As a result, one hot encoding was also used to adjust all data below five to zero and above five to one, to create a binary classifier. The Figure 7 shows the emotional rating of video clip the class are categorized as ‘miserable,’ ‘glad,’ ‘polite,’ ‘triggered,’ ‘loyal,’ ‘compelled,’ ‘high five,’ ‘sad face,’ ‘fear’, and ‘trust’ conveying both positive and negative emotion. As a result, the data has been preprocessed. When the file is loaded, two arrays called tag and facts are created. The tag was automatically pre coded into five archive, all denoting a different sentiment [61]. Individual participant’s data was mined with epoch of each subject was combined into a particular folder named “emotional_feature.dat.” The real facts/tag were kept in a different file. The number of features was reduced to 20 by using cross validation. It can be classified using an appropriate classification technique. Figures 3, 6 and 7 depicts the positive emotions which are weak curves compared to the negative emotions in Figures 4 and 5, where these emotions rates the strong peak curves. As a consequence, the subject can experience precognitive syncope, which can be efficiently identified by the use of an ensemble algorithm.
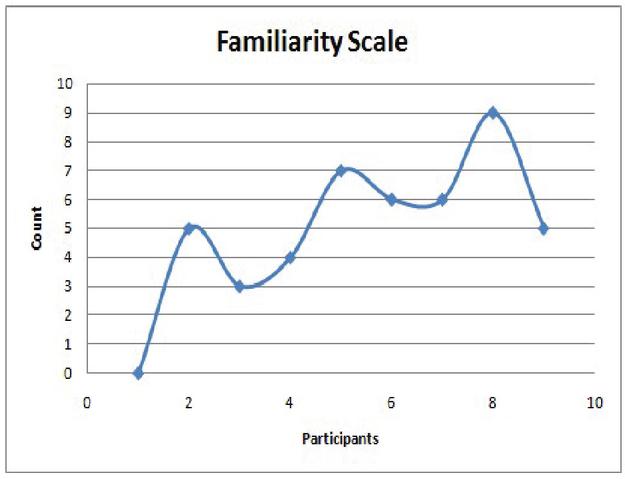
Figure 7 Familiarity scale rating.
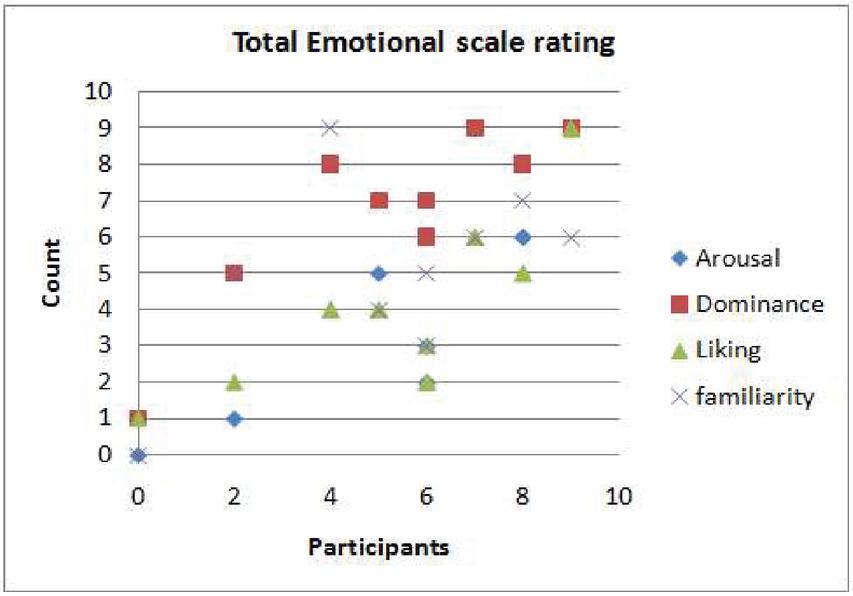
Figure 8 Total emotional scale rating.
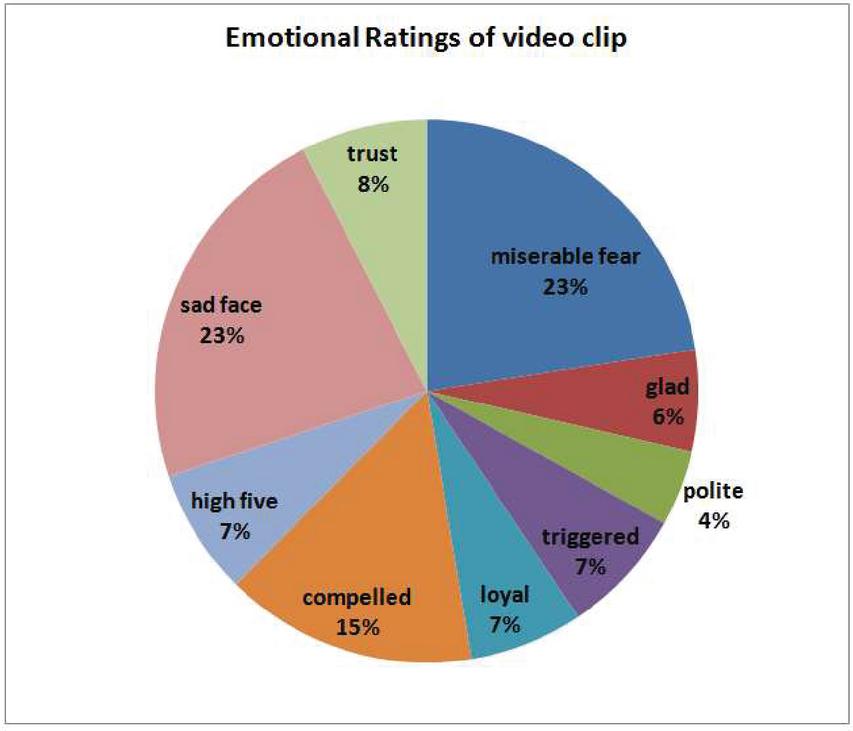
Figure 9 Emotional scale rating.
Figures 8 and 9 depicts the relationship between the five emotional scales as a pie chart. Valence, liking, and familiarity are all positive emotions. The pie chart has 8% of trust, 7% of high five, 7% of loyal, 6% of glad and 4% of polite these can count on positive emotions. The negative emotions are dominance and arousal. The pie chart has the maximum of negative emotions 23% miserable fear, 7% triggered, 15% compelled, and 23% of sad face. Syncope can be detected by a patient’s negative emotions. Meanwhile, positive emotions must be used in the early identification of signs in order to predict syncope in its early stages.
5 Comparative Study of Various Classification Methods
The classification of emotions and its accuracy is mentioned in Table 5. Many researchers concentrated on the valence and arousal emotions very few have given preference to likeness emotion. The accuracy achieved is approximately 63% by using Support Vector Machine (SVM). Optimal feature selection and Feature selection and SVM classifiers has yield the accuracy of approximately 65%. Cross correlation has given approximately 65% accuracy. The proposed model has given minimum 17% increase in accuracy by AWET technique. The accuracy of arousal and dominance is approximately 82% and the accuracy of liking and familiarity is approximately 80% accuracy.
Table 5 Comparative study of performance metric of various classifications
| Author | Algorithm | Emotional Dimension | Accuracy % |
| Kumar et al. [62] | SVM and ANN | Valence | 61.17 |
| Arousal | 64.84 | ||
| Atkinson et al. [63] | SVM classifier | Valence | 63.06 |
| Arousal | 63.14 | ||
| Stober et al. [64] | Stacked Auto encoder | Valence | 50.55 |
| Arousal | 60.53 | ||
| Alhagry et al. [65] | Statistical features , SVM | Valence | 65.65 |
| Arousal | 60.45 | ||
| Likeness | 67.99 | ||
| Raja Majid | Optimal feature | Valence | 65.58 |
| Mehmood [66] | selection, SVM | Arousal | 63.28 |
| Horlings et al. [67] | Cross-correlation , SVM | Valence | 67.26 |
| Arousal | 68.26 | ||
| Proposed | Average weighted voting | Valence | 80.44 |
| Method AWET | and SVM, RF, NB, MLP | Arousal | 82.49 |
| Dominance | 82.65 | ||
| Liking | 80.62 | ||
| Familiarity | 80.21 |
6 Conclusion and Future Work
Since syncope is associated in elevation of heart rate, it may cause serious illness as it appears to be a sign of COVID 19 in people with coronary artery disease. In a few circumstances, machine learning classification techniques may not be precise. For paraplegia patients, prediction vasovagal syncope needs more precise results in order to save their lives. The accuracy of the proposed Average Weighted Ensemble Technique (AWET) is compared with the existing classifiers. The performance of the proposed technique was increased to a minimum of a 17% increase in prediction accuracy. As a result, vasovagal syncope can be diagnosed early and paraplegia patients’ caregivers can be warned, reducing the likelihood of an emergency.
In the event of a pandemic, however, various decision-making guidelines for clinical support and evaluation patterns for patients are developed. A study on COVID 19 affected patients and syncope has been conducted by a number of researchers. In COVID 19 patients, syncope has recently been anticipated as a precognitive symptom it varies depending on the medical history of the patient. More study on the underlying difficulties in all patients, regardless of their medical background, is to be carried out.
References
[1] Ilut, C., Valchev, R., & Vincent, N. (2020). Paralyzed by fear: Rigid and discrete pricing under demand uncertainty. Econometrica, 88(5), 1899–1938.
[2] Chang, J. E., Kim, H., Lee, J. M., Min, S. W., Won, D., Jun, K., & Hwang, J. Y. (2019). A prospective, randomized comparison of the LMA-protector and i-gel in paralyzed, anesthetized patients. BMC anesthesiology, 19(1), 1–7.
[3] Dastidar, D. G., Gupta, A., Das, D., & Tripathi, B. (2019). Gitelmans Syndrome-A Rare Cause of Recurrent Syncope. The Journal of the Association of Physicians of India, 67(9), 92–93.
[4] Reed, M. J. (2019). Approach to syncope in the emergency department. Emergency Medicine Journal, 36(2), 108–116.
[5] Probst, M. A., Gibson, T., Weiss, R. E., Yagapen, A. N., Malveau, S. E., Adler, D. H., … & Sun, B. C. (2020). Risk stratification of older adults who present to the emergency department with syncope: the FAINT score. Annals of emergency medicine, 75(2), 147–158.
[6] Aksu, T., Guler, T. E., Mutluer, F. O., Bozyel, S., Golcuk, S. E., & Yalin, K. (2019). Electroanatomic-mapping-guided cardioneuroablation versus combined approach for vasovagal syncope: a cross-sectional observational study. Journal of Interventional Cardiac Electrophysiology, 54(2), 177–188.
[7] El-Hussein, M. T., & Cuncannon, A. (2021). Syncope in the emergency department: a guide for clinicians. Journal of Emergency Nursing, 47(2), 342–351.
[8] Aksu, T., Padmanabhan, D., Shenthar, J., Yalin, K., Gautam, S., Valappil, S. P., & Gopinathannair, R. (2021). The benefit of cardioneuroablation to reduce syncope recurrence in vasovagal syncope patients: a case-control study. Journal of Interventional Cardiac Electrophysiology, 1–10.
[9] Chen, T., Hanna, J., Walsh, E. E., Falsey, A. R., Laguio-Vila, M., & Lesho, E. (2020). Syncope, near syncope, or nonmechanical falls as a presenting feature of COVID-19. Annals of Emergency Medicine, 76(1), 115.
[10] Oates, C. P., Turagam, M. K., Musikantow, D., Chu, E., Shivamurthy, P., Lampert, J., … & Koruth, J. S. (2020). Syncope and presyncope in patients with COVID-19. Pacing and Clinical Electrophysiology, 43(10), 1139–1148.
[11] Dandekar, R., & Barbastathis, G. (2020). Neural Network aided quarantine control model estimation of COVID spread in Wuhan, China. arXiv preprint arXiv:2003.09403.
[12] Xu, H., Yan, C., Fu, Q., Xiao, K., Yu, Y., Han, D., & Cheng, J. (2020). Possible environmental effects on the spread of COVID-19 in China. Science of the Total Environment, 731, 139211.
[13] Doodnauth, A. V., Jallad, A., Rizk, D., Valery, E., & McFarlane, S. I. (2021). Syncope Associated with Sinus Nodal Dysfunction in a COVID-19 Patient: A Case Report and Review of the Literature. American journal of medical case reports, 9(4), 263.
[14] Tavazzi, G., Pellegrini, C., Maurelli, M., Belliato, M., Sciutti, F., Bottazzi, A., & Arbustini, E. (2020). Myocardial localization of coronavirus in COVID-19 cardiogenic shock. European journal of heart failure, 22(5), 911–915.
[15] Lauridsen, M. D., Butt, J. H., Østergaard, L., Møller, J. E., Hassager, C., Gerds, T., & Fosbøl, E. L. (2020). Incidence of acute myocardial infarction-related cardiogenic shock during corona virus disease 19 (COVID-19) pandemic. IJC Heart & Vasculature, 31, 100659.
[16] Hasan, S. W., Ibrahim, Y., Daou, M., Kannout, H., Jan, N., Lopes, A., & Yousef, A. F. (2021). Detection and quantification of SARS-CoV-2 RNA in wastewater and treated effluents: Surveillance of COVID-19 epidemic in the United Arab Emirates. Science of the Total Environment, 764, 142929.
[17] Salzberger, B., Glück, T., & Ehrenstein, B. (2020). Successful containment of COVID-19: the WHO-Report on the COVID-19 outbreak in China.
[18] Olson, D. L., & Lauhoff, G. (2019). Descriptive data mining. In Descriptive Data Mining (pp. 129–130). Springer, Singapore.
[19] Palmisano, P., Dell’Era, G., Pellegrino, P. L., Ammendola, E., Ziacchi, M., Guerra, F. & Accogli, M. (2021). Causes of syncopal recurrences in patients treated with permanent pacing for bradyarrhythmic syncope: Findings from the SYNCOPACED registry. Heart rhythm, 18(5), 770–777.
[20] Biffl, W. L., Ferkich, A., Biffl, S. E., & Dandan, T. (2020). Syncope,“mechanical falls”, and the trauma surgeon. Journal of Trauma and Acute Care Surgery, 89(3), e64–e68.
[21] Lee, J. Z., Mulpuru, S. K., & Shen, W. K. (2019). The Role of Pacing in Elderly Patients with Unexplained Syncope. Current Cardiovascular Risk Reports, 13(6), 1–8.
[22] Van Dijk, J. G., Ghariq, M., Kerkhof, F. I., Reijntjes, R., Van Houwelingen, M. J., Van Rossum, I. A., & Benditt, D. G. (2020). Novel methods for quantification of vasodepression and cardioinhibition during tilt-induced vasovagal syncope. Circulation research, 127(5), e126–e138.
[23] Aksu, T., Guler, T. E., Bozyel, S., & Yalin, K. (2020). Selective vagal innervation principles of ganglionated plexi: step-by-step cardioneuroablation in a patient with vasovagal syncope. Journal of Interventional Cardiac Electrophysiology, 1–6.
[24] Piotrowski, R., Zuk, A., Baran, J., Sikorska, A., Krynski, T., & Kulakowski, P. (2020). P1096 Cardioneuroablation changes the type of vaso-vagal response in patients with asystolic reflex syncope. EP Europace, 22(Supplement_1), euaa162–303.
[25] Sheldon, R. S., & Sandhu, R. K. (2019). The search for the genes of vasovagal syncope. Frontiers in cardiovascular medicine, 6, 175.
[26] Turagam, M. K., Gopinathannair, R., Park, P. H., Tummala, R. V., Vasamreddy, C., Shah, A., … & Lakkireddy, D. R. (2020). Safety and efficacy of leadless pacemaker for cardioinhibitory vasovagal syncope. Heart rhythm, 17(9), 1575–1581.
[27] Ng, J., Sheldon, R. S., Ritchie, D., Raj, V., & Raj, S. R. (2019). Reduced quality of life and greater psychological distress in vasovagal syncope patients compared to healthy individuals. Pacing and Clinical Electrophysiology, 42(2), 180–188.
[28] Wang, Y. Y., Du, J. B., & Jin, H. F. (2020). Differential diagnosis of vasovagal syncope and postural tachycardia syndrome in children. World Journal of Pediatrics, 1–4.
[29] Roberts, P. R., Pepper, C., Rinaldi, C. A., Bates, M. G., Thornley, A., Somani, R., … & Zaidi, A. (2019). The use of a single chamber leadless pacemaker for the treatment of cardioinhibitory vasovagal syncope. IJC Heart & Vasculature, 23, 100349.
[30] Furlan, R., Heusser, K., Minonzio, M., Shiffer, D., Cairo, B., Tank, J., … & Barbic, F. (2019). Cardiac and vascular sympathetic baroreflex control during orthostatic pre-syncope. Journal of clinical medicine, 8(9), 1434.
[31] Biffl, W. L., Ferkich, A., Biffl, S. E., & Dandan, T. (2020). Syncope,“mechanical falls”, and the trauma surgeon. Journal of Trauma and Acute Care Surgery, 89(3), e64–e68.
[32] Aksu, T., Guler, T. E., Mutluer, F. O., Bozyel, S., Golcuk, S. E., & Yalin, K. (2019). Electroanatomic-mapping-guided cardioneuroablation versus combined approach for vasovagal syncope: a cross-sectional observational study. Journal of Interventional Cardiac Electrophysiology, 54(2), 177–188.
[33] Wang, Y. Y., Du, J. B., & Jin, H. F. (2020). Differential diagnosis of vasovagal syncope and postural tachycardia syndrome in children. World Journal of Pediatrics, 1–4.
[34] John, L. A., Mullis, A., Payne, J., Tung, R., Aksu, T., & Winterfield, J. R. (2021). Cardioneuroablation for cardioinhibitory vasovagal syncope. Journal of Cardiovascular Electrophysiology.
[35] Subasi, A., Tuncer, T., Dogan, S., Tanko, D., & Sakoglu, U. (2021). EEG-based emotion recognition using tunable Q wavelet transform and rotation forest ensemble classifier. Biomedical Signal Processing and Control, 68, 102648.
[36] Abdulla, S., Diykh, M., Laft, R. L., Saleh, K., & Deo, R. C. (2019). Sleep EEG signal analysis based on correlation graph similarity coupled with an ensemble extreme machine learning algorithm. Expert Systems with Applications, 138, 112790.
[37] Ren, W., & Han, M. (2019). Classification of EEG signals using hybrid feature extraction and ensemble extreme learning machine. Neural Processing Letters, 50(2), 1281–1301.
[38] Avots, E., Jermakovs, K., Bachmann, M., Paeske, L., Ozcinar, C., & Anbarjafari, G. (2021). Ensemble approach for detection of depression using EEG features. arXiv preprint arXiv:2103.08467.
[39] Chen, Y., Chang, R., & Guo, J. (2021). Emotion Recognition of EEG Signals Based on the Ensemble Learning Method: AdaBoost. Mathematical Problems in Engineering, 2021.
[40] Shen, F., Peng, Y., Kong, W., & Dai, G. (2021). Multi-Scale Frequency Bands Ensemble Learning for EEG-Based Emotion Recognition. Sensors, 21(4), 1262.
[41] Rajeswari C., Sathiyabhama B.,Devendiran S., Manivannan K.A Gear fault identification using wavelet transform, rough set based GA, ANN and C4.5 algorithm.Procedia Engineering, Vol – 2 PP: 338–344, DOI: 10.1016/j.procs.2010.11.044,2014
[42] Zheng, L., Sun, W., Liu, S., Liang, E., Du, Z., Guo, J. … & Yao, Y. (2020). The Diagnostic Value of Cardiac Deceleration Capacity in Vasovagal Syncope. Circulation: Arrhythmia and Electrophysiology, 13(12), e008659.
[43] Sheldon, R. S., Lei, L., Guzman, J. C., Kus, T., Ayala-Paredes, F. A., Angihan, J., … & Raj, S. R. (2019). A proof of principle study of atomoxetine for the prevention of vasovagal syncope: the Prevention of Syncope Trial VI. EP Europace, 21(11), 1733–1741.
[44] Wen, C., Wang, S., Zou, R., Wang, Y., Tan, C., Xu, Y., & Wang, C. (2020). Duration of treatment with oral rehydration salts for vasovagal syncope in children and adolescents. The Turkish Journal of Pediatrics, 62(5), 820–825.
[45] Chen, J. X., Zhang, P. W., Mao, Z. J., Huang, Y. F., Jiang, D. M., & Zhang, Y. N. (2019). Accurate EEG-based emotion recognition on combined features using deep convolutional neural networks. IEEE Access, 7, 44317–44328.
[46] Yaguna, C. E. (2019). New constraints on xenonphobic dark matter from DEAP-3600. Journal of Cosmology and Astroparticle Physics, 2019(04), 041.
[47] Acharya, U. R., Hagiwara, Y., Deshpande, S. N., Suren, S., Koh, J. E. W., Oh, S. L., & Lim, C. M. (2019). Characterization of focal EEG signals: a review. Future Generation Computer Systems, 91, 290–299.
[48] Abiri, R., Borhani, S., Sellers, E. W., Jiang, Y., & Zhao, X. (2019). A comprehensive review of EEG-based brain–computer interface paradigms. Journal of neural engineering, 16(1), 011001.
[49] Vinodhini, V., Sathiyabhama, B., Sankar, S., & Somula, R. (2020). A Deep Structured Model for Video Captioning. International Journal of Gaming and Computer-Mediated Simulations (IJGCMS), 12(2), 44–56.
[50] Li, W., Jayagopal, L. A., & Taraschenko, O. (2019). Ictal asystole with isolated syncope: A case report and literature review. Epilepsy & behavior case reports, 11, 47–51.
[51] Mennella, R., Vilarem, E., & Grèzes, J. (2020). Rapid approach-avoidance responses to emotional displays reflect value-based decisions: Neural evidence from an EEG study. NeuroImage, 222, 117253.
[52] Santhoshi, P. M., & Thirugnanam, M. (2019). An Automated Framework for Prediction of Falls in Cardiomyopathy People. In ICTMI 2017 (pp. 1–15). Springer, Singapore.
[53] Khateeb, M., Anwar, S. M., & Alnowami, M. (2021). Multi-Domain Feature Fusion for Emotion Classification Using DEAP Dataset. IEEE Access, 9, 12134–12142.
[54] Chao, H., Dong, L., Liu, Y., & Lu, B. (2019). Emotion recognition from multiband EEG signals using CapsNet. Sensors, 19(9), 2212.
[55] Ullah, H., Uzair, M., Mahmood, A., Ullah, M., Khan, S. D., & Cheikh, F. A. (2019). Internal emotion classification using EEG signal with sparse discriminative ensemble. IEEE Access, 7, 40144–40153.
[56] Cimtay, Y., & Ekmekcioglu, E. (2020). Investigating the use of pretrained convolutional neural network on cross-subject and cross-dataset EEG emotion recognition. Sensors, 20(7), 2034.
[57] Pane, E. S., Wibawa, A. D., & Purnomo, M. H. (2019). Improving the accuracy of EEG emotion recognition by combining valence lateralization and ensemble learning with tuning parameters. Cognitive processing, 20(4), 405–417.
[58] Rajeswari C., Sathiyabhama B.,Devendiran S., Manivannan K. Bearing fault diagnosis using wavelet packet transform, hybrid PSO and support vector machine, Procedia Engineering, Vol. 97(1), PP: 1772–1783, 2014.
[59] Dong, X., Yu, Z., Cao, W., Shi, Y., & Ma, Q. (2020). A survey on ensemble learning. Frontiers of Computer Science, 14(2), 241–258.
[60] Dou, J., Yunus, A. P., Bui, D. T., Merghadi, A., Sahana, M., Zhu, Z., & Pham, B. T. (2020). Improved landslide assessment using support vector machine with bagging, boosting, and stacking ensemble machine learning framework in a mountainous watershed, Japan. Landslides, 17(3), 641–658.
[61] Mosavi, A., Hosseini, F. S., Choubin, B., Goodarzi, M., Dineva, A. A., & Sardooi, E. R. (2021). Ensemble boosting and bagging based machine learning models for groundwater potential prediction. Water Resources Management, 35(1), 23–37.
[62] N. Kumar, K. Khaund and SM. Hazarika, “Bispectral Analysis of EEG for Emotion Recognition,” Procedia Computer Science. vol. 84, pp. 31–35, 2016, 10.1016/j.procs.2016.04.062.
[63] J. Atkinson and D. Campos, “Improving BCI-based emotion recognition by combining EEG feature selection and kernel classifiers,” Expert Systems with Applications, 2015, 47.10.1016/j.eswa.2015.10.049.
[64] S. Stober, A. Sternin, and A. M. Owen, “Deep Feature Learning for EEG Recordings,” Computer Science, vol. 165, pp. 23–31, 2015.
[65] S. Alhagry, A. Aly, A. Reda, “Emotion Recognition based on EEG using LSTM Recurrent Neural Network,” International Journal of Advanced Computer Science & Applications, vol. 8, no. 10, 2017, 10.14569/IJACSA.2017.081046.
[66] Mehmood, R. M., Du, R., & Lee, H. J. (2017). Optimal feature selection and deep learning ensembles method for emotion recognition from human brain EEG sensors. Ieee Access, 5, 14797–14806.
[67] Horlings, R., Datcu, D., & Rothkrantz, L. J. (2008, June). Emotion recognition using brain activity. In Proceedings of the 9th international conference on computer systems and technologies and workshop for PhD students in computing (pp. II–1).
Biographies

V. Vinodhini received ME degree from Anna University, India in 2014. She is currently working as an Assistant Professor in Sona College of Technology, Salem. Research interest includes Internet of Things and Deep Learning.

Akula Vishalakshi received M. Tech degree from JNTUA (Jawaharlal Nehru Technological University Anantapur),Andhra Pradesh, India in 2011. She is currently working as an Assistant Professor in Sreedattha Institute of Engineering & Sciences, Rangareddy district, Hyderabad, Telangana. Research interest includes Machine Learning and IOT.

G. Naga Chandrika received the B.Tech degree in Computer Science and Information Technology from JNTU, Hyderabad in 2002 and M.Tech degree in Software Engineering from JNTU, Hyderabad, in 2004. She is currently pursuing Ph.D degree in Computer Science and Engineering at ANU, Guntur, AP, India. Since 2011, she has been an Assistant Professor with the Information Technology Department, VNRVJIET, Hyderabad, India. Her research interests include Data Mining, Machine Learning.

S. Sankar completed M.E degree from Anna University and PhD degree from VIT University, Vellore. India in 2019. He is currently working as an Assistant Professor in Sona College of Technology, Salem. Research interest includes Internet of Things, Wireless Sensor Networks and Machine Learning. He has published various papers in International journals and conferences.

Somula Ramasubbareddy is pursuing his PhD in Computer Science and Engineering (CSE), from VIT University, Vellore, India. He did his M.tech from JNTUA, Anantapur, India in 2015. His research areas are Mobile Cloud Computing, Network security, Distributed Computing, Computer Communications (Networks) and Algorithms, IOT
Journal of Mobile Multimedia, Vol. 18_1, 135–162.
doi: 10.13052/jmm1550-4646.1817
© 2021 River Publishers