Extraction and Separation of Overlapped Squamous Cell Cytoplasm with Disjoint Nuclei in Cervical Pap Smear Image
T. P. Deepa and A. Nagaraja Rao*
School of Computer Science and Engineering, VIT Deemed-to-be-University, Vellore-632014, Tamilnadu, India
E-mail: deepa.sce@gmail.com; nagarajaraoa@vit.ac.in
*Corresponding Author
Received 08 July 2021; Accepted 09 September 2021; Publication 11 January 2022
Abstract
The automated analysis of Papanicolaou (Pap) smear images is a challenging issue due to the occlusion of cells. The feature extraction and interpretation depend on the accuracy of cell segmentation. This is important to find the difference between normal and abnormal cells. However, most of the time complications are due to overlapping in the Pap smear cells. The overlapping can be in nuclei regions or cytoplasmic regions or sometimes both the regions. There are two types of cells found in Pap smear images – Columnar and Squamous cells. Most of the time abnormalities are found in squamous cells which in turn may lead to cervical cancer. Hence, this work concentrates on the separation of squamous cells in which cytoplasmic regions are overlapped with disjoint nuclei regions. The main objective of this work is to identify the intersecting points where cytoplasmic regions of two cells meet, called Concavity points, which are calculated using a scope of points along the cytoplasmic boundary of the cells, and separating the cells along with these concavity points.
Keywords: Pap smear, disjoint, cervical cell, squamous, overlapped, hough transformation.
1 Introduction
Cervical cancer is considered one of the deadliest cancers among women. Currently, over a million women are suffering from cervical cancer. The main cause for this cancer is prolonged disease, untimely diagnosis, or delayed treatment. In 2012, there were 5,28,000 new and 2,66,000 death cases of cervical cancer of which 90% of them are from low to middle-income countries. In the next 10 years, the death rate will rise by 25%. The primary cause of cervical cancer is an infection due to Human Papillomavirus (HPV). These viruses are transferred through sexual intercourse in their early sexual life. The existence of HPV infection results in abnormal cervical cells which further turn into cancer if it is untreated [1].
The cervix is the lower third part of the uterus which measures approximately 3 cm in length and 2.5 cm in diameter. The lower part of the cervix called the ectocervix lies within the vagina. The upper two-thirds of the cervix called the endocervix lies above the vagina. Cervical cancer originates at the transformation zone, which is an area where the endocervix and ectocervix meet. The cervix is made up of dense fibro-muscular tissue. The surface of the cervix is lined by two types of epitheliums. One is the columnar epithelium that lines the canal; another one is the stratified squamous epithelium which extends from the vagina. The line where the two epithelia join is called squamocolumnar junction (SCJ). 90% of cancer occurs in squamous cells which are initiated in the transformation zone of the ectocervix and 10% are in the glandular columnar layer of the endocervix. The cells become abnormal in the presence of long-term HPV infection. The features are changed in the epithelial cells of the transformation zone which later convert into precancerous cells. It takes many years for precancerous cells to convert into cancerous cells, hence there is enough time for diagnosis and treatment [1].
The primary screening technique for cervical cancer is called Pap Smear Test. This test has reduced the incidence and mortality rates of cervical cancer in most developed countries. The Pap smear test involves scraping the cells from the transformation zone of a woman’s cervix using cytobrush and depositing it on the microscopic slide with the use of suitable stain by cytotechnicians. The cytologists physically examine the cells by placing the slide under the microscope to find abnormalities if any [2].
There are three different types of squamous cells found in the Pap smear image – (1) The superficial cells which are the largest, small pyknotic nuclei, red-stained cytoplasm. (2) An intermediate squamous cell that is slightly smaller than superficial with larger, clear structures, round nuclei, and blue-stained cytoplasm. (3) The parabasal cell is smaller, more rounded, and immature. The features which distinguish abnormal cells from normal are elongation or condensation of nuclei and cytoplasm, shape irregularity, hyperchromicity [3].
This manual procedure is time-consuming, prone to human errors, labor-intensive, ambiguous, and subjective due to a greater number of cells. Hence, only skillful pathologists can accurately locate the abnormal cells among thousands of cells on the slide [6]. The inadequate number of cells collected, the overlapping of cells. Poor contrast of cytoplasm, presence of biological debris like mucus, blood, inflammatory cells affect the results orienting towards the negative side. Hence, there is a need for techniques that address these problems. One such technique used is the computer-aided automated cell analysis system which helps pathologists to accurately diagnose precancerous cells [4, 6].
The automated cell analysis system provides an efficient method to analyze a large number of cells and reduces the challenges of the manual method. This method acquires a digital image of the microscopic slide containing Pap smear cervical cells and applies image processing techniques like object detection, segmentation and classification to analyze the individual cells. They extract quantitative features and structural information of each cell-like shape, size of nucleus and cytoplasm, nuclei to cytoplasmic ratio, cell texture which plays a vital role in the early detection of precancerous cells [7].
The image segmentation plays a major role in the automated detection of cells as it separates the individual cells from the background in case both overlapped and non-overlapped. The accuracy of the classification depends on how precisely the segmentation extracts individual cells. Though the use of a computer-aided automated system improves both sensitivity and specificity of the screening, it is one of the most challenging tasks when cells are overlapped. The clusters formed due to overlapping of cells result in the upper layer of cells partially covering the lower layer cells due to which extraction of a cell becomes complicated. During the manual method, the cytologists access the cells at different layers using different focal lengths and they use depth cues to focus the specific cells resulting in inaccurate results when the overlapping degree is more. Also, the extraction of overlapped cytoplasm is more difficult than in the case of overlapped nuclei because the boundary of the cytoplasm is irregular in shape. The accurate extraction of overlapped cells is only possible by using an efficient segmentation technique which further improves the classification and analysis results [4].
The design and development of an automated Pap smear cell analysis system are done by many researchers across the globe. They have used image processing techniques like thresholding, watershed algorithm, neural networks, and many other segmentation techniques to separate overlapped cells. They have used parameters like shape, size, edge, intensity to identify the cervical cells in pap smear images [7].
The method proposed for segmenting individual cervical cells includes three main steps – cell component segmentation, multiple cells labeling, cell boundary refinement, and inference. Cell component segmentation classified each pixel into a region of nuclei, cytoplasm, and background. The cells are represented using their nucleus and a multi-scale Convolutional Neural Network (CNN) is used to obtain features of nuclei from the image. This network has windows of multiple sizes centered at every pixel in the image. The network is trained to encode multiple types of information such as appearance, texture, contextual, shape in multiple sizes of contextual windows. The segmentation of overlapped cells is performed using labeling each n number of cells in the given image. For each cell, the cytoplasmic pixel i with a label Li is assigned. The energy function in Equation (1) is assigned to each cell with label {L0, L1, …Ln} to all pixels, where label L0 represents the background [7].
| (1) |
Where v is the set of pixels in an image, w is the parameter vector of the model, and shape parameters of cytoplasm which is estimated by the Gaussian kernel. The term is the unary potential and is referred to as overlapping-based unary cost. This function obtains the cost of a pixel i labeled as Li with its shape. It also estimates the probability of pixel i from cell Li. This term ensures that cells can be separated from the overlapped cluster. The term provides the consistency between labels Li and Lj of neighboring pixels i and j. The cells in the overlapped cluster have multiple labels where Si and Sj are the overlapped clusters represented as Si Sj, an overlapped region between the clusters is represented as Si Sj. Pixels in the overlapped region are labeled as Li and Lj. The dynamic multi-template deformation model is used to label the multiple cells. To separate overlapped clusters with m cells, the energy function in Equation (2) is used as follows-
| (2) |
Where, E is the data energy obtained from each cell independently, represents the neighborhood set of cells i, is a binary function which works as an overlapping constraint, which means if there is no cell overlapped with cell i then the binary function sets to zero. The method used two datasets – ISBI 2015 challenge dataset and Shenzhen University (SZU) dataset. 5650 background, 8590 cytoplasms, and 8560 nucleus pixels are taken from eight images in the SZU dataset to train the model. The proposed method performed remarkably when the overlapping cells and other conditions like illumination variances, dye concentration, and uneven dyeing. The authors used 200 cell clusters with different overlapping degrees in each dataset. They observed the result is better with the SZU dataset compared to ISBI 2015 dataset. The SZU dataset is more complicated as it contains more abnormal cells in the cluster which vary in shape, color, etc. The proposed method obtained a Dice coefficient (DC) of 0.8 when the overlapping degree is under 0.5. The proposed method did not address the folded cells and overlapped nuclei [7].
The method proposed an adaptive pruning deep transfer learning (PSINet-TAP) to classify pap smear cells. They adopted transfer learning to obtain a pre-trained model due to the limited availability of only 389 cervical pap smear images. The proposed model consists of 10 convolution layers and 3 full connection layers. Convolution kernel extracts the edge information in an image. With the influence of background information and to effectively obtain the texture features, PSINet-TAP is repeatedly trained. It consists of a non-fully connected layer, two different fully connected output layers. The three convolutional layers have 64, 128, 256, 384, and 512 channels. The number of neurons in every three connected layers are 2048, 1024, 1000 respectively. The two fully connected layers have 50 and 2 neurons. To reduce the overfitting, batch normalized layer and dropout layer are added. The procedure consists of three operations- fine-tuned the pre-trained network, evaluate the importance of each filter, and prune unimportant filters [6]. The convolutional operator maps input feature map to output feature map is given in Equation (3)-
| (3) |
Where l is the number of convolutional layers, denotes the number of filters, K X K denotes the size of the kernel, c denotes the number of classes, represents the output feature, represents the input feature map. The model adaptively prunes all unimportant convolution kernels as per their scores. The method used 389 cervical cell images in which 120 are normal, 206 are normal cell images from abnormal patients, 63 are abnormal images. The abnormal patients include low-grade squamous intraepithelial lesion (LSIL), high-grade squamous intraepithelial lesion (HSIL), and squamous cell carcinoma (SCC). The images are 24-bit color depth and have a resolution of 1388 1040 pixels. The cells are classified into three groups – normal v/s abnormal images, normal v/s uninvolved images, normal v/s abnormal images. It is observed that the number of pruned filters impacted the accuracy. The method exhibited more redundancy when the number of filters was too small by consuming more resources and produced inaccurate classification results. The classification accuracy decreased due to the removal of important filters from the model due to excess filters [6].
The research implemented a method to automatically segment each cell nucleus and cytoplasm from overlapped clusters in real EDF with multi-layer Pap images. The multi-pass fast watershed (MPFW) is an adaptable and cost-effective method applied for the segmentation of both nuclei and cytoplasm. This method used three watershed passes – the first pass to segment nuclei using intensity gradient information. The second pass uses cell shape and cell location to segment isolated and partially overlapped cells. The third pass segments the nucleus of those largely overlapped cells which are not addressed in the previous pass. Elliptical modeling is used to segment the cells which deformed the line-shaped watershed contour. The five test datasets provided in ISBI Overlapping Cervical Cytology Image Segmentation Challenge are used. The first dataset consists of 945 synthetic images which are divided into 45 training images and two sets of test images. All images are 512 512 grayscale images with overlapped cells. These images are synthetically created by overlapping isolated cells from real Pap smear images. The number of overlapping cells in a cluster ranges from 2 to 10 with overlapping coefficients ranging from 10% to 50%. The proposed method showed satisfactory results in segmenting the cell at different DC thresholds. Cytoplasm segmentation showed low DC with 0.75. At the threshold of 0.5, the true positive and DC obtained are 0.89 and 0.94 respectively. The highest true positives obtained are 0.997 and 0.981 on different datasets indicating that segmentation is near to the ground truth. The proposed method is efficient in segmenting overlapped cell clusters up to 40% overlapping. The performance degrades when the overlapping degree is high and shape information is not available [2].
The researchers proposed an algorithm to segment cytoplasm and nuclei from overlapped cell clusters. This method analyzes a single image with extended depth of field (EDF), where all the cells and objects in the multilayer are brought into a single image at similar focal depths. This method could segment both the nucleus and cytoplasm from clusters. The proposed methodology has two steps- first, the cell cluster with overlapped cells is segmented using unsupervised classification. Second, it detects nuclei using a maximally stable extremal regions (MSER) algorithm. This method estimated overlapping cell regions using prior shape information and segmented individual cells in the cluster. For initial segmentation, a level set method is used which applies multiple level set functions with the constraints such as cell contour length, edge strength, prior shape information, area of the overlapping regions. The dataset used consists of synthetic cells which are obtained by segmenting free lying cells from real images. It also consists of 16 non overlapping images from four cervical cytology specimens prepared using AutoCyte PREP technology. Each image consists of 20 to 60 Pap cells with different overlapping degrees. There are around 11 clusters with 4 cells in each cluster, the cluster size varies from 1 to 21 cells. The overlapping clusters are formed with 2 to 10 cells in each cluster with 10% to 50% overlapping between the cells. It is observed that the proposed method could segment the cell clusters with less than 20% overlapping degrees. Though the methodology produces robust results in the segmentation of nuclei and cytoplasm from overlapping cells, few issues could not be addressed like lack of precision when large numbers of cells overlap, when the complete cluster boundary is not available, false-negative detection of nuclei [4].
The authors proposed a method for the segmentation of overlapped nuclei using boundary and shape information. The physical deformable model is used to segment single and overlapped nuclei based on the shape of the nucleus. The model consists of n virtual masses located at different points and its behavior is controlled by an equation of motion formulated using boundary points and two n-dimensional differential matrix equations. This equation represents equilibrium between virtual mass as internal force and pixel intensity as an external force. The major and minor axis information is used to obtain elliptical shape information of nuclei. The initial position of the model is determined using the mean nuclei boundary whose distance to the real nuclei boundary is used to confirm the overlapping of cells. The dataset includes a training set constructed using 300 images which contains a single normal nucleus of conventional pap smear and a test set consisting of 152 images with two overlapping nuclei yielding a total of 304 nuclei. The images are acquired at 40 magnification, and in JPEG format with size 273 315 pixels. The performance of the proposed method is evaluated by estimating the boundaries of the nuclei in the test-set manually by cytopathology experts. The intensity of overlapped areas varies in intensity compared to other cell regions. Based on this ground truth, the area of the overlap is calculated which varies from 4.0% to 48.2 % with a mean standard deviation of . The Euclidean and Hausdorff distance is used to measure the difference between the output of the proposed method and the ground truth [8].
2 Methodology
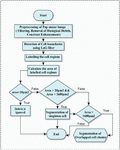
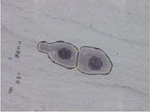
Image, considered in this work, consists of cell clusters with two cells in which cytoplasmic regions are overlapped and their nuclei are disjoint are shown in Figure 2. Initially, the Pap smear color image is converted into a grayscale image, since the color information does not influence the performance of the proposed method and this conversion is easy for computation. The proposed method is implemented in two stages, the first stage does the preprocessing and segmentation of singleton squamous cells and overlapped clusters. The proposed preprocess method reduces the main discrepancies like debris (blood cells, yeast, and other bacteria), uneven staining, and Poisson noise. The workflow of the first stage is shown in Figure 1 and elaborated in a section titled “Preprocessing and Segmentation of Singleton Squamous cells”. In the second stage, the proposed method extracts the cells from an overlapped cluster and is elaborated in a section titled “Separation of overlapped squamous cells”.
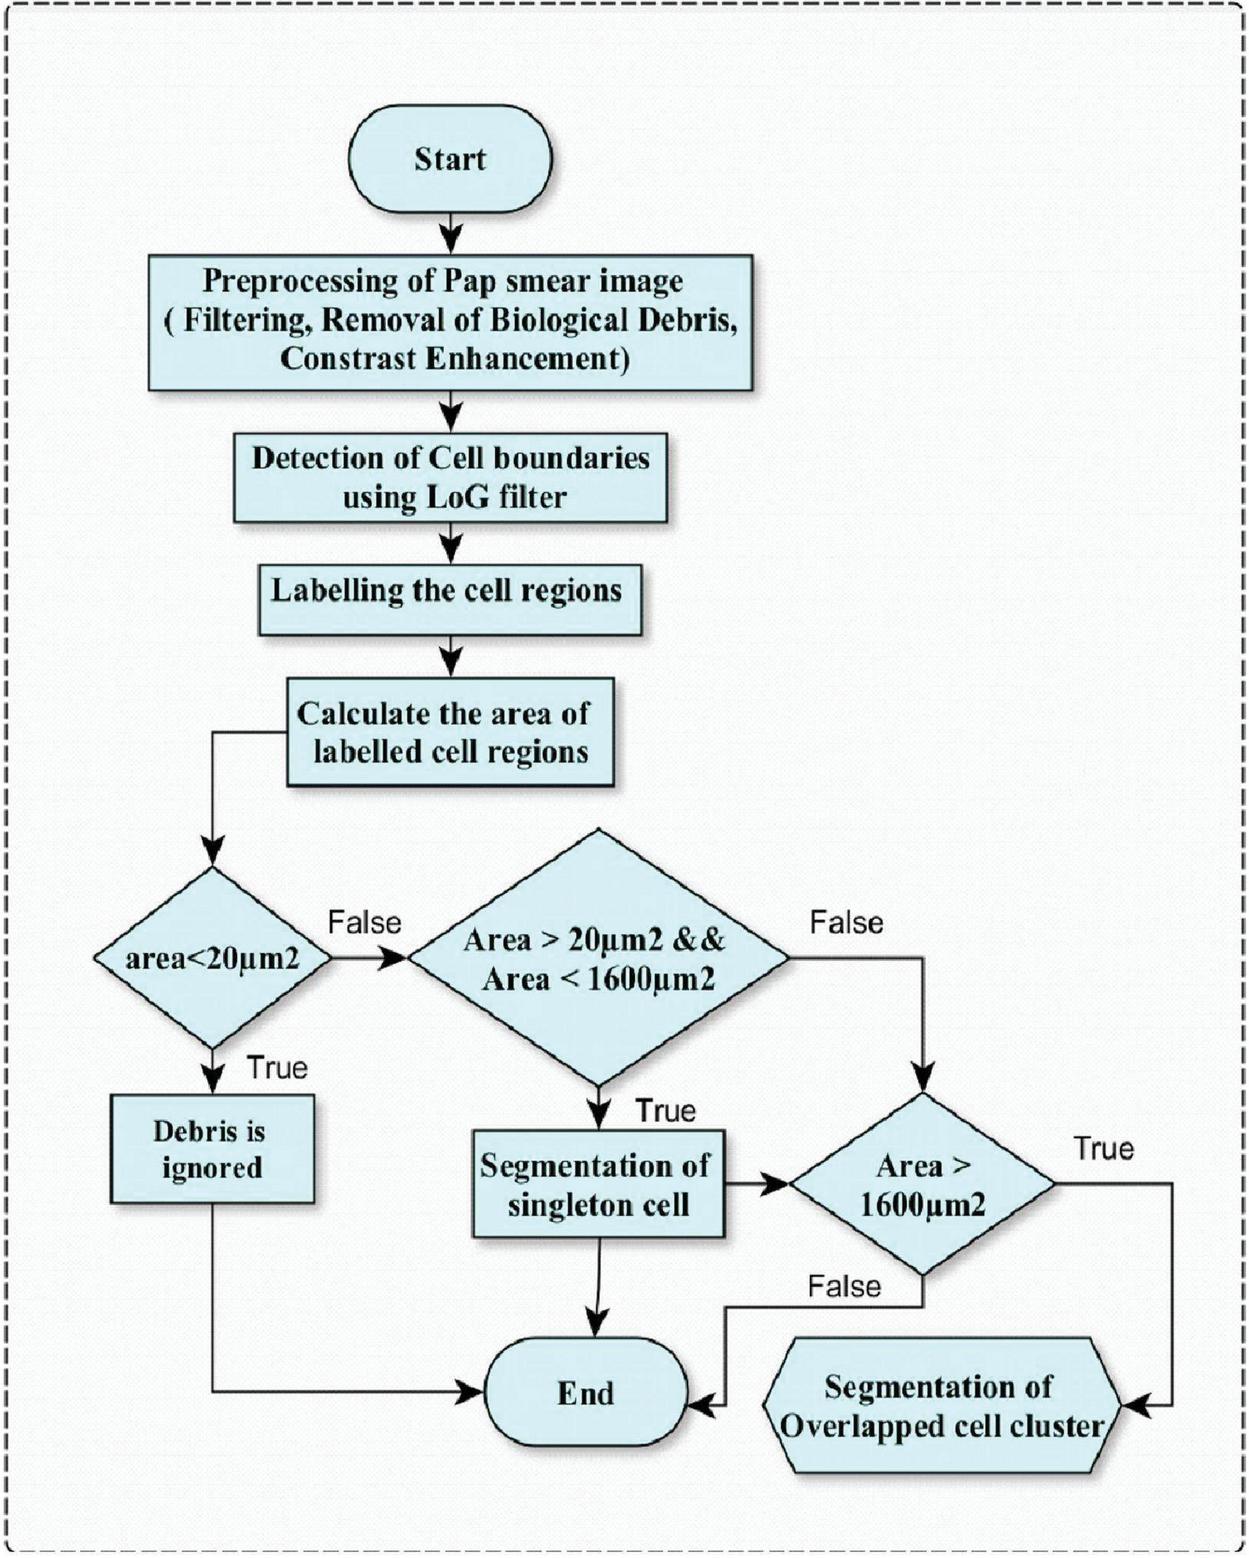
Figure 1 Phase 1 preprocessing and segmentation of singleton squamous cells.
2.1 Preprocessing and Segmentation of Singleton Squamous Cells
The preprocessing step is carried out by removing Poisson noise, which is caused by the light source used during pap smear image acquisition using a light microscope, by Adaptive Wiener filter. The adaptive wiener filter is used to invert blur and removes the extra noise. One of the important segmentation features is the cytoplasmic area. To find this area, the boundary of the cytoplasm should be distinguished clearly. This cytoplasmic area is bright, blurred, and suppressed by the background. Hence, to deblur the cytoplasmic area and separate it from the background, an adaptive wiener filter is used. This suppression of background helps to clearly distinguish the region of interest (cytoplasm) which further improves the accuracy of segmentation.
The pap smear images used in this work are acquired from microscopic slides using a light microscope. The working principle of a light microscope states that few objects emit visible light when light with a certain wavelength falls on them. When the light from the source of the light microscope falls on the cells, it will emit visible light, this light can be captured using a CCD camera, and an image is formed. This light consists of photons that carry some amount of energy depending on the speed of light and Planck’s constant.
The variations in the energy of photons at random time intervals are statistical and measured in the form of Poisson distribution. Some photos are very small and cannot be measured statistically hence resulting in the noise called Poisson noise. This noise is intrinsic and unavoidable during image acquisition. Hence, a Wiener filter is used to remove the Poisson noise [13]. The authors conducted a comparative study of different filters to remove Poisson noise. After testing on different images, it is concluded that the adaptive wiener filter produces better results than other filters to remove Poisson noise [9].
After applying the wiener filter, the image is deblurred and free from Poisson noise which results in the separation of squamous cells from the background. But in some cases, the boundary of cells remains smooth. To enhance this further, contrast enhancement is performed using Adaptive histogram equalization (AHE). In this method, each pixel is transformed using a transformation function that is derived from a neighboring region. The transformation function is based on the histogram of a square of the surrounding pixel and the cumulative distribution function (CDF) of the neighborhood pixel values. As the noise is already removed using an adaptive wiener filter, the AHE cannot over amplify the noise.
The use of adaptive wiener filtering and AHE contrast enhancement results with the image in which the cell cytoplasmic area is well distinguished from its background. The enhanced edges of the cells make a clear boundary that distinguishes the cell region and suppresses its background.
Later, LoG filtering is applied to the enhanced image to detect edges and label them. As edges appear in the high-frequency domain, LoG filtering helps to pick them. This is followed by region closing, filling, labeling, and feature extraction. The main feature used in this work is an area to distinguish between debris, singleton cells, and overlapped cells in the image. The statistical value of an area for different singleton normal squamous cells varies as shown in Table 1 [10].
Table 1 Areas of different single normal squamous cells [10]
| Squamous Cell Type | Nuclei Area | Cytoplasmic Area |
| Basal and Parabasal | 50 m | 200–300 m |
| Intermediate and superficial | 20–35 m | 800–1600 m |
Table 2 Criteria for segmentation of squamous cells
| Labeled Region | Area | Segmentation Output/Action Taken |
| Debris | 20 m | Ignored in the segmentation output which leads to debris removal. |
| Singleton squamous cells | 200 m and 1600 m | Considered as singleton squamous cells and retained in segmentation and can be given to feature extraction (future work) |
| Overlapped squamous cell cluster | 1600m | This is a squamous cell cluster and is given to phase 2 of the proposed methodology. |
As this work mainly concentrates on the segmentation of squamous cells, any other components existing in the image are considered as debris. The nuclei and cytoplasmic area are two main features used in this work for segmentation. These two areas are calculated by counting the corresponding pixels of the labeled region with pixel area as 0.201 m. They are measured based on the number of pixels inside the cells and the scale of the image. The pixel considered for counting is based on the grayscale intensity which is measured using a mean value of the intensity of the pixels inside the cell. According to ground truth data specified in the Herlev dataset by Jens Byriel [12]. The nucleus area of normal cells ranges from 20–50 m as shown in Table 1. The area of nuclei of the smallest squamous cell is considered as a higher threshold of debris. It means that any components whose area is less than 20 m, are considered as debris and ignored during the segmentation. Another important aspect is to address the cellular components which are embedded in the boundary on an image. Since these components are incomplete and will not contribute much to the segmentation they can be ignored. The summary of these characteristics is shown in Table 2.
This stage produces the denoised and biological debris-free image, on which the singleton squamous cells and overlapped cell clusters are segmented. The overlapped cell cluster is extracted for further processing in the next stage which is the main objective of this paper.
2.2 Separation of Overlapped Squamous Cells
In this phase, the segmented cell cluster from the previous step is used, and further, the point of intersection called concavity point between two overlapped cells is found. The algorithm to find concavity points is given below:
Algorithm 1 To find concavity points and separate overlapped cytoplasmic areas
Input: Overlapped squamous cell Cluster which is segmented using Phase 1.
Output: single squamous cells from the overlapped cluster.
Step 1: Find the vector of maximum boundary points along overlapped squamous cell regions using Hough lines.
Step 2: Obtain tangent along each boundary point obtained in step 1.
Step 3: Find the slope and acute angle of the tangent.
Step 4: Find two concavity points lying on the tangent whose acute angle is maximum.
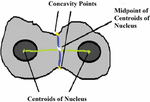
Step 5: Find centroids of two disjoint nuclei in the same overlapped region using the connected component method.
Step 6: Obtain a midpoint along two consecutive nuclei centroids obtained from step 4.
Step 7: Consider this midpoint as a reference point to find the position of concavity points. It helps to locate two collinear and opposite concavity points in a given overlapped area. To check the position of given point w.r.t midpoint, use the Equation (4) in which (A1, A2) and (B1, B2) are concavity points and (M1, M2) is midpoint along with centroids of disjoint nuclei,
| (4) |
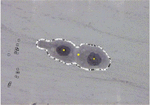
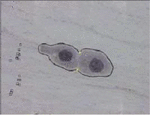
To find concavity points, first, identify the centroids of two disjoint nuclei in an overlapped cytoplasmic region in the cluster. Find midpoint to the centroids, join this midpoint with concavity points in such a way that it separates overlapped cytoplasmic regions as shown in Figures 3 and 5. In this method, the accuracy in obtaining concavity points helps in the proper segmentation of overlapped cells.
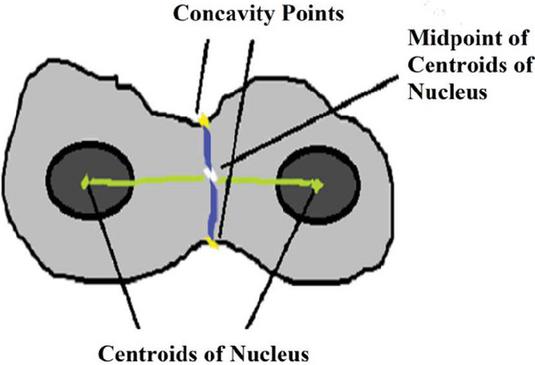
Figure 2 Separating overlapped cytoplasm with disjoint nuclei using concavity points.
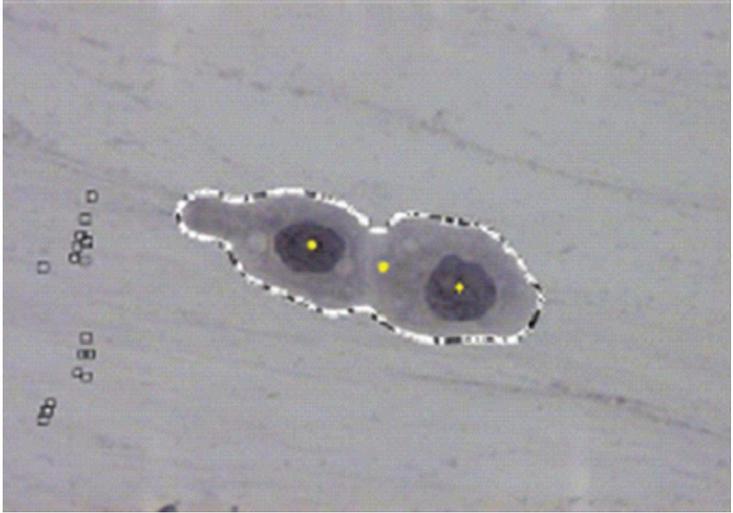
Figure 3 Centroids and mid-point of centroids.
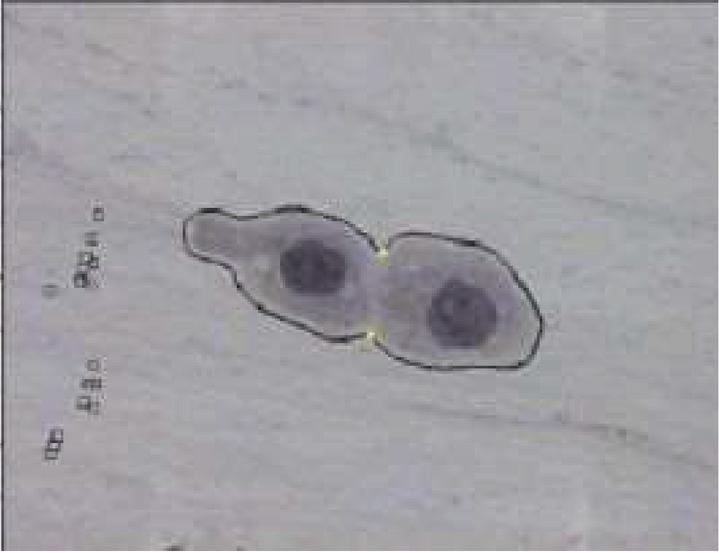
Figure 4 Two opposite, collinear, concavity points.
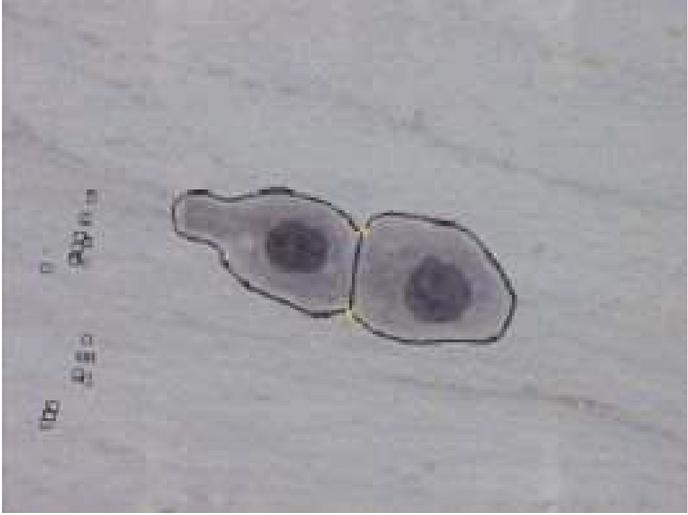
Figure 5 After joining concavity points.
As shown in Figure 3, it is necessary to locate all the points on the boundary of overlapped cells to find the accurate location of concavity points. It in turn affects the segmentation output because locating the exact boundary of the overlapped region mainly depends upon the position and location of concavity points. One approach to do this is using Hough Lines because it is efficient in identifying pixels that are not contiguous and works well when the edge has short breaks due to noise and also when objects are partially occluded [11]. Also, for each pixel and its neighborhood, the Hough algorithm determines whether there is a possibility of a straight line at each pixel or not to trace all pixels in the neighborhood. The Pap smear cell image consists of cells with irregular shapes and edges that are not continuous due to poor acquisition under the microscope. So, Hough lines helped to locate all pixels on the edge lines of overlapped regions accurately. Hough line transformation in this work is mainly used to obtain maximum points along the boundary of the overlapped cell cluster. This is achieved by locating a maximum number of Hough lines of length 1 and peaks 200. It is known that most likely lines can be extracted by finding bins with the highest value. The best way to find these peaks is to choose a proper threshold, hence peaks 200 are chosen, maximum lines are extracted and boundary points are located as shown in Figure 3. The slope and acute angle are calculated by drawing the tangent at each boundary point. The two points which are having maximum acute angle are considered as concavity points as shown in Figure 4. Then, the midpoint of centroids of the nuclei is evaluated. The opposite concavity points and midpoints should be collinear then only the points will be connected. The collinearity is confirmed based on the scope of a line joining of these points. For example, if concavity point 1 is A, the midpoint is B, and concavity point 2 is C, then if the slope of line AB is equal to the scope of line BC, these three points are considered collinear.
3 Results and Discussion
The input image for this study is standard Pap smear images from the Herlev database [12]. The images are obtained by skilled cytotechnicians using a microscope connected to a frame grabber. The images are acquired using 400 magnification and a resolution of 568 768 pixels in 24-bit colors with a scale of 0.201 m/pixel. The image consists of a cluster with two overlapped cells.
This proposed method segments the irregular shape of pap smear cells without any prior information. The LoG filter and connected component method used in the first stage produces accurate results in segmenting single cells and denoising biological debris. The label for a segmented region can be used for further feature extraction and analysis. It is providing accurate results when a cell is disjoint but it is identifying a cell cluster as a single cell region in case of overlapping. To overcome this, the proposed method, in stage 2, separates the cells of an overlapped cluster with two cells and the overlapping degree is less than 50%. The proposed method is tested on 400 images consisting of singleton cells, a cluster of cells, and a mix of single and overlapped cells.
The proposed method compares with the various method such as variational method with Star-Shape Prior (VMSSP), Radiating Gradient Vector Flow (RGVF), Gaussian mixture model using the EM algorithm (GMMEM), Multiple-scale deep convolutional networks (MSDCN) and Independent Level Sets Also these methods require prior information like the shape of the cell and showed relatively poor performance for irregular shape. Radiating Gradient Vector Flow (RGVF) produces better results when the Pap smear image consists of a separate nucleus and single cytoplasm and is not addressing overlapped cells. The Gaussian mixture model using the EM algorithm (GMMEM) uses two different algorithms for nuclei and cytoplasmic segmentation in an overlapped clump. Multiple-scale deep convolutional networks (MSDCN) segments overlapped cytoplasm at an overlapping degree of 7. But due to the missing of false boundaries in case of irregular shape, this method did not perform well. Segmentation using Independent Level Sets (ILS) could not address a higher degree of overlapping and hence accuracy is less. The proposed method performs well in the case of a stained cell even with poor contrast with a degree of overlapping is less than 50% and it is quite evident with the results, that the proposed method significantly produces better performance without any prior information.
3.1 Performance Metric
The rate of specificity and sensitivity are used to quantify segmentation results which are estimated by comparing results with manual results provided by an expert. The quantitative performance analysis of the proposed segmentation method is done using accuracy which in turn depends on True positive rate, True negative rate, False Positive Rate, and False Negative rate. The Dice Coefficient (Dc) is given in the Equation (5).
| (5) |
Where,
True Positive Rate (TPR): It is a rate at which positive squamous cells are identified positively.
It is given by – True Positive/positive. It is the ratio of the true positive which is a total number of cells identified as squamous cells to the total number of actual positive squamous cells in the given pap smear image.
False Positive Rate (FPR): It is a rate at which non-squamous cervical cell structures are falsely identified as cervical squamous cells. It is given by – False Positive /Negative. It is the ratio of the number of cells which is not a squamous cell but identified as squamous cells to the actual number of non-squamous cells in the given pap smear image.
False Negative Rate (FNR): It is a rate at which cervical squamous cells are ignored as non-squamous cervical cell structures. It is given by – False Negative/Positive. It is a ratio of the number of squamous cells but identified as non-squamous cells to the actual number of squamous cells in the given pap smear image.
True Negative Rate (TNR): It is a rate at which non-squamous cervical cell structures are correctly identified as not squamous cells. It is given by – True Negative/Negative It is the ratio of the number of non-squamous cells identified as non-squamous cells to the actual number of non-squamous cells in the given pap smear image.
Example: Given an image with 100 cells, of which 60 are squamous, 40 are non-squamous cells (columnar cells or biological debris). Suppose, the proposed algorithm detects 50 cells as squamous and 50 as non-squamous cells. Then, True positive is 50/60 0.83. Then TPR 83%. In this, 50 cells are identified as squamous, but there are 60 squamous cells in actuality. It means 10 cells are wrongly identified as non-squamous cells. There, false-negative 10/60 0.16, FNR 16.6%. Here, out of 50 non-squamous cells, 40 are correctly identified as non-squamous cells, therefore, the True negative is 40/40, TNR 100%, suppose, all the 50 squamous cells are identified correctly, then False-positive 0/40, FPR 0. Since FNR 16.6%, an algorithm has to be improved.
The dice coefficient,
| Dc | |
The dice coefficient of the proposed method is nearly 0.9 when compared with GMMEM, ILS, VMSSP whose dice coefficient varies from 0.7 to 0.88. But it could not perform when the overlap of cytoplasm is more than 50% and more than two cells in the cluster. Though the dice coefficient of RGVF is 0.9, it addresses only singleton cells whereas the proposed method addresses both singleton and overlapped cells.
This proposed work separated the overlapped cell under consideration well by finding concavity points. The concavity points are identified accurately using the Hough line transformation method to locate almost all points on the boundary of the cluster. Also, as this method used all points along the boundary of a cluster, it could find concavity points accurately even when cells are of irregular shapes. Later these concavity points are joined to separate overlapping cells. Since this involves identifying edge points of overlapped cell clusters there is no need for prior information like shape. It also works well for points that are not contiguous and when regions are occluded. Further, it can be extended to separate overlapped nuclei, and when a greater number of overlapping cells in a cluster will be considered as future work. The main advantage of the proposed method is that it improves the classification of cytological cells which has a vital role in the diagnosis of cervical cancer.
References
[1] World Health Organization, Comprehensive Cervical Cancer Control-A guide to essential practice Second edition, pp. 8, 2014.
[2] Afaf Tareef, Yang Song, Heng Huang, Dagan Feng, Mei Chen, Yue Wang, and Weidong Cai, ‘Multi-Pass Fast Watershed for Accurate Segmentation of Overlapping Cervical Cells’, IEEE Transactions on Medical Imaging, pp. 2044–2059, 2018.
[3] Plissiti, M. E., Nikou, C. and Charchanti, A., ‘Automated detection of cell nuclei in Pap smear images using morphological reconstruction and clustering’, IEEE Transactions on Information Technology in Biomedicine, pp. 233–241, 2011.
[4] Lu, Z., Carneiro, G. and Bradley, A. P., ‘An improved joint optimization of multiple level set functions for the segmentation of overlapping cervical cells’, IEEE Transactions on Image Processing, pp. 1261–1272, 2015.
[5] Malm, P., Balakrishnan, B. N., Sujathan, V. K., Kumar, R. and Bengtsson. E, ‘Debris removal in Pap-smear images’, Computer Methods and Programs in Biomedicine, pp. 128–138, 2013.
[6] Pin Wang, Jiaxin Wang, Yongming Li and Linyu Li, H. Z., ‘Adaptive Pruning of Transfer Learned Deep Convolutional Neural Network for Classification of Cervical Pap Smear Images’, IEEE Access: Multidisciplinary, pp. 50674–50683, 2020.
[7] Youyi Song, Ee-Leng Tan, Xudong Jiang, Jie-Zhi Cheng, Dong Ni, Siping Chen, Baiying Lei and Tianfu Wang, ‘Accurate Cervical Cell Segmentation from Overlapping Clumps in Pap Smear Images’, IEEE Transactions on Medical Imaging, pp. 288–300, 2017.
[8] Plissiti, M. E. and Nikou, C., ‘Overlapping cell nuclei segmentation using a spatially adaptive active physical model’, IEEE Transactions on Image Processing, pp. 4568–4580, 2012.
[9] Deepa, T. P., and Nagaraja Rao, A., ‘A Study on Denoising of Poisson Noise in Pap Smear Microscopic Image’, Indian Journal of Science and Technology, pp. 1–10, 2016.
[10] Byriel J., ‘Neuro-Fuzzy classification of cells in cervical smears’, Technical University of Denmark, 1999.
[11] Ruberto, C. Di, ‘Generalized Hough Transform for Shape Matching’, International Journal of Computer Applications, 2102.
[12] Downloads. http://mde-lab.aegean.gr/index.php/downloads
[13] Rajeev Srivastava, J.R.P. Gupta, and Harish Parthasarathy, ‘Enhancement and Restoration of Microscopic Images Corrupted with Poisson’s Noise using a Nonlinear Partial Differential Equation-based Filter’, Defence Science Journal, Vol. 61, No. 5, September 2011, pp. 452–461.
Biographies

T. P. Deepa received the Bachelor of Engineering, Computer science and engineering in 2003 and Master of Technology, Computer science in 2006 from Visvesvaraya Technological University, Karnataka, and is currently pursuing a doctorate degree in image processing from VIT Deemed-to-be university. Her research areas include image processing, machine learning, and deep learning.

A. Nagaraja Rao has Completed M.Sc in Computer Science from SV University, M.Tech. in Computer Science and Engineering from JNTU Hyderabad and Ph.D. in Computer Science from University of Mysore. He has more than 18 years of teaching and research experience. He is a life member of CSI, ISTE professional bodies. At present he is working with VIT, Vellore as an Associate Professor in School of Computer Science and Engineering (SCOPE). He has published more than 50 papers in international journals and Conferences. His areas of interest include Image Processing, Medical Image processing, Data Analytics and Pattern Recognition.
Journal of Mobile Multimedia, Vol. 18_3, 521–540.
doi: 10.13052/jmm1550-4646.1833
© 2022 River Publishers