EEG Signal Enhancement and Spectrum Estimation Using Fourier Transform Magnitude Response Derivative Functions
Devulapalli Shyam Prasad*, Srinivasa Rao Chanamallu and Kodati Satya Prasad
Dept. of ECE, JNTU, Kakinada, Andhra Pradesh, India
E-mail: devulapallishyam@gmail.com
*Corresponding Author
Received 08 June 2021; Accepted 31 July 2021; Publication 29 October 2021
Abstract
Electroencephalograph is an electrical field that produced by our brain without any interrupt. In this paper, I & II-order derivatives of the Magnitude Response Functions are proposed for EEG signal Enhancement. By using this concept the random noise existing in the Electroencephalograph (EEG) signals can be reduced. A simulated model is discussed to mix the random noise of varying frequency & magnitude with the EEG signals and finally remove the noise signal using I & II-order derivatives of the Magnitude Response Functions filtering approach. The model can be used as estimation and get rid of the tool of random as well as artifacts in EEG signal from multiple origins. This work also shows the magnitude spectrum and comparing with FT magnitude spectrum. The filter characteristics are determined on the basis of parameters such as Mean Square Error (RMSE), SNR, PSNR, Mean Absolute Error (MAE) & Normalized Correlation coefficient (NCC) and a good improvement is reported.
Keywords: Wavelet transform, I and II-order group delay function, fast fourier transform (FFT), electroencephalograph EEG.
1 Introduction
Mr. Berger recorded the first electroencephalograph (EEG) in 1929 by externally connecting numerous electrodes to the human skull [1]. These signals typically convey information about physiological functions that are relevant to the brain in an indirect manner. Several conceivable uses for these signals have been integrated into the designs of modern technological gadgets with embedded intelligence and supplied for Brain-Computer-Interfaces (BCI), and they have become in great demand in medical appliances for automatic signal interference [2]. Signal collection, processing, pattern detection, and eventually control systems are all part of BCI [3].
Each of the five major brain waves has an own frequency range [4]. They certainly are. Theta waves have a frequency range of 4 to 7 Hz and amplitude of usually greater than 20 V. Delta waves have a frequency range of 0.5 to 4 Hz, Beta waves have a rate of change of 13 to 30 HZ and a low voltage range of 5–30 V, while Alpha waves have a frequency range of 8 to 13 Hz and a 30–50 V amplitude. Gamma waves, which occur at frequencies of 35 Hz and higher, are typically associated with active thinking, active attention, concentrating on the outside world, or resolving practical difficulties.
The consciousness mechanism is supposed to be represented by this band. We use theta, beta and alpha frequencies to characterise mental tasks in our work.
The first steps in BCI systems are data collection and filtering, with the filters designed to prevent introducing any distortion or alteration to the signals. High pass filters with a cut-off frequency of less than 0.5 Hz are used to remove the irritating very low frequency components, such as those of breathing. The use of a low pass filter with a cut-off frequency of around 40–70 Hz is used to minimise high-frequency noise [4].
The eminent organization of the paper is as follows: The backdrop for EEG Signal Denoising is explained in Section 2. Section 3 is devoted to an overview of significant denoising techniques, such as the wavelet transform. Section 4 describes the proposed method for EEG signal denoising based on Fourier Transform Magnitude Response Derivative Functions (FTMDF). The Simulation methods and materials utilised are described in Section 5.
2 EEG Signal De-Noising
Due to very low in amplitude, EEG signals are prone to artifacts and noise [5, 6]. The noise could be generated by electrodes or by the body itself. The noises in EEG signals are known as artifacts, and these artefacts must be removed from the original signal in order to properly analyse EEG signals [7]. The artefacts in the EEG signals were removed using a variety of denoising techniques.
ICA denoising [8], PCA method of denoising [6], Wavelet based denoising [7], Wavelet packet based denoising, and so on are some of the approaches that can be used to remove noise. All of the following approaches can be used to denoise EEG signals, and their performance can be measured using measures such as MSE, MAE, SNR, PSNR, and NCC, among others. The aim of this study is limited to the removal of random noise only and the authors coming work concentrates on the artifact removal.
The authors of this work looked into the usage of first and second order Magnitude derivative functions derived from the Fourier Transform (FT) Magnitude response for EEG signal spectrum estimation. The utilisation of FT phase information from polluted EEG signals is exploited for EEG signal denoising. The proposed method’s findings are compared to those of the Fourier Transform and Wavelet Transform EEG signal enhancement methods. From the results presented here it is proved that this method reduces the spikes produced due to noise in the spectrum compared to Fourier Transform spectral estimation and to denoise the EEG signals in removing the random noise and for feature estimation of the EEG signal.
Using this strategy, the additive noise in the spectral estimate produced from a single realisation of the observation peak is considerably decreased. This method works even at extreme noise levels (SNR 0 dB or below).
3 Different EEG Signal Denoising Methods
The following is an overview of the numerous approaches for removing noise from EEG signals that can be implemented.
3.1 Denoising Based on Principle Component Analysis (PCA)
PCA is a mathematical approach for turning a set of correlated variables into a set of uncorrelated variables called principle components [6]. Eigen analysis is a method for determining the Eigen values and eigenvectors of a square symmetric matrix with sums of squares and cross products, which is used in PCA.
The eigenvector of the first main component points in the same direction as the eigenvector of the largest Eigen value. The eigenvector associated with the second highest Eigen value determines the direction of the second principal component. The sum of the Eigen values equals the trace of the square matrix, and the maximum number of eigenvectors equals the number of rows (or columns) in the matrix [7, 8].
Theoretically, PCA is described as an orthogonal linear transformation that turns data into a new coordinate system with the largest variance on the first coordinate (called the main principal component), the second greatest variance on the second coordinate, and so on [9, 10].
3.2 Denoising Based on ICA
The ICA method of denoising is another major method for denoising the EEG signal. Hyvarinen and his CO colleagues devised an ICA-based denoising approach [8, 11, 12]. The underlying justification for this method is that many signals’ ICA components are generally quite sparse, making it difficult to remove noise in the ICA domain.
3.3 De Noising Based on WAVELET
A time-limited oscillating vanishing wave with the ability to characterise the time-frequency plane with atoms of different time supports is referred to as a “wavelet” [8]. Wavelets are built with specific properties in mind that make them effective for signal processing in general.
They’re an excellent tool for analysing non-stationary or transitory occurrences [13–15]. Wavelet thresholding is used to split the signal into high and low frequency components. Based on the signal properties, a suitable threshold value is chosen. There are two thresholding methods: Hard Thresholding and Soft Thresholding, after which the wavelet that decomposes the sign is chosen.
Only low pass, or approximation coefficients, are subjected to the wavelet transform. The authors limit themselves to using Stationary Wavelets to denoise noisy EEG signals in this study, and compare the results to their suggested FT magnitude response derivative functions.
3.4 Denoising Based on WAVELETPACKET
Wavelet packets are linear wavelet combinations. They serve as the foundations, preserving many of the orthogonality, smoothness, and localization properties of their parent wavelets [16]. The coefficients are obtained by making the newly computed wavelet packet coefficient sequence the root of each analysis tree. The Wavelet Packet Transform is used on both detail and application data.
4 Fourier Transform Magnitude Response Derivative Functions (FTMDF) For EEG Signal Denoising
In this paper the authors have proposed the first and second order derivative functions of the magnitude response of the FT. The proposed methodology is applied for EEG signal spectrum estimation and EEG signal denoising. Using the proposed scheme, the enhancement of the EEG signals contaminated with random noise yields very good results in terms of the standard performance metrics.
The results obtained from the proposed method are compared with that of Fourier Transform and Wavelet Transform EEG signal enhancement methods. From the results presented here it is proved that this method suppresses the spikes generated due to noise in the spectrum compared to Fourier Transform spectral estimation and to denoise the EEG signals in removing random noise and for feature estimation of the EEG signal. Additive noise is significantly reduced even in the spectral estimate obtained using a single realization of the observation peak. This method works even for high noise levels (SNR 0 dB or less).
The goal is to investigate how the derivative functions of the magnitude response of the Fourier transform may be used to estimate spectrum and denoise the EEG signal. The presented approach is based on the I-Order and II-Order derivatives of the Fourier Transform magnitude response function, in the same way that spectrum estimation based on the properties of the negative derivative of the FT phase function, also called group delay function [17–19].
It is also demonstrated that, the I-Order and II-Order Derivatives of the magnitude response functions of the Fourier Transform can be used to denoise the noisy signal by exploiting the FT phase of the noisy signal. The proposed method will suppress the noise peaks of a high order and that indicates the proposed FT magnitude derivative functions yield high resolution properties.
The sharpness of the peaks [18] in spectrum estimation of the FT magnitude derivative functions is referred to as resolution. The Fourier Transform Magnitude Derivative Function (now called FTMDF) is an important feature that can help improve signal quality in noisy settings, according to the findings [20].
The requirement for a group delay function will be shown in many applications as a result of past research. Voice perception has now highlighted the importance of the phase of the speech signal [21, 22]. A new function called complex I-Order and II-Order Group delay spectrum estimation functions based on the derivatives of the FT phase has been proposed for spectrum estimation [23] and the Group delay estimations are successfully applied for sinusoids in noise to extract useful spectral information.
4.1 Fourier Transform Magnitude Derivative Functions (FTMDF)
The I-Order and II-Order FTMDFs are obtained by taking the I and II derivatives of the Magnitude response of the Discrete Time FT as presented below
| (1) |
X () is a function of magnitude and phase response and is expressed as:
| (2) | ||
The I-Order FTMDF and II-Order FTMDF are given by
| FTMDF-I | (3) | |
| FTMDF-II | (4) |
By considering the derivative of the magnitude response X(w) w.r.t frequency we get
| (5) |
Exploiting the properties of the FT and defining the derivatives we get
| (6) | ||
| (7) |
The Equation (5) becomes
| (8) |
Similarly the Second derivative of the FT magnitude function is derived by incorporating the similar arguments mentioned above and after some algebraic manipulations it is given as
| (9) |
here
| (10) | ||
| (11) |
where,
X Real part of the FT of x(n)
Y Real part of the FT of y(n) nx(n)
X Imaginary part of the FT of x(n)
Y Imaginary part of the FT of y(n) nx(n)
Z Real part of the FT of z(n) nx(n)
Z Imaginary part of the FT of z(n nx(n))
The denoised signal can be constructed back using the FTMDF-I and FTMDF-II functions in Equations (8) and (9) and using the FT phase. The phase selected in this work is the FT phase of the noisy signal under the assumption that the phase change for noisy and clean signal is negligible. Therefore the reconstructed signal will be the inverse FT and is given by
| (12) |
where
| (13) |
In Equation (13), is the magnitude response of the filter obtained from the FTMDF-I and FTMDF-II functions using equations Equations (8) and (9). is the FT phase response function of the noisy signal and is frequency measured in radians/sample and is given by.
| (14) |
For computational efficiency FT is evaluated for the discrete signal x (n) using FFT algorithm. Hence the transforms are given by, X(w) FFT [x(n)]; Y (w) FFT [y(n)]; Z(w) FFT [z(n)] and N is the DFT length satisfying the FFT algorithm. In evaluating the FTMDFs this work follows the cepstrum smoothing for the denominator terms of the magnitude response |X(w)|by taking log |X(w)|to avoid small values of the magnitude response [24] and to avoid large peaks in the derivative functions.
4.2 Simulation Model
The steps involved in the simulation model are presented below. A random noise signal, with different SNRs with respect to the simulated clean signal is added to for noisy simulated EEG signal. The amplitude and frequency levels of simulated signal are selected with frequencies 0.8 Hz, 6 Hz, 10 Hz, 24 Hz and four different amplitude levels 7 uV, 10 uV, 50 uV, 75 uV in accordance with the real EEG signal collected from data base from Bonn University. Noise SNR can be varied with 10 dB, 5 dB, 0 dB and 5 dB, to evaluate the performance metrics of the proposed methods. The enhanced EEG output of the proposed FTMDF-I and FTMDF-II methods is compared with the EEG signal Enhancement using SWT denoising procedure and presented in the Table 1. The step wise procedure to implement the proposed EEG signal Enhancement is presented below.
4.3 Step Wise Procedure
1. Generate the signal with four different frequencies and amplitudes in resemblance with the EEG signal containing the four wave forms
2. Generate the Gaussian random noise with known SNR as a function of the simulated signal in step-1.
3. Generate the noisy Simulated EEG signal using the signals generated in Step-1 and Step-2.
4. Denoise the signal generated in step-3 using Equations (8), (9) and Equations (2), (12).
5. Perform denoising using Stationary wavelet transform.
6. Compute the FTMDF-I, FTMDF-II and FT magnitude spectrums using Equation (8), (9) and with phase in Equation (2)
7. Compute the performance evaluation metrics viz MSE, MAE, SNR, PSNR and NCC.
8. Plot the Clean, Noisy and Denoised signals with different using the procedures in Step-4 and Step-5.
9. Plot the magnitude spectrums using the procedures in step-6.
10. Display the performance metrics for the above methods.
11. Repeat the above steps new SNR value of the Noise generation in step-2.
The above steps are repeated for the practical EEG signal by replacing step-1 with practical signal instead of simulated signal.
5 Methods and Materials
5.1 Database
To explore EEG signal denoising, the proposed work uses EEG recordings from Bonn University in Germany, which are available in the public domain [25–27]. The datasets are divided into five sets (A–E), each of which contains 100 single channel EEG segments. For 23.60 seconds, each segment has N 4096 sample points.
Entire EEG signals are documented with the same as one hundred twenty eight channel amplifier systems & twelve bit analog to digital resolution, which the sampling rate of the data was 173.61 Hz, & spectral bandwidth (BW) of the acquisition system is in between 0.5 to 85 Hz of frequency. All the selected segments are cut from the ceaseless multi-channel EEG recordings after visual inspection for artifacts like eye movements and muscle activity etc.
Set A and B are recorded when they are in normal state. Sets A and B have been recorded from external surface EEG recordings of 5 healthy people in the morning position with eyes open and closed states.
Set D was recorded in the epileptogenic zone, while set C was recorded in the opposite hemisphere of the brain’s hippocampal formation. During a seizure, Set E was recorded. The depth electrodes of EEG recordings from 5 unwell people were used to create sets C, D, and E. Sets A and B were recorded while in a normal state. EEG signal samples from five sets. The sample recordings of EEG signals obtained from five sets A–E using matlab program was seen in Figure.1 and the detailed explanation of the data sets are taken from the reference [25].
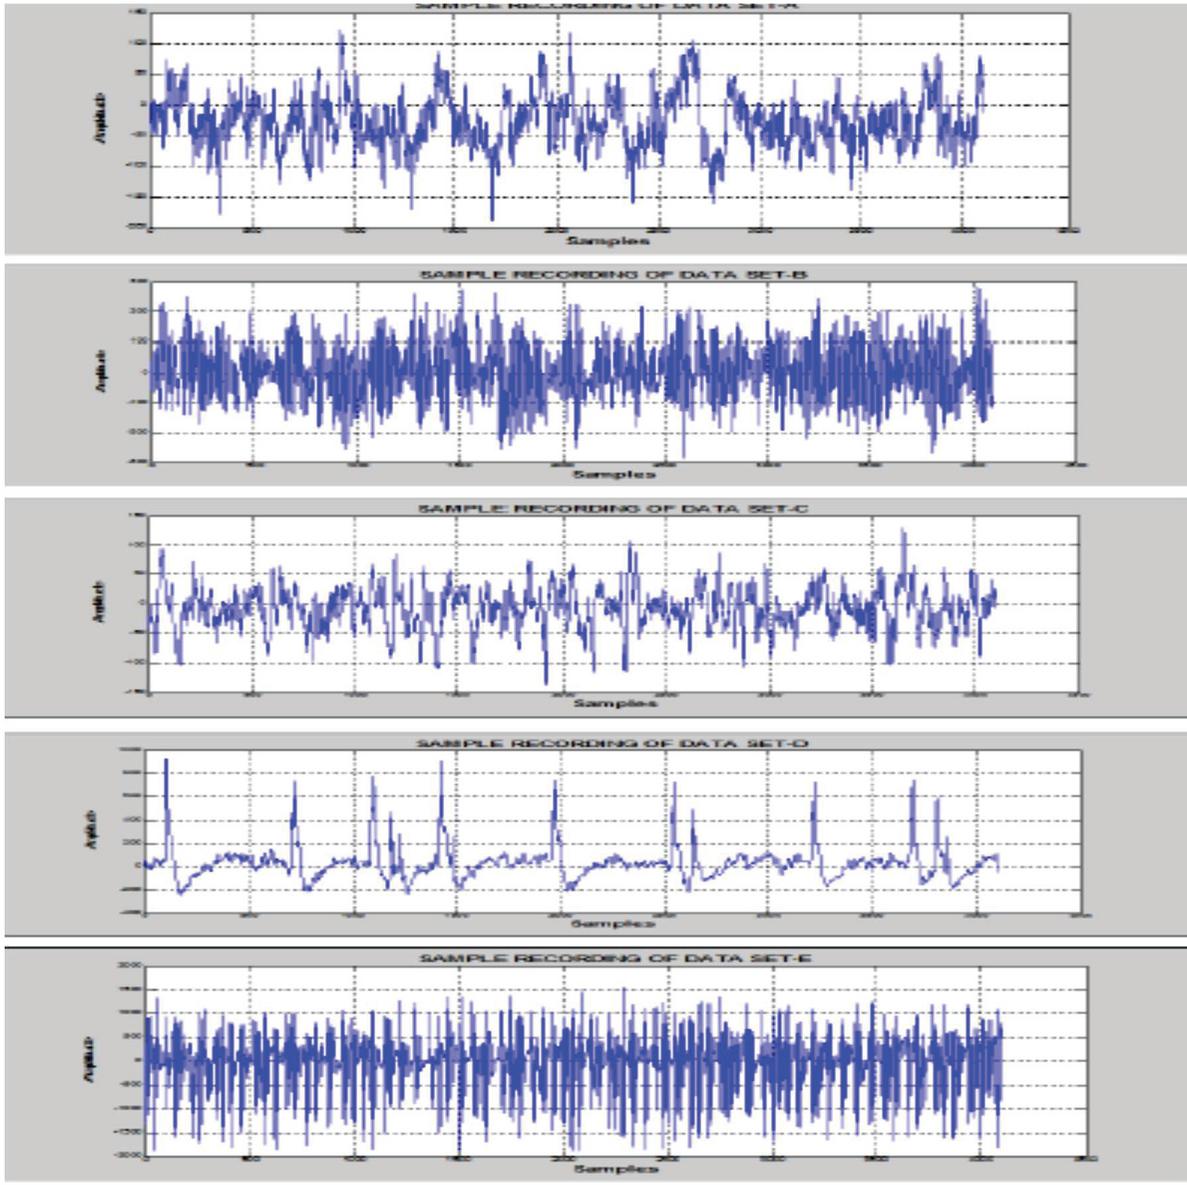
Figure 1 Sample Recordings of EEG Data Sets A, B, C, D and E.
Table 1 Simulated noisy EEG signal enhancement performance metrics
| Input Noise dB | Method | MSE | MAE | SNR dB | PSNR dB | NCC |
| 10 | FTMDF-I | 0.127 | 0.287 | 2.075 | 8.960 | 0.619 |
| FTMDF-II | 0.051 | 0.177 | 6.021 | 12.906 | 0.866 | |
| WAVELET | 0.130 | 0.294 | 1.962 | 8.848 | 0.637 | |
| 5 | FTMDF-I | 0.086 | 0.242 | 3.760 | 10.645 | 0.762 |
| FTMDF-II | 0.040 | 0.152 | 7.085 | 13.971 | 0.902 | |
| WAVELET | 0.117 | 0.280 | 2.443 | 9.328 | 0.730 | |
| 0 | FTMDF-I | 0.083 | 0.238 | 3.911 | 10.796 | 0.789 |
| FTMDF-II | 0.044 | 0.163 | 6.643 | 13.528 | 0.896 | |
| WAVELET | 0.121 | 0.284 | 2.285 | 9.170 | 0.769 | |
| 5 | FTMDF-I | 0.091 | 0.248 | 3.524 | 10.409 | 0.783 |
| FTMDF-II | 0.049 | 0.174 | 6.194 | 13.080 | 0.875 | |
| WAVELET | 0.139 | 0.303 | 1.682 | 8.568 | 0.781 |
Table 2 Real EEG signal enhancement performance metrics with 0-dB input noise
| Input Noise dB | Method | MSE | MAE | SNR dB | PSNR dB | NCC |
| SET-B | FTMDF-I | 0.046 | 0.170 | 3.385 | 13.274 | 0.756 |
| FTMDF-II | 0.130 | 0.289 | 1.093 | 8.797 | 0.572 | |
| WAVELET | 0.123 | 0.280 | 0.834 | 9.056 | 0.296 | |
| SET-C | FTMDF-I | 0.044 | 0.165 | 2.072 | 13.029 | 0.743 |
| FTMDF-II | 0.105 | 0.266 | 1.748 | 9.209 | 0.557 | |
| WAVELET | 0.045 | 0.164 | 1.950 | 12.907 | 0.694 | |
| SET-D | FTMDF-I | 0.034 | 0.147 | 1.629 | 14.741 | 0.689 |
| FTMDF-II | 0.045 | 0.171 | 2.946 | 13.425 | 0.685 | |
| WAVELET | 0.029 | 0.114 | 0.982 | 15.388 | 0.806 | |
| SET-E | FTMDF-I | 0.050 | 0.177 | 2.247 | 11.398 | 0.690 |
| FTMDF-II | 0.100 | 0.255 | 0.746 | 8.405 | 0.520 | |
| WAVELET | 0.149 | 0.303 | 2.508 | 6.643 | 0.226 |
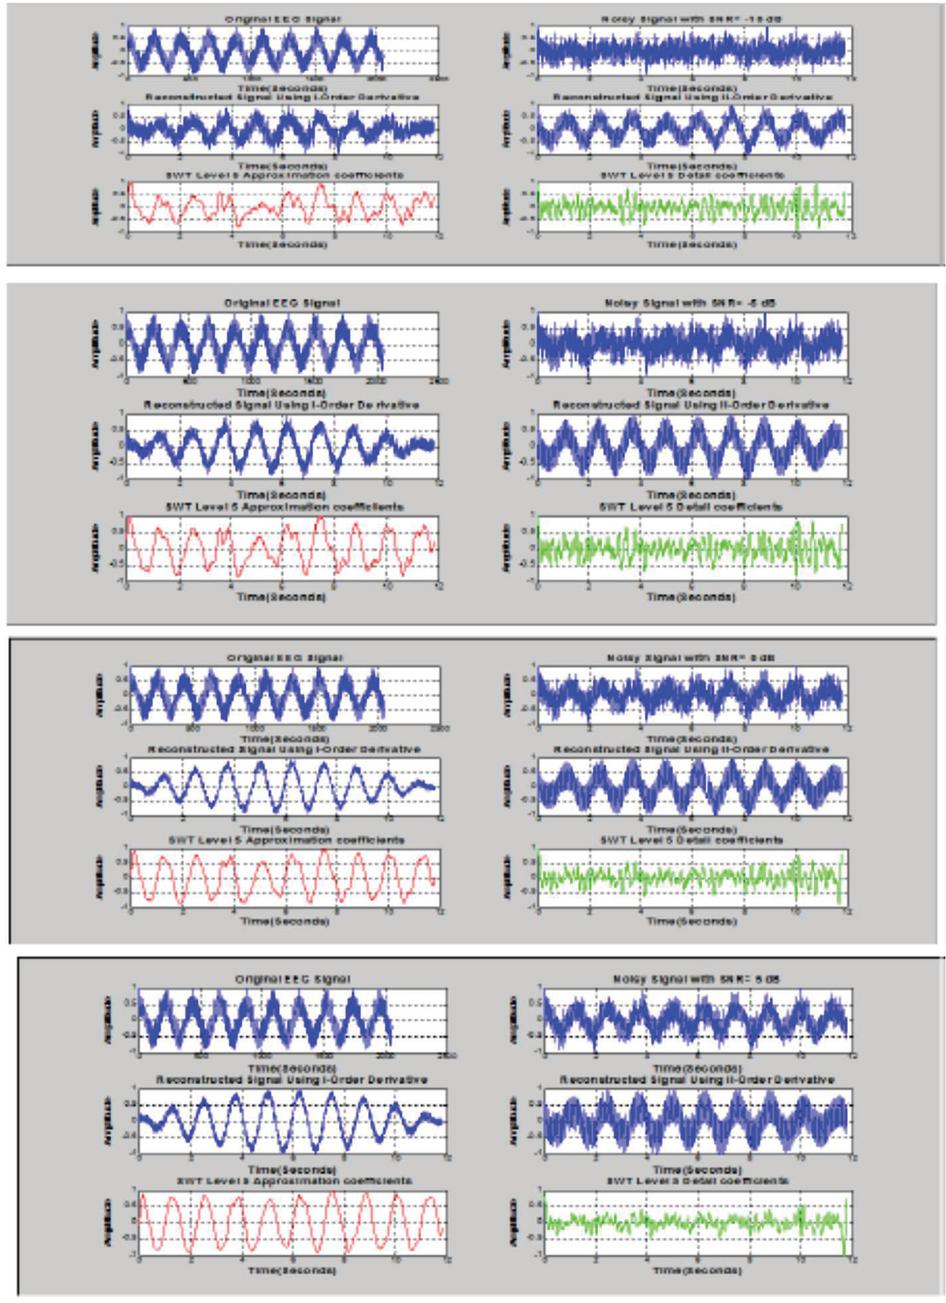
Figure 2 Enhanced Simulated EEG signal with input noises 10 dB, 5 dB, 0 dB, 5 dB and amplitudes of 7, 10, 50 and 75 v with frequencies f1 0.8; f2 6; f3 10; f4 24 Hz.
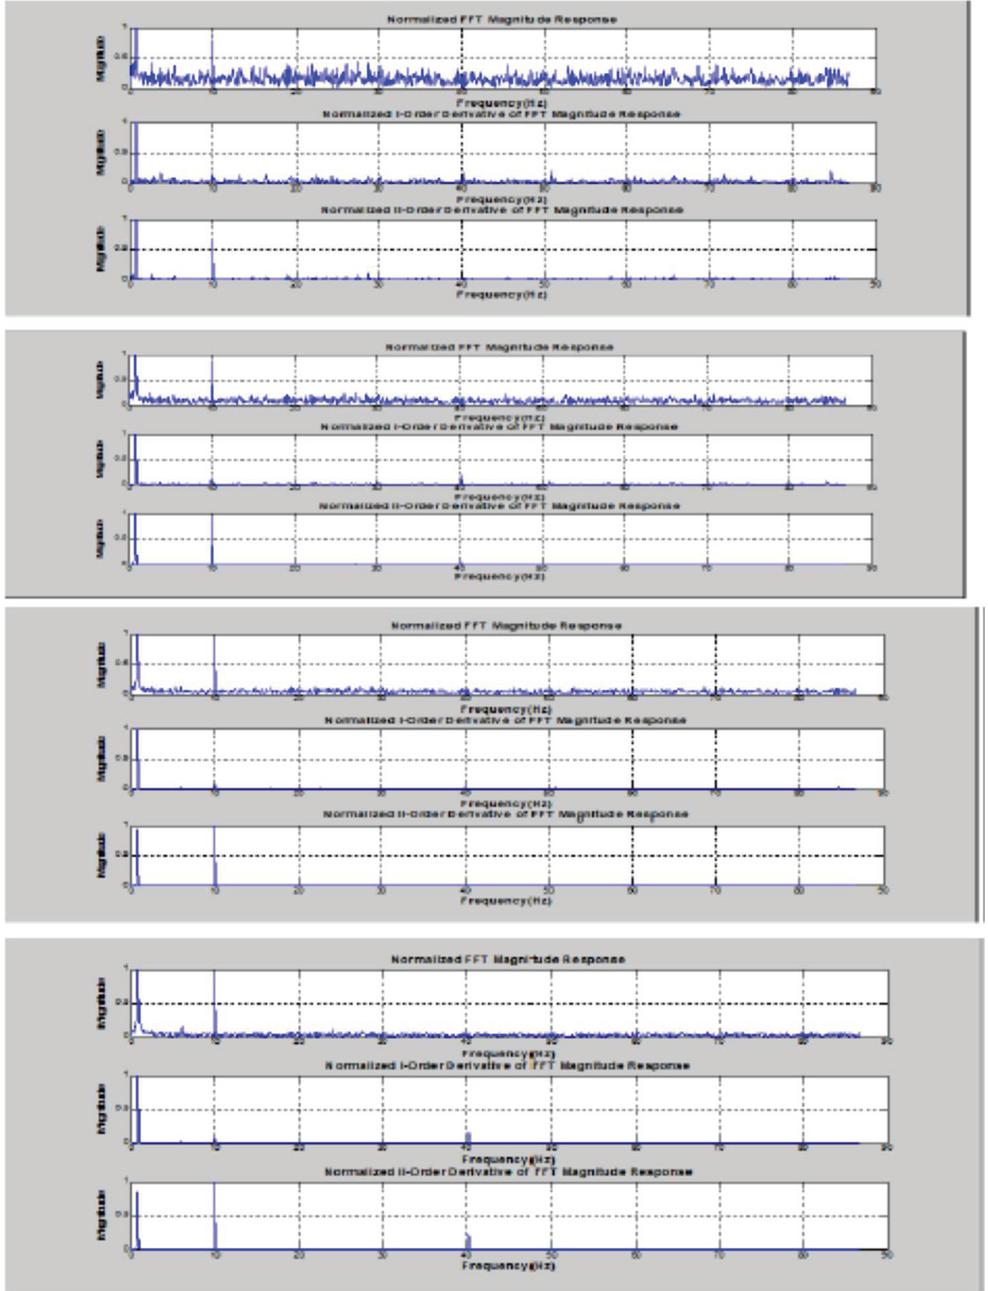
Figure 3 Enhanced simulated EEG signal magnitude spectral with input noises of 10 dB, 5 dB, 0 dB, 5 dB from top to bottom with amplitudes of 7, 10,50 and 75 v and frequencies f1 0.8, f2 6, f3 10, f4 24Hz.

Figure 4 EEG signal data sets B,C,D and E with 0 db noise.
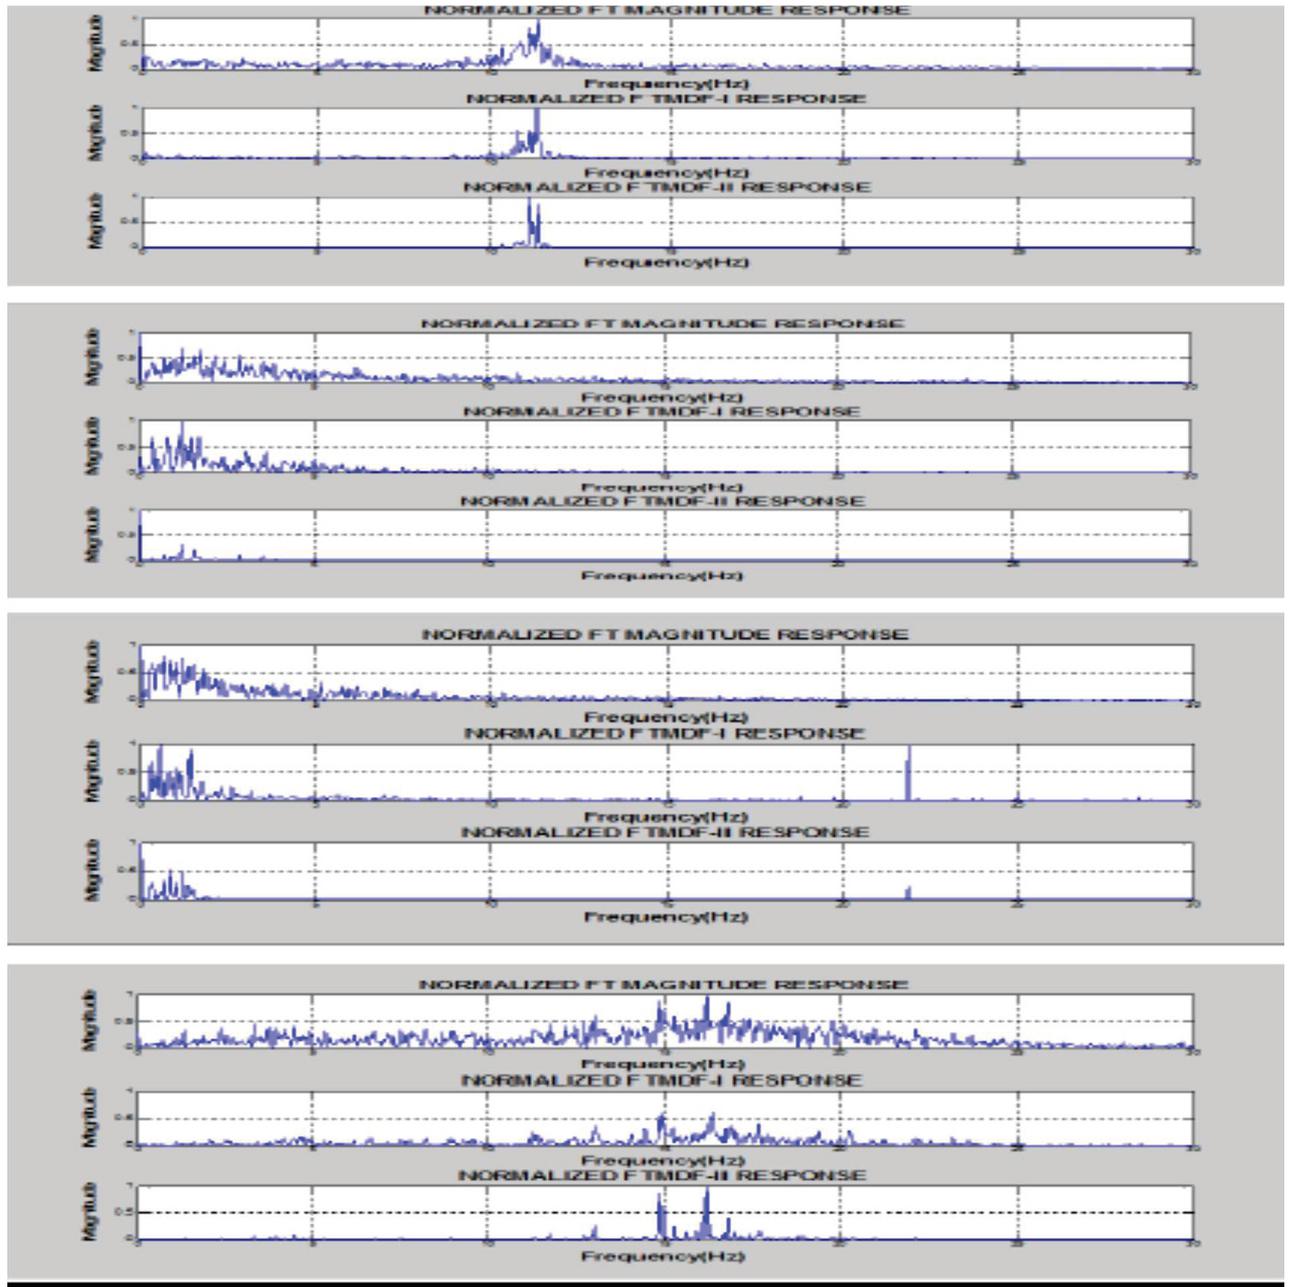
Figure 5 Real EEG signal from top to bottom B,C,D and E magnitude spectral with 0 db input noise.
5.2 Simulated and Real Data Results
The Simulation and raw data analysis using the proposed methods are implemented using MATLAB R2012a from Math Works. The simulated signal noisy signal is applied to the proposed algorithms FTMDF-I and FTMDF-II with different SNRs and tabulated in Table 1. The simulation results for the enhancement of EEG signal in terms of standard performance metrics using FTMDF-I, FTMDF-II are tabulated in Table 1 and Wavelet denoising schemes and Table 2 shows the results for the enhancement of real EEG signals using Datasets collected from Bonn University [25] shown in Figure 1. Standard performance metrics like MSE, MAE, SNR, Normalized Correlation Coefficient (NCC) & PSNR have been used for the analysis. From the Table 1 it is found that FTMDF-I and FTMDF-II algorithms outperforms compared with Wavelet method with an average SNRs improvements of 3.317 dB, 8.644 dB, and 2.791 dB respectively. The proposed FTMDF-I and FTMDF-II also outperform in the case of other metrics as presented in Table 1. In the case of real data this work adds the 0 dB random noise to the real data sets before applying the proposed FTMDF-I and FTMDF-II algorithms as described in the step wise procedure. Table 2 shows the outputs of the proposed algorithms.
From the Table 2 it is observed that the proposed methods show improvement when compared with Wavelet based denoising method but the improvement is limited in the case of FTMDF-II. The reason may be inferred that, this work concentrates only on the removal of random noise in the signal but not on the artifact removal. Figures 2 and 3 presents the simulated denoised signal and the spectra produced using the proposed methods. From the Figure 2 it is observed that the proposed methods produced the denoised signal which is comparable with the clean signal. From the Figure 3 it is observed that the spectra obtained using the proposed methods have been compared with the spectrum produced with Fourier Transform. The Spectra produce with the proposed schemes are very clean when compared with the FT spectrum which is very much useful in feature identification and extraction. Similar observation can be made to the real data spectra presented in the Figures 4 and 5.
6 Conclusion
Two denoising methods have been proposed for EEG denoising and spectrum estimation. The signals were denoised using the proposed algorithms FTMDF-I and FTMDF-II and for comparison Wavelet method is used. The signals with higher PSNR, SNR & low MSE are less noisy signals. The various evaluation metrics like MSE, MAE, SNR, PSNR, and NCC of the proposed FTMDF-I and FTMDF-II yield very good results and are bitterly used to denoise the EEG signals and to estimate the features of EEG signals.
References
[1] E. Tamil, et al. “Electroencephalogram (EEG) Brain Wave Feature Extraction Using Short Time Fourier Transform”, Faculty of Computer Science and Information Technology, University of Malaya, 2007.
[2] A. Frédéric, K Nizar, B. Khalifa, B. Hedi, “Supervised Neuronal Approaches For Eeg Signa Classification: Experimental Studies”.
[3] B. Liu, M. Wang, L. Yu, Z. Liu, H. Yu, “Study of Feature Classification Methods in BCI Based on Neural Networks”, In Proceedings of the 2005 IEEE Engineering in Medicine and Biology 27th Annual Conference, Shanghai, China, September 1–4, 2005.
[4] S. Sanei and J. Chambers, “EEG Signal Processing”, John Wiley & Sons Ltd, The Atrium, Southern Gate, Chichester, Chichester, West Sussex PO19 8SQ, England, ISBN-13 978-0-470-02581-9, 2007.
[5] Mrs V Baby Deepa, Dr P Thangaraj, Dr S Chitra, Investigating the performance improvement by sampling techniques in EEG data, International Journal on Computer Science and Engineering, Vol. 2, Jun. 2010, pp. 2025–2028.
[6] Dong Kang, Luo Zhizeng, A Method of Denoising Multi-channel EEG Signals Fast Based on PCA and DEBSS Algorithm, Computer Science and Electronics Engineering (ICCSEE), 2012 International Conference on, vol. 3, no., pp. 322–326, 23–25 March 2012.
[7] Lanlan Yu, EEG De-Noising Based on Wavelet Transformation, Bioinformatics and Biomedical Engineering, 2009. ICBBE 2009. 3rd International Conference, vol., no., pp. 1–4, 11–13 June 2009.
[8] Priyanka Khatwani, Archana Tiwari, “A survey on different noise removal techniques of EEG signals”, International Journal of Advanced Research in Computer and Communication Engineering, Vol. 2, Issue 2, February 2013, pp. 1091–1095.
[9] P. Ashok Babu, Removal of ocular artifacts from EEG signals using adaptive threshold PCA and Wavelet Transforms, International Journal of Electronic Signals and Systems, vol. 1, 2012.
[10] Juha Karhunen, Jyrki Joutsens, Generalization of principal component analysis optimization problems and Neural Network, Vol. 8, pp. 549–562, March, 1995.
[11] Janett Walters-Williams, and Yan Li, BMICA-Independent Component Analysis Based on B-Spline Mutual Information Estimation for EEG Signals, Canadian Journal on Biomedical Engineering & Technology, Vol. 3, No. 4, pp. 63–79, May 2012.
[12] Janett Walters-Williams & Yan Li, A New Approach to Denoising EEG Signals – Merger of Translation Invariant Wavelet and ICA, International Journal of Biometrics and Bioinformatics Volume (5): Issue (2): 2011.
[13] Kalpakam, N.V., Venkataramanan, S., Haar wavelet decomposition of EEG signal for ocular artifact de-noising: a mathematical analysis, Circuits and Systems, 2004. NEWCAS 2004. The 2nd Annual IEEE Northeast Workshop on, vol., no., pp. 141–144, 20–23 June 2004.
[14] Suyi Li, Comparisons of wavelet packet, lifting wavelet and stationary wavelet transform for de-noising ECG, Computer Science and Information Technology, ICCSIT 2009. 2nd IEEE International Conference, pp. 491–494, 8–11 Aug. 2009.
[15] S. Mallat, A theory for multiresolution signal decomposition: the wavelet representation, IEEE Trans. PAMI, vol. 11, pp. 674–693, 1989.
[16] V.V.K.D.V. Prasad et al., “A New Wavelet Packet Based Method for Denoising of Biological Signals,” International Journal of Research in Computer and Communication Technology, vol. 2, issue 10, pp. 1056–1062, October 2013.
[17] B. Yegnanarayana and Hema A. Murthy “Significance of Group DelayFunctions in Spectrum Estimation” IEEE Transactions on signal processing. Vol. 40, No. 9, pp. 2281–2289, September 1992.
[18] B. Yegnanarayana, “Formant extraction from linear prediction phase spectra,” J. Acoust. Soc. Amer., vol. 63, pp. 1638–1640, May 1978.
[19] Rajesh M. Hegde, Hema A. Murthy and Venkata Rmana Rao Gadde “Significance of joint Features Derived from the Modified Group Delay Function in Speech Processing”, EURASIP Journal on Audio, Speech and Music Processing, vol. 2007, Article ID 79032, pp. 1–12.
[20] Abbasian Ali, Marvi Hossien (2009), “The phase spectra based feature for robust speech recognition”, The annals of “Dunarea De jobs” University of Galati fasclcle III, Vol. 32, No. 1, pp. 60–65.
[21] K. K. Paliwal and L. D. Alsteris, “Usefulness of phase spectrum in human speech perception,” in Proc. Eurospeech, Geneva, Switzerland, Sep. 2003.
[22] B. Bozkurt and L. Couvreur (2005), “On the use of phase information for speech recognition,” in Proc. USIPCO, Antalya, Turkey.
[23] K. Nagi Reddy, et.al. “Significance of Complex Group Delay Functions in Spectrum Estimation”, Signal & Image Processing : An International Journal (SIPIJ) Vol. 2, No. 1, March 2011, pp. 114–133, DOI: 10.5121/sipij.2011.2109 114.
[24] Hema A. Murthy and B. Yegnanarayana, “Group delay functions and its applications in speech technology”, Sadhana, Vol. 36, Part 5, October 2011, pp. 745–782, Indian Academy of Sciences.
[25] R. G. Andrzejak, K. Lehnertz, F. Mormann, C. Rieke, P. David, and C. E. Elger. Indications of nonlinear deterministic and finite dimensional structures in time series of brain electrical activity: Dependence on recording region and brain state. Physical Review E, vol. 64, (2001). Available: http://epileptologie-bonn.de
[26] Xu, Jiacan, et al. “Recognition of EEG signal motor imagery intention based on deep multi-view feature learning.” Sensors, 20.12 (2020):3496.
[27] Hosseini, Mohammad-Parsa, Amin Hosseini, and Kiarash Ahi. “A Review on machine learning for EEG Signal processing in bioengineering.” IEEE reviews in biomedical engineering 14 (2020):204–218.
Biographies

Devulapalli Shyam Prasad is an Senior Assistant Professor working in CVR College of Engineering, Hyderabad and having 20 years of teaching experience. Doing research work in JNTUK, Kakinada. Specialization in Instrumentation and Control Systems. EMI Filters for Power Line Applications is the book published.
Dr. Srinivasa Rao Chanamallu Experienced Professor with a demonstrated history of working in the education management industry, Dept of ECE, University College of Engineering Vizianagaram, Jawaharlal Nehru technological university Kakinada, Vizianagaram, Andhra Pradesh. He is a fellow of IETE and member of CSI.

Prof. Kodati Satya Prasad experienced Professor with a demonstrated history of working in the education management industry. Skilled in Research, Digital Signal Processing, Teaching, Higher Education, and Curriculum Development. Strong education professional graduated from PNR ZP High School, kaja; JNTUCE, Anantapur, Guindy college, IIT Madras. Worked in different Institutions, REC Warangal, JNT University Kakinada, Hyderabad and Anantapur andd later in JNTUK. Member of Professional bodies and actively involved in the activities by becoming executive member.Authored four text books. Achieved different awards and effectively developed and implemented various methods and programs in college and University. After retirement from JNTUK service, performed duties as Pro VICE CHANCELLOR of Koneru Lakshmaiah Education Foundation (Deemed to be University). Presently working as Professor and Rector, Vignans Foundation of Science, Technology & Research, Guntur, A.P.
Journal of Mobile Multimedia, Vol. 18_2, 231–250.
doi: 10.13052/jmm1550-4646.1824
© 2021 River Publishers