Paddy Plant Disease Recognition, Risk Analysis, and Classification Using Deep Convolution Neuro-Fuzzy Network
V. Vinoth Kumar1,*, K. M. Karthick Raghunath2, N. Rajesh3, Muthukumaran Venkatesan4, Rose Bindu Joseph5 and N. Thillaiarasu6
1School of Computer Science and Engineering, Jain (Deemed to be University), Bangalore, India
2Department of Computer Science and Engineering, MVJ College of Engineering, Bangalore, India
3University of Technology and Applied Science, Shinas, Sultanate of Oman
4Department of mathematics, School of Applied Sciences, REVA University, Bengaluru, Karnataka
5Department of Mathematics at Christ Academy Institute for Advanced Studies, Bangalore, India
6School of Computing and Information Technology, REVA University, Bengaluru, India
E-mail: drvinothkumar03@gmail.com
*Corresponding Author
Received 16 June 2021; Accepted 21 August 2021; Publication 29 October 2021
Abstract
A significant number of the world’s population is dependent on rice for survival. In addition to sugarcane and corn, rice is said to be the third most growing staple food in the world. As a consequence of intensive usage of man-made fertilizers, paddy plant diseases have also risen at a faster pace in current history. Exploring the possible disease spread and classifying to detect the consequent impact at an early stage will prevent the loss and improve rice production. The core task of this research is to recognize and quantify different kinds of infections (disease) affecting the paddy plant crop, such as brown spots, bacterial blight, and leaf blasts. Both detection and recognition are carried out based on the risk analysis of paddy crop leaf images. We suggest a Deep Convolutional Neuro-Fuzzy Method (DCNFM) that combines one of the advanced machine learning variant, namely deep convolutional neural networks (DCNNs) and uncertainty handler called fuzzy logic. The synthesis has the benefits of both fuzzy logic and DCNNs when dealing with unstructured data, extracting essential features from imprecise and ambiguous datasets. From the crop field, continuous image data are captured through image sensors and fed as a primary input to the proposed model to analyze the risk and then later to classify them for precise recognition/detection of the disease. The detection/recognition rate of the DCNFM is found to be 98.17% which is comparatively found to be effective in comparison with the traditional CNN model.
Keywords: Convolution neuro-fuzzy, paddy, accuracy, disease classification, bronzing, crown rot, blast, head blight.
1 Introduction
Paddy cultivation is the lifeblood of the most developed and developing nation and should be prioritized before any other significant area. Paddy production faces several problems, particularly land scarcity and labor shortfalls, financial difficulties through various factors like globalization and; and global pollution such as climate change. When the world’s population is projected to rise at the current pace, the world rice supply would have to double. One major primary cause of failure in this segment is crop infection. Thus, in this article, a novel solution to significant and associated plant disease in the main traditional paddy crop is nominated. It is challenging to track vast areas of crops throughout the cultivation period, even also with an advanced automation system, due to their large scale. Hence, we put forward the Deep Convolutional Neuro-Fuzzy Method (DCNFM) for disease detection, risk assessment, and categorizing/labeling the affected crops.
Deep Learning (DL) has developed exponentially in the field of recognition, risk estimation, and classification. Its expansion has the potential to increase the perfection of image recognition and classification accuracy significantly. Convolutional Neural Networks (CNNs) is a widely used Deep Learning (DL) model that facilitates accurate, robust, and practical feature learning from large amounts of data. They use a large number of samples to derive elevated abstraction (high-level) from a limited/constrained data level. When there is an abundance of high-quality training results, computation efficiency and the precision ratio can be significantly enhanced. Furthermore, in an automatic mode, CNN has the capability to retrieve feature maps based on the relationship between training and test results. However, information may be unclear or contradictory due to a lack of detail or inconsistency in the source data, commonly referred to as data uncertainty [2]. Whenever there is insufficient information, transfer learning is used to direct the system through thorough training. Feature representative is then passed to the model after pre-training with distinct but interrelated and appropriate data. Pre-training the algorithm will dramatically reduce training data since the concerned neural network already contains the learned and systematical kernel. As a result, transfer learning also necessitates details relevant to the data sources. A lack of appropriate data can cause neural networks to function poorly or perhaps even deliver subpar results.
The problem of the neural network is that it does not often closely resemble human thought and perception [15], while fuzzy logic is effective in human reasoning and modeling. Mathematically, fuzzy logic may be used to compute the uncertain datasets irrespective of acquired knowledge which may not be clear. The computations are carried out by utilizing non-standard representations of the concept of linguistic labels, degree of membership mapped to the degree of reality [1]. The laws (rules) and the interpretability of fuzzy attributes make it simple in the extraction of essential feature sets more like humane interpretations. As a matter of reality, there is no learning potential and, and thus most of the application of laws in fuzzy schemes are derived through human expertness. Fuzzy laws (rules) can be instantly learned from vast amounts of training data by integrating with neural networks.
According to this theory, we recommend a new Deep Convolution-Neuro-Fuzzy Model (DCNFM) in which Fuzzy logic is linked to deep CNN. The convergence of fuzzy logic and deep CNNs enables the extraction of beneficial high-level functionality from unclear details of the data source [7, 9]. Traditional CNNs use completely linked neural networks to summarize the knowledge contained in function maps. To improve the capacity of the CNN to estimate the optimal hypothesis function, we combine with core concepts of fuzzy logic rather than a completely linked neural network. The outstanding feature generator and the non-linear approximator can be utilized to improve the precision rate while testing. With the exception of the network performance, CNNs middle-layer depictions are mostly incomprehensible, but in this article, we are involved in visualizing, demonstrating, and analyzing deep learning models, and hence our priority is on explaining how smart objects/agents can justify their decisions about paddy crop disease identification, risk assessments, and classification.
2 Related Work
SVM-Support Vector Machine, BPNN-Back-Propagation neural network as shown in the study of [12] were found to be the principal mechanism used to detect paddy crop disease, besides these, SGDM-Spatial Gray-level Dependency Matrices, KNN-K-nearest neighbor, and CNN-Convolution Neural Network are utilized for disease detection as shown in the research of [21].
The CNN methods were used in [3] to study the stable and infected leaves of the plant. To distinguish the crops infected by the disease, images of healthy and affected leaves of the plants are combinedly collected. The essential features are extracted from the retrieved leaf pictures. Finally, the framework is then developed using the deep learning method, and leaves are checked to see which leaves are being impacted.
The research work described in [4] uses Content-based affected paddy leaf image detection and counteraction unit upon diagnosing paddy disease by the support vector machine classification. Here, suggestions are made which can aid farmers and associated industries in detecting and controlling the infections.
The general framework of DL for object detection was first suggested by [19]. An extremely advanced DL algorithm, CNN, was contrasted against an original function (feature) representation and researched their relative effectiveness for classifying and comparing instances. Besides, they investigated the practical uses of CNNs in identifying and retrieving concerns, which had proved helpful in our studies.
The study from [5] depicted a design of a DL robot which is utilized to identify disease that affected especially the leaves and other parts of the tomato plants. The focus of this project was on constantly operating DL algorithms in robots for agricultural use. The RGB cameras mounted on the robot take images in real-time, and on utilizing DL models, use them to scan for disease prevalence. A dataset on tomato leaves has been used to train a DL model, and those datasets are extracted from the village plant internet site.
An elaborated CNN model [16], which aimed to find the disease, determined both plant disease and health status of apple and tomato leaves. An improved SVM classifier is taken into consideration for the optimal disease detection process. This prototype also incorporated sigmoid formulation and more dense layers for greater precision. Drop-outs values of 0.2 have been applied to minimize the overfitting issue. As a consequence of these efforts, the model reached an 87 percent accuracy rating. The CNN was preferred based on their research outcomes, which is more successful than SVM in classifying the effects.
Authors in [11] developed a solution that incorporates machine learning and image processing techniques for utilization in the diagnosis of potato leaves-based diseases. The site “plant image” is freely accessible and supplies information about various diseases, making it possible to use an automatic tool that categorizes infections from it. The combined methodological actions like segmentation and technical process of SVM produce an accuracy of 95 percent on diagnosing the disease.
The research work [14] suggested a project to differentiate evidence and regulation of the three diseases of cotton leaves, in specific Bacterial Blight, Alternaria, Myrothecium. Segmentation of images is carried out using the model of complex form. Hu’s versatile neuro-fuzzy derivation is employed to make up the versatile planning process. Finally, the accuracy of the model arrangement is 85%.
The author from [20] has addressed the problem of identifying cotton leaf diseases by the use of the nearest neighbor classification technique and PCA (Principal Component Analysis). It contains diseases such as Nacrosis, Blight, Magnesium inadequacy, Alternaria, and Gray Mildew. The accuracy of characterization and classification is found as 95%.
The study [18] implemented a new technique for robust and early detection of Cercospora plant leaves spot in sugarcane (common beet) using the hybrid template mapping SVM algorithm. This method is practical and realistic to identify and persistently quantify in standard bright sunlight conditions before schedules. Often it’s challenging to recognize the fact that the external environment is changing unpredictably.
The work from [8] has been applied to a convenient application to identify paddy plant disease using the probabilistic classification of the neural system and fuzzy entropy, which is still operational with Android’s versatility framework. This technique has been applied to various diseases such as leaf blight, tungro, leaf blast, and brown spot. The accuracy of paddy disease on distinguishing evidence is recorded as 91.46%) From [22], the authors examine rice carrying capacity and sustainable rice production. Concerning the resources-limited regions, authors ought to explore the rice carrying capacity as well as the degree to which natural resources affect the production of rice plants.
3 Risk Analysis of Disease Affected Paddy Plants
In rice crops, the infection is described as any deterioration of the essential biological functions of plants that produces specific symptoms. An asymptomatic and symptomatic sign is a particular instance of anything and might be used to prove the reality of that phenomenon. A disease may be caused by an infection, regardless of its identity. Plants exhibit symptoms almost on the plant’s leaves or branches. Paddy crop farming is enhanced by identifying the plant’s leaves, branches, locating the infections, and diagnosing the level of percentages of disease incidence, symptoms, and its progression. Four major common paddy plant diseases are considered and needed to be classified through our proposed system is elaborately discussed in the upcoming section.
3.1 Bronzing
Bronze pigmented by nutritional deficiencies, reliance upon pests, chemical products, ecological or illness factors. Most parts of the bronze-affected leaves are often smaller, and the affected parts cannot photosynthesize.

Figure 1 Bronzing in paddy crop.
3.2 Crown Rot
It is hypothesized that bacterial infection (scientific name: Erwinia chrysanthemi) may induce foot rot of paddy plants, which is rarely detected. The roots are likewise dark black and die as soon as infected, and the node well above the cap region is irregular in shape.

Figure 2 Foot rot in paddy plant.
3.3 Blast
Magnaporthe oryzae fungus causes blast disease in paddy plants. Top portions of crops, including leaves, panicle sections, nodes, necks, collars, and leaf sheaths, may be affected. Anywhere blast particles (spores) exist, blast might emerge.

Figure 3 Leaves and node blast in paddy plant.
3.4 Head Blight
A Scab or Head Blight is a fungal infection that attacks paddies and various crops. Infected heads of grain are prematurely dying and bleaching. All the corresponding pictorial sample of each diseases are depicted from Figures 1 to 4 respectively. The whole head may perish if diseases strike on the branch underneath the head. A DCNFM model has been proposed to forecast the signs of all four concerning infections in rice plants. Numerous images of concerned paddy crop disease are utilized to build the model. The training is conducted so that it will likely provide an accurate model that predicts the outcome as either a healthy crop or a damaged crop.

Figure 4 Head blight in paddy plant.
4 Proposed DCNFM
Each part of the paddy plant image (leaf) is captured using the CMOS Photographic Detector. Then, the Gabor function [10] is employed to extract various features. In this proposal, a distinct feature-oriented filtration block with alignment vector production intensity was utilized. Therefore, the direction values 000, 475, 950, and 1450 are obtained. By translating each color pixel of RGB (Red, Green, and Blue) to HSI (Hue, Saturation, and Intensity) format, color characteristics were retrieved. Both tone and direction functions are filtered down to minimize computing overhead. Seven vectors for every frame picture frame is considered, including three pictures of HSI format and four-vectors of different position. The ultimate input characteristics consist of the 32-bin distribution, calculating all seven identity frame channels (orientation correlates to four channels, and the pixel values belong to three image channels). Table 1 shows the layout and precise configurations of DCNFM hyper-parameters as well as other comparable models, especially to analyze the picture obtained.
Table 1 DCNFM and Traditional CNN parameters
 |
The framework of the system, DCNFM, is built on the standard, convolutionary layer of CNN that is completely connected. Typically, every convolutionary layer involves a convergence phase, accompanied by a non-linearity phase, and ultimately a concentration (pooling) phase. The proposed DCNFM’s conceptual structure, consisting of three levels, that is depicted in Figure 5. The first part of the method, includes fuzzification, converts the original data into a perfect fuzzy representation. Subsequently, it’s a more convoluted through computationally intensive representation in the Fuzzy Convolution (FC) layer, thereby necessitating use of fuzzified kernels. Fuzzification (convolution) is a minimalistic interpolation that minimally distorts initial patterns and maximally smooth outputs (min-max regression) with optimal local features. The primary advantage of every min-max layout extraction is that it extracts more complex spatial feature minima from its spatial input. The generated extracted features of these convolution levels are extremely hypothetical in the fuzzy realm due to adding the series of fuzzy convolutions. The defuzzification layer extracts crisp output from pooled features. Eventually, the DCNFM Output Classifier is a completely linked layer.
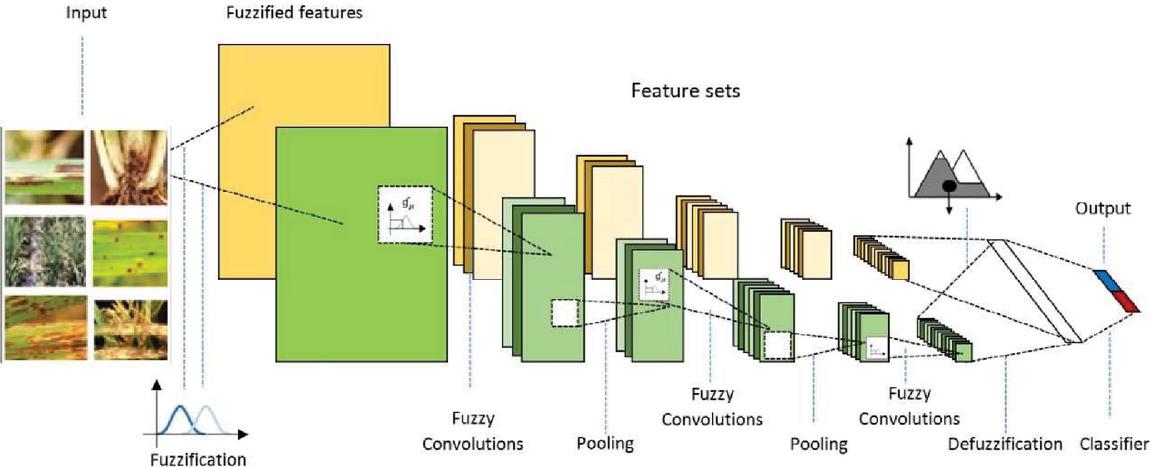
Figure 5 DCNFM’s conceptual structure.
If T is the input vector, several linguistic labels for Membership Functions (MF) are allocated to each variable in T. The Fuzzy membership measures the rank of a certain fuzzy set which defines the membership and composition of an input source. Equation (1) represents the fuzzy set, derived by the fuzzy relationship, represented in Equation (2), which is further computed using the max-() functioning. This is predicated on the likelihood that the provided data (both input and output) correspond to the user-defined cited fuzzy numbers, stated as from the UoD (Universe of Discourse).
| (1) |
Where, i and j are the elements’ indices (t) in the reference vector T.
| (2) |
Where denotes the delta (kronecker) function.
Three processing phases occur within each FC layer:
• Fuzzy-based convolution phase,
• Non-linearity phase, and
• Pooling and Defuzzification phase.
4.1 Fuzzy-based Convolution Phase
The fuzzy-based Convolution phase is a process in which fuzzy-based convolutionary filtering (), is measured in Equation (3) and utilized on two-dimensional information which is expressed as,
| (3) | ||
| (4) |
4.1.1 Non-linearity phase
A non-linear conversion modifies the linear connections among variables (gains or reduces), altering their correlation. Non-linear trajectories could be changed into numerous linear forms. The LST technique uses line segments connecting two nearby data points to approximate a fuzzy set. Binning is applied mainly on binned vector, and the LST transition is performed to it. The parameters were all initialized with different starting values as well as a result was found via solver. A non-linear conversion of the resulting outcome from the soft convolution steps is presented in Equation (5).
4.1.2 Pooling and defuzzification phase
Upon completing the Feature Extraction (FE) process, the final stage is a vital procedure known as pooling (e.g., maximum accumulation), which provides short-termed required statistical results on nearby findings. This state constrains the translation invariance of the representation into a perfect input and simultaneously minimizes the amount of the intake source for the following Convolutional Fuzzy Layer (CFL).
| (5) |
Here, in Equation (5), -denotes the activation functions of CFL. The perfectly integrated structure of the DCNFM functions as a classification system, Here, the input features are crisp value (v), which is derived from the defuzzifying process using the Centroid of Area (CoA) approach represented in Equation (6).
| (6) | ||
| (7) |
From (7), denotes the center point of the Membership Function in the defuzzification process (DMF), L represents the sub-layers and from (4.7), represents the perfectly integrated v (final classifier outcome). The log loss () is used to assess how a constructed classifier performs (also called cross-entropy loss). The loss of cross-entropy rises when the expected likelihood differs from the current identifier which is expressed in Equation (8).
| (8) |
From (8), N represents the classes, denote the binary indication (zero or one) wherein class, c may be the appropriate witness categorization, o, whereas is the predicted observation probability o is always of class c.
Table 2 Algorithm of DCNFM

The class labels are learned through model parameters and traditional back – propagation procedure on utilizing the log loss function. DCNFM training process algorithm is described in Table 2. We used a compact instructional technique to identify the optimum parameters for the DCNFM on the supplied training sample, using the selected feature ‘T’ and target ‘u’. Hyper-parameters like learning rates, dropout rate, and batch size are determined from empirical evidence (experiment and observation), and all the essential mathematical expressions are cited from [13].
5 Discussion on Experimental Outcomes
DCNFM is a type of fuzzy fusion neural network that will alter the network’s features to lower the optimization problem concerning cost functions. These approaches effectively identify pictures, classify images, discover objects, and parsing standard language. A different set of captured images of the paddy plant are trained and tested to evaluate the algorithm. To establish a benchmark and do a comparative analysis, we use conventional CNNs and other existing methods with the same structural and computational complexity. The traditional CNN is modified to make it more appropriate for usage. We almost trained the datasets with the same hyper-parameters (Learning rate, pooling probabilities, dropout, and layer size) to evaluate the model’s effectiveness compared to the benchmark technique.
Spatial characteristic vectors of seven features from each infected identified image will be retrieved throughout the training period and supplied to the DCNFM model as the primary input. The seven characteristics include location on the picture (in all possible directions: X and Y position), scaling grade, feature size, flag border, image curvature via scaling space, and image orientation. Training takes place on an average with seven characteristics for each classified disease. However, the number of critical points might vary and relies on the captured image’s intricacy. The obtained model’s parameters are highly transferrable. For training purpose, instead of assigning new weights which can handle severe issues, pre-determined weights that were previously learned on a different problem are utilized.
When it comes to all training operations, the total count of epochs is set to be 100. The following are specified as the assessments criteria (Accuracy, Recall, precision, and f1-score) [17]:
Accuracy (A): It is possible to determine accuracy using the Confusion matrix. An evaluation method that is intuitively understood is accuracy [6]. Accuracy is defined as the overall ratio of appropriately predicted outcomes to all total numbers of data. Using the Equation (9), we can see how to calculate essential accuracy. In a dataset, improved accuracy is only attainable whenever false negative and false positives are almost the same.
| (9) |
Precision (P): The number of accurately predicted absolute potential values compared to the total amount of positive values (predicted) obtained is known as the precision evaluation of the corresponding algorithms. It may be calculated using Equation (10).
| (10) |
Recall (R): From the confusion matrix, the recall is the percentage of projected positive values which are equal to the number of actual positive values. The Equation (11) shows the computed recall function.
| (11) |
F1-Score: F1-Score is referred to as Recall and Precision’s balanced average value. For this reason, both false negative and positive values are included in this score [6]. The F1-score is formulated in Equation (12).
| (12) |
This research has been performed with four distinct algorithms to categorize and identify the plant disease depicted in Table 3. In this study examining the proposed algorithms, it is discovered that the DCNFM had performed with higher (A), at 98.15%, and it also had surpassed all of the other algorithms when compared using those four performance metrics.
Table 3 Comparative assessment with existing studies
| Comparative Models | Disease Focused | Accuracy (%) |
| DCNFM |
• Bronzing • Crown Rot • Blast • Head Blight |
(98) |
| CNN |
• Crown Rot • Blast |
(96) |
| [10] |
• Brown Spot, • Bacterial Blight, • Leaf Smut |
(97) |
| [12] |
• Leaf Blast |
(89) |
| [17] |
• Leaf Scald, • Bacterial Blight, • Brown Spot, • Leaf Blast |
(86) |
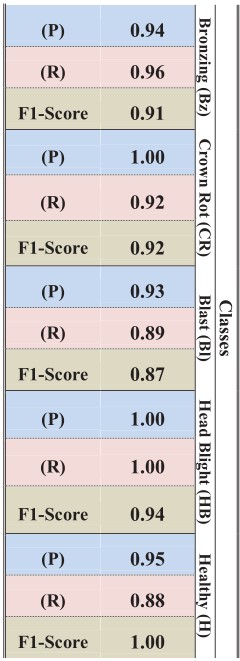
As the DCNFM model has obtained the best accuracy than other models, a performance table has been developed for all kind of classes for each dataset where (A), (P), (R), and F1-score of the individual classes has been indicated. From Table 5.2, it’s been observed that the precision for all the five class is 0.92 in which specifically crown rot and head blight recorded as 1.00. While recall recorded 0.09 for bronzing, crown rot, head blight but it is below 0.90 for both blast and healthy class. Lastly, F1 score records 0.90 for four classes (bronzing, crown rot, head blight, healthy) whereas for blast it is 0.87, which is seems to be lowest of all classes. Table 4 presents all these statistics and some more features.
Table 4 Evaluated score for each class of DCNFM
 |
The graph in Figure 6 shows the model’s training and testing data. It is noticed that the accuracy score for depicted in the yellow patches has achieved approximately 1.0, while the testing accuracy rate, with the red patches, is trending roughly between 0.5 and 0.95 (attaining the peak).

Figure 6 Training and testing A-score graph.

Figure 7 Confusion matrix.
Error Evaluations: It is much simpler to diagnose plant disease with the help of technology, but because of the complexity of the technique, this may be difficult to review. However, even in that case, no matter how efficient the technology, it can never match the capabilities of humans because certain restrictions will always be there. Disease detection might be problematic for the machine at times. Occasionally, it’s impossible to choose the ideal model, resulting in errors. Figure 7 shows seven data discrepancies between healthy class and crown rot and one data conflict among crown rot and blast, similar to head blight and crown rot. Nevertheless, the quantity is really small.
6 Conclusion
DCNFM architecture was used to train the dataset, and the resulting model attained excellent accuracy. This model detects four common and distinct diseases of the paddy plant along with healthy leaf conditions. This research assessed four DL network frameworks on several statistical metrics to assess the overall performance. The optimum results of 98.17% percent were attained through the DCNFM design process by examining the (A), (R), (P), and F1-score of the algorithm. The base data was obtained from several online sources and nearby paddy business farms for training and validating the proposed model in this work. Out of five classes of the dataset, paddy plant infections are described in four separate classes, and a health leaf condition is considered a single class. DCNFM network averagely performed at a level of 90.43% accuracy. The knowledge gained from this project is now being utilized to provide a more precise prognosis of paddy plant diseases. The inclusion of transfer learning enabled the model to achieve a higher level of accuracy and accomplished this at a lesser cost in terms of training computations.
References
[1] Y. Deng, Z. Ren, Y. Kong, F. Bao and Q. Dai (2017). A hierarchical fused fuzzy deep neural network for data classification. IEEE Transactions on Fuzzy Systems, 25(4), 1006–1012.
[2] L.S. Dutt and M. Kurian (2013). Handling of uncertainty – a survey. International Journal of Scientific and Research Publications, 3(1), 2250–3153.
[3] Endangsuryawati, Rika Sustika, R. Sandrayuwana, Agussubekti, Hilman F. Pardede, (2018). “Deep Structured Convolutional Neural Network for Tomato Disease Detection”, Advanced Computer Science and Information Systems(ICACSIS) 2018 International Conference.
[4] Farhana Tazmim, Nipa Khatun, S.M. Mohidul Islam, (2017). “Content based paddy leaf disease recognition and remedy prediction using support vector machine”, Computer and Information Technology(ICCIT) 2017 20th International conference.
[5] Halildurmus, Eceolcaygunes, Murvetkirci, (2017). “Disease detection on the leaves of the tomato plants by using deep learning”, Agro-Geoinformatics 2017 6th International Conference.
[6] Islam, Md. Ashiqul, Md. Nymur, Muhammad Shamsojjaman, Shazid Hasan, Md. Shahadat, and Tania Khatun. (2021). “An Automated Convolutional Neural Network Based Approach for Paddy Leaf Disease Detection.” International Journal of Advanced Computer Science and Applications 12, No. 1, doi:10.14569/ijacsa.2021.0120134.
[7] K. M. Karthick Raghunath and G. R. Anantha Raman (2020). “Neuro-Fuzzy-Based Smart Irrigation System and Multimodal Image Analysis in Static-Clustered Wireless Sensor Network for Marigold Crops.” Advances in Bioinformatics and Biomedical Engineering, pp. 237–255. doi:10.4018/978-1-7998-3591-2.ch015.
[8] M. Kholis, Yeni Herdiyeni and Aunu Rauf. (2013). “I-PEDIA: Mobile Application for Paddy Disease Identification Using Fuzzy Entropy and Probabilistic Neural Network.” 2013 International Conference on Advanced Computer Science and Information Systems (ICACSIS) doi:10.1109/icacsis.2013.6761609.
[9] Kouser, R. Ruhin, T. Manikandan, and V. Vinoth Kumar. (2018). “Heart Disease Prediction System Using Artificial Neural Network, Radial Basis Function and Case Based Reasoning.” Journal of Computational and Theoretical Nanoscience 15, no. 9, pp. 2810–2817. doi:10.1166/jctn.2018.7543.
[10] A. Kumar and G.K.H. Pang (2002). Defect detection in textured materials using gabor filters. IEEE Transactions on Industry Applications, 38(2), 425–440. http://dx.doi.org/10.1109/28.993164.
[11] Mercelin Francis, C. Deisy, (2019). “Disease Detection and Classification in Agricultural Plants using Convolutional Neural Networks – A Visual Understanding”, Signal Processing and Integrated Networks (SPIN) 2019 6th International Conference.
[12] Monzurul Islam, Anh Dinh, Khan Wahid and Pankaj Bhowmik, (2017). “Detection of potato diseases using image segmentation and multiclass support vector machine”, 2017 IEEE 30th Canadian Conference on Electrical and Computer Engineering (CCECE).
[13] Nguyen, Tuan-Linh, Swathi Kavuri, and Minho Lee. (2019). “A Multimodal Convolutional Neuro-Fuzzy Network for Emotion Understanding of Movie Clips.” Neural Networks 118, pp. 208–219. doi:10.1016/j.neunet.2019.06.010.
[14] P. R. Rothe and R. V. Kshirsagar. (2015). “Cotton Leaf Disease Identification Using Pattern Recognition Techniques.” 2015 International Conference on Pervasive Computing (ICPC), doi:10.1109/pervasive.2015. 7086983.
[15] S. Poria, E. Cambria, N. Howard, G.-B. Huang and A. Hussain. (2016). Fusing audio, visual and textual clues for sentiment analysis from multimodal content. IEEE Transactions on Affective Computing, 174, 50–59.
[16] Rajleen Kaur and Sandeep Singh Kang, (2015). “An enhancement in classifier support vector machine to improve plant disease detection”, moocs, Innovation and Technology ineducation (MITE) 2015 IEEE 3rd International Conference.
[17] S. Ramesh and D. Vydeki (2019). “Application of machine learning in detection of blast disease in South Indian rice crops”, Journal of Phytology, pp. 31–37.
[18] Rong Zhou, Shunichi Kaneko, Fumio Tanaka, Miyuki Kayamori, Motoshige Shimizu, (2013). “Early Detection and Continuous Quantization of Plant Disease Using Template Matching and Support Vector Machine Algorithms”, First International Symposium on Computing and Networking, doi:10.1109/candar.2013.52.
[19] Surbhi Jain, Joydip Dhar, (2017). “Image based search engine using deep learning”, Contemporary Computing (IC3) 2017 Tenth International Conference.
[20] Viraj A. Gulhane, Maheshkumar H. Kolekar, (2014). “Diagnosis Of Diseases On Cotton Leaves Using Principal Component Analysis Classifier”, Annual IEEE India Conference.
[21] Yusuke Kawasaki, Hiroyuki Uga, Satoshi Kagiwada, Hitoshi Iyatomi, (2015). “Basic Study of Automated Diagnosis of Viral Plant Diseases Using Convolutional Neural Networks”, 11th International Symposium, ISVC 2015, Las Vegas, NV, USA.
[22] Z. Guo, (2019). “Rice Carrying Capacity and Sustainable Produce of Rice in Resources-Limited Regions”, International Journal of Agricultural Science and Food Technology 5, no. 1 (July 23, 2019): pp. 054–057.
Biographies

V. Vinoth Kumar is an Associate Professor at Department of Computer Science, MVJ College of Engineering, India. His current research interests include Big Data Analytics, Internet of Things, machine learning and wireless networks. He is the author/co-author of papers in international journals and conferences including SCI indexed papers. He has published as over than 35 papers in IEEE Access, Springer, Elsevier, IGI Global, Emerald etc. He is a reviewer for Elsevier, IEEE Access, IEEE Transactions, and Springer journal. He has demonstrable experience in leading large-scale research projects and has achieved many established research outcomes that have been published and highly cited in many significant Journals and Conferences. He is the Associate Editor of International Journal of e-Collaboration (IJeC) and Editorial member of various journals. He has also been a guest editor of several international journals including, Journal of Intelligent Manufacturing (Springer), International Journal of Intelligent Computing and Cybernetics, International Journal of e-Collaboration (IJeC), International Journal of Pervasive Computing and Communications(IJPCC), International Journal of System of Systems Engineering(IJSSE), International Journal Speech Technology (IJST)-Springer, Journal of Reliable Intelligent Environments (JRIE), International journal of Information Technology and Web Engineering (IJITWE),International Journal of Machine Learning and Computing (IJMLC),International Journal of Cloud Computing (IJCC),International Journal of Information Quality (IJIQ) ,Journal of Computational and Theoretical Nanoscience and International Journal of Intelligent Enterprise (IJIE). He has been professional society member of ISTE, IACIST and IAENG. He has co-chaired major Conferences Program Committees such as: ICACB’18, ICAIIS’19 etc. He has filed 3 IPR patents in IOT applications and currently doing funding project to CSIR and ISRO.

K. M. Karthick Raghunath is an Associate Professor in the Computer Science and Engineering Department in MVJ College of Engineering, Bangalore, India. He has received his B. Tech., in Information Technology from Anna University in 2008 and M.E., in Pervasive Computing Technology from Anna University (BIT Campus) in 2011. In 2019, he completed his Ph.D. degree from Anna University, Chennai. With nearly a decade of experience in teaching, his areas of specialization include pervasive computing, Artificial Intelligence, IoT, Data Science, and WSN. He has five patents in IPR and has published approximately more than ten papers in reputed international journals. He has authored ”Response Time Optimization in Wireless Sensor Networks,” published in LAP LAMBERT Academic Publishing, U.K. He has published numerous papers in National and International Conferences and has served as editor/reviewer for Springer, Elsevier, Wiley, IGI Global, Emerald, ACM, and many more. He is an active member of IEEE, ACM, I.E.(I), IACSIT, and IAENG. He has organized several National Workshops and Technical Events. He is regularly invited to deliver lectures in various programs for imparting skills in research methodology to students and research scholars.

N. Rajesh completed his PhD in Computer Science from Bharathiar University, MCA from Thiruvalluvar University and BSc Computer science from Madras University. He is currently working as a Lecturer at University of Technology and Applied Science, Shinas, Sultanate of Oman. His research interest includes data mining, machine learning, big data analytics, and Privacy preserving algorithms. He published articles in the National conferences, International Indexed journals, including SCI, WoS, SCOPUS.

Muthukumaran Venkatesan was born in Vellore, Tamilnadu, India, in 1988. He received the B.Sc. degree in Mathematics from the Thiruvalluvar University Serkkadu, Vellore, India, in 2009, and the M. Sc. degrees in Mathematics from the Thiruvalluvar University Serkkadu, Vellore, India, in 2012. The M. Phil. Mathematics from the Thiruvalluvar University Serkkadu, Vellore, India, in 2014 and Ph.D. degrees in Mathematics from the School of Advanced Sciences, Vellore Institute of Technology, Vellore in 2019. At present, he has a working Assistant Professor in the Department of Mathematics, REVA University Bangalore, India. His current research interests include Algebraic cryptography, Fuzzy Image Processing, Machine learning, and Data mining. His current research interests include Fuzzy Algebra, Fuzzy Image Processing, Data Mining, and Cryptography. Dr. V. Muthukumaran is a Fellow of the International Association for Cryptologic Research (IACR), India; He is a Life Member of the IEEE. He has published more than 30 research articles in peer-reviewed international journals. He also presented 19 papers presented at national and international conferences.

Rose Bindu Joseph is currently working as an Associate Professor in the Department of Mathematics at Christ Academy Institute for Advanced Studies, Bangalore. She received her Ph.D. in Mathematics from VIT University, Vellore in the field of Interval Type-2 Fuzzy Theory. She has qualified NET for lectureship by CSIR-UGC. She holds a Master’s degree and bachelor’s degree in Mathematics from Mahatma Gandhi University, Kerala. She has more than 15 years of experience in academia and research. She has published more than 15 research papers in Scopus indexed journals and presented papers in many international conferences. Her research interests include fuzzy theory, machine learning, soft computing and artificial intelligence.

N. Thillaiarasu currently working as an Associate Professor in the School of Computing and Information Technology, REVA University, Bengaluru, He has also served as an Assistant Professor at Galgotias University, Greater Noida from July 2019 to December 2020. He worked 7.3 Years as an Assistant Professor in the Department of Computer Science and Engineering, SNS College of Engineering, Coimbatore. Obtained his B.E., in Computer Science and Engineering from Selvam College of Technology in 2010 and received his M.E., in Software Engineering from Anna University Regional Center, Coimbatore in 2012. He received his Ph.D., Degree from Anna University, Chennai in 2019, he has published more than 22 research papers in refereed, Springer, and IEEE Xplore conferences. he has organized several workshops, summer internships, and expert lectures for students. He has worked as a session chair, conference steering committee member, editorial board member, and reviewer in Springer Journal and IEEE Conferences. he is an Editor board Member of editing books titled “Machine Learning Methods for Engineering Application Development” Bentham Science. He is also working as editor for the title, “Cyber Security for Modern Engineering Operations Management: Towards Intelligent Industry”, Design Principle, Modernization and Techniques in Artificial Intelligence for IoT: Advance Technologies, Developments, and Challenges” CRC Press Tylor and Francis, His area of interest includes Cloud Computing, Security, IoT, and Machine Learning.
Journal of Mobile Multimedia, Vol. 18_2, 325–348.
doi: 10.13052/jmm1550-4646.1829
© 2021 River Publishers