Evaluation of Machine Learning Algorithms for Air Quality Index (AQI) Prediction
Alka Pant1,*, Sanjay Sharma2 and Kamal Pant3
1School of Computing, Graphic Era Hill University, Dehradun, Uttarakhand, India
2School of Computer Applications and Information Technology, Shri Guru Ram Rai University, Dehradun, Uttarakhand, India
3School of Vocational Studies, Graphic Era Hill University, Dehradun, Uttarakhand, India
E-mail: alkapant392@gmail.com; sanjaypokhriyal@yahoo.com; kpant@gehu.ac.in
*Corresponding Author
Received 17 January 2023; Accepted 06 November 2023; Publication 26 December 2023
Abstract
The Air Quality Index (AQI) has been deteriorated due to the growth of industry and automobiles in many regions of India. Artificial intelligence and machine learning have greatly benefited the ability to predict air quality. This paper aims to know the status of air pollutants (PM, PM, SO, and NO) monitored in different cities of Uttarakhand State (India) and the Air Quality Index (AQI) using the Python language (Jupyter Notebook). The air quality index dataset has used six machine-learning algorithms (Logistic Regression, Naive Bayes, Random Forest, Support Vector Machine, K-Nearest Neighbors, and Decision Tree). These machine-learning algorithms have been evaluated based on precision, recall, accuracy, etc. The result shows that Random Forest and Decision Tree algorithms outperformed each other and achieved the highest accuracy, i.e., 99.0%. Further, the air quality index (AQI) values have also been predicted and compared to actual values using the random forest algorithm.
Keywords: Pollutants, air quality index, machine learning algorithms, evaluation and prediction.
1 Introduction
A famous saying is, “Be a part of the solution, not a part of the pollution.” But in recent years, many ailments and diseases have stricken humans and animals in immense proportions for obvious reasons that people ignore and prove fatal if not treated early. In India, air pollution is seen as a significant issue. Even a tiny quantity of airborne contaminants can gradually become more hazardous to human health than comparable toxins in food [1]. Polluted air has a negative impact on human health due to its higher concentration of pollutants [2]. The quantifiable characteristics of daily air quality are significantly above the highest values deemed appropriate for public health care. The air quality index (AQI) informs the public about the status of clean air in their region and how it can affect their lives. Many national air quality standards are compatible with the air quality measurements used by other countries. The National Air Quality Index (NAQI) classified the air quality simply as good (0–50), satisfactory (51–100), moderately polluted (101-200), poor (201-300), very poor (301-400), and severe (401–500). People in several sectors, including those related to climate change, are concerned about the recent rise in automobiles and industries, even in India [3]. Every industry manufactures a unique spectrum of products, leading to various wastes while the initiatives are in action. Depending on the waste generated, different amounts and ratios of toxic gases, such as nitrogen dioxide, sulfur dioxide, carbon dioxide, and carbon monoxide, may be present. Vehicle exhaust is the primary source of carbon monoxide, but natural processes can change it into less dangerous compounds [4]. In India’s big cities and popular tourist destinations, air pollution is a severe problem because of the country’s heavy traffic volumes [5]. While sulfur dioxide is an incredibly receptive gas with a harsh, unsettling scent, nitrogen dioxide is a highly receptive gas framed by engine vehicles and gas burners. It is produced by burning petroleum products in power plants and other mechanical places [6]. The SO contributes to existing respiratory conditions by irritating the nose and lungs [7], increasing the load of adult asthma hospitalization cases [8]. Despite being the main contributor to respiratory and cardiovascular illnesses, it has also been discovered to impact cardiovascular diseases [9]. On the other hand, particulate matter combines several elements like dust, metal, soil, nitrates, and sulfates. Particulate pollution, often known as “particles,” is the term for tiny solid material fragments dispersed into the atmosphere. They are small and can easily pass via nose and throat to enter the lungs. Diseases caused by these particles’ effects on the heart and lungs [10]. The manufacture of bricks releases black smoke into the air, and the chemical and textile industries produce a lot of trash, contributing to air pollution. Farmers who use pesticides, insecticides, and fertilizers directly pollute the air. Contrarily, while NO is released by road traffic or indoor combustion sources, PM is produced by construction work [11]. On the other hand, oil (fuel) increases the risk of lung cancer, and SO comes from burning coal. It concludes that the ecosystem’s stability is in danger because of a breakdown in connection between people and the environment. An artificial intelligence system uses machine learning to take sensor data and learn how to behave in a particular environment. We can train massive datasets on a vast scale using the machine learning techniques. We can forecast upcoming trends and occurrences by using historical data, experience, and tendencies [12]. Artificial intelligence and machine learning have greatly benefited the ability to predict air quality [13]. Some researchers also developed their models through the time series techniques (ARIMA) to predict the AQI level [14, 15]. However, the foundation of ML algorithms is the notion that robots can learn from data, recognize patterns, and form inferences with a minimum of human intervention [16]. With technological advances, a lot of information about the pollutants and the clean air status is figured out and helps the government/agencies in policy formation. The AQI prediction is a complex task and the collected pollutants data always needs to be pre-processed due to the instrumental failure before the selection of an algorithm. So, this study aims to know the status of air pollutants monitored in Uttarakhand State, India and to select the best machine-learning algorithm to predict the air quality index (AQI) using the sub-indices of air pollutants.
2 Materials and Methods
Due to the growth of industries, air pollution concentrations have been measured in several places in India. The study covers all the cities of the state where air pollutants have been monitored by State Government namely Dehradun (ISBT, Raipur Road and Clock Tower area), Rishikesh, Haridwar (SIDCUL), Haldwani, Kashipur, and Rudrapur. Five years of monthly data of all the impurities/pollutants have been considered which are being measured by the Uttarakhand Pollution Control Board (UPCB). To choose the best machine-learning algorithms (supervised) for predicting the air quality index class, six algorithms have been compared based on their evaluation criteria/metrics. The measurement of the air quality index, accuracy, and prediction has been done through python programming (jupyter notebook).
2.1 Machine Learning (ML) Algorithms
Logistic Regression: It is used for categorization tasks like screening of respiratory problems, prediction of junk mail/spam, and predicting the dependent variable with the help of a given set of independent variables using discrete/absolute values [17].
Random forest: This supervised machine learning algorithm is used in regression and classification. This method results in most trees’ class when doing classification jobs. It can be used to spot credit card fraud, forecast illnesses, and categorize loan applications; it is typically trained using the “bagging” method. Additionally, it works well for determining the contaminants in a given dataset [18].
Support Vector Machine (SVM): It is the most commonly used supervised ML-algorithm for the task of classification (output a discrete class) and regression (output a continuous value). Though it can be used for regression, it is most popular for classification. It has been used by many of the earlier works in their sentiment analysis task [19].
Naive Bayes: It is a rapid classification algorithm with two stages appropriate for a large dataset. Under this, a classifier’s learning stage is used to train its model on the known dataset. Another stage is the evaluation stage, which is used for performance testing and is used for multiple applications like spam filtering, text classification, recommender systems, etc. The prediction of unknown classes uses the Bayes theorem of probability.
K-Neighbors: “K” stands for several nearest neighbors. It is the algorithm which usually needs a user input, though there are several criteria that can be used to calculate K automatically. It converges after many steps and works only for numerical data, which is easy to implement.
Decision tree: Both classification and regression methods can be utilized with a decision tree. It is used for geographic representation as a decision tree to achieve all potential outcomes. It is divided into two nodes: a decision node and a leaf node. Compared to other methods, this requires less data cleansing [20].
2.2 Performance Evaluation Criteria for ML Algorithms
Some commonly used tools for evaluating the performance of ML classification algorithms are Accuracy, Precision, Recall, and F1 score [21]. Here, the accuracy of a classification algorithm has four possible ways –
TP – Predicted class is Y, Actual class is also Y.
FP – Predicted class is Y, Actual class is N.
FN – Predicted class is N, Actual class is Y.
TN – Predicted class is N, Actual class is also N.
Here, TP means True Positive; FP means False Positive; FN means False Negative; and TN means True Negative.
Accuracy – Accuracy is the most common and basic evaluation metric used to measure the trained model performance. Nevertheless, much of the earlier works in sentiment analysis used these metrics, but more is needed to judge the model’s effectiveness. It is the ratio of the number of instances correctly predicted by the trained model to the total number of instances in the dataset (input samples). The accuracy of the classifier can be shown in terms of sensitivity computed as:
| (1) |
It is worth noting that this metric works well for a balanced dataset, that is when the number of instances is equally distributed among classes. In the case of the unbalanced dataset, these metrics would be biased towards the class having the highest number of samples.
Precision – Precision is the proportion of positive instances successfully predicted to all positive instances predicted by the model. Precision indicates how good the classifier is in predicting the positive classes.
| (2) |
Recall (Sensitivity) – The ratio of events that were accurately predicted as positive to all instances that should have proved positive.
| (3) |
F1 score – It is a combination of the harmonic mean of precision and recall; that is, it helps to balance recall and precision. Its range is [0, 1]. It punishes extreme values and signifies how precise and robust your classification model is. The higher the F1 score, the better the model. It is an effective metric among various metrics when false positives and negatives are equally important. Several state-of-the-art sentiment analysis systems have used it as a primary evaluation metric.
| (4) |
2.3 Pre-processing
Pre-processing relates to preparing the data until it passes to the algorithm. It is, therefore, crucial for comprehending the data and applying a machine learning model to analyze it. Here, the dataset’s missing values are filled in by the mean value of pollutants. The entire experiment has been carried out using five years’ monthly data of air pollutants, namely PM/PM, SO and NO. The air quality index (AQI) is also calculated through the sub-indices of air pollutants measured in various cities and divided into train and test data sets (65:35).
2.4 Evaluation and AQI Prediction
Each AQI value has given a class as per National Air Quality Index (NAQI) Standard. Hence, we have taken only the classification algorithms, i.e., Logistic Regression, Random Forest, SVM, Naive Bayes, K-Neighbors, and Decision Tree. To know the best algorithm for predicting the AQI, ml-algorithms (classification) have been compared based on their performance criteria for the available monthly dataset of air pollutants.
3 Results and Discussion
To evaluate the performance of machine learning algorithms to predict the air quality index (AQI), this study covers different cities namely Dehradun (ISBT, Raipur Road, Clock Tower area), Rishikesh, Haridwar, Haldwani, Rudrapur and Kashipur of Uttarakhand state where air pollutants (PM, PM, NO, SO) have been monitored. The study identifies a positive relationship between PM and SO (Figure 1) indicating that if PM rises then SO also expands and vice versa [22]. Based on the five-year monthly data, the study also shows that the ISBT area is the most polluted area of Dehradun City for this state (Figures 2 and 3).
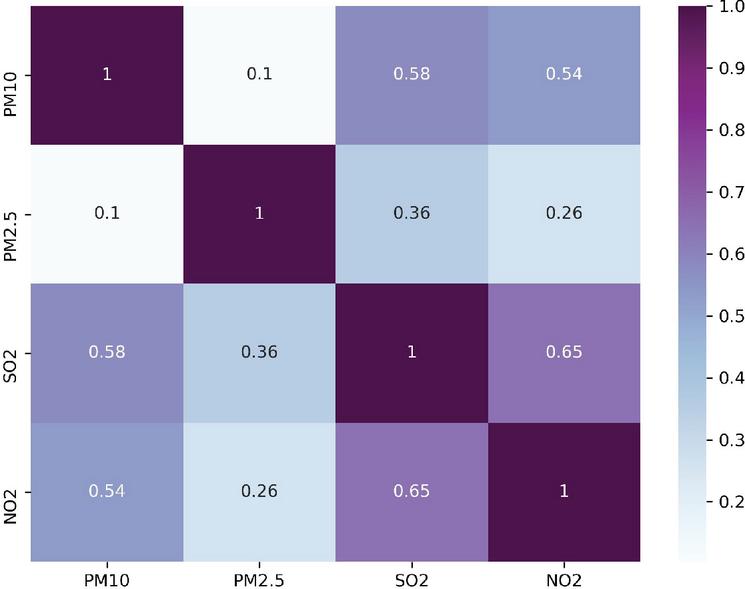
Figure 1 Heatmap of air pollutants (continuous variables).
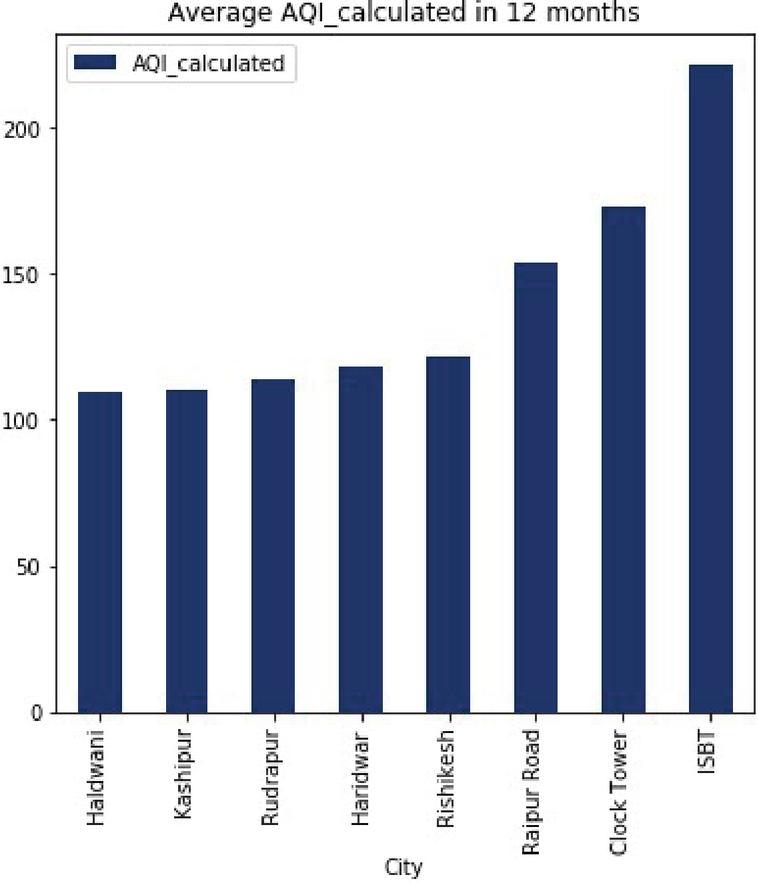
Figure 2 Air quality index in Uttarakhand State (India).
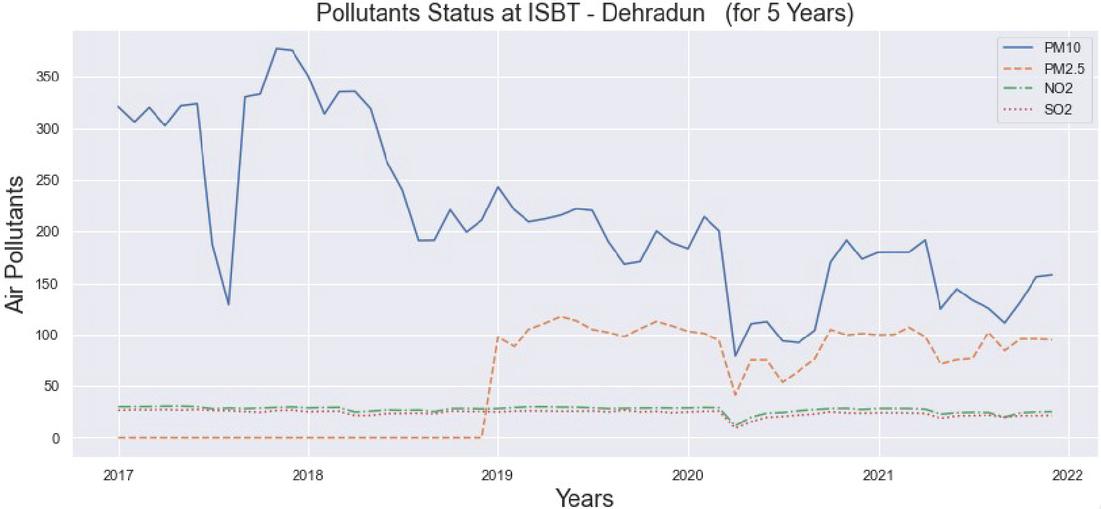
Figure 3 Pollutants status for ISBT area in Dehradun City (Uttarakahnd).
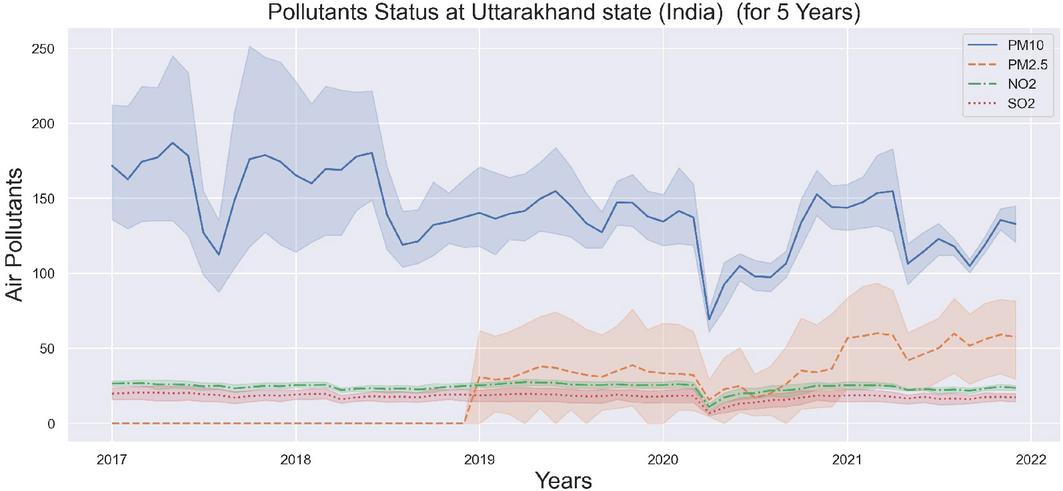
Figure 4 Graphical representation of air pollutants.
Figure 4 shows a sharp rise in air pollutants due to the November festival seasons [23], but things improve during the rainy season. It also shows that due to the PM pollutant, the air is now moderately polluted (range 100–200), whereas the PM has been monitored from 2019 onwards, which is now increasing at a high rate for this state. The ML-algorithms are used past data as input to predict the new output. As a result, we used precision, recall, and accuracy metrics to evaluate the efficiency of ML-algorithms [24]. Table 1 shows that the random forest and decision tree classifiers performed the best with the same accuracy of 99%. The naive bayes classifier was the worst of the six algorithms, with a classification accuracy of 84%.
| ML Algorithms | Precision | Recall | F1 Score | Accuracy |
| Logistic Regression | 0.96 | 0.97 | 0.97 | 0.97 |
| Random Forest | 0.99 | 0.99 | 0.99 | 0.99 |
| Support Vector Machine | 0.91 | 0.92 | 0.90 | 0.92 |
| Naive Bayes | 0.88 | 0.84 | 0.85 | 0.84 |
| K-Neighbors | 0.98 | 0.98 | 0.98 | 0.98 |
| Decision Tree | 0.99 | 0.99 | 0.99 | 0.99 |
The outcome of the present study also supports a past study where it was concluded that the both the ML-algorithms (random forest and decision tree) are the most efficient techniques for the AQI prediction [25]. Further, the predicted class/values of AQI have been calculated through the Random Forest classifier due to its more stability as compared to the decision tree and compared them to the actual class; it was found that the same accuracy (99%) is achieved for the historical dataset of air quality index (AQI) for this state (Table 2).
Table 2 Comparison of actual versus predicted class of AQI
| (99% accuracy with random forest classifier) | ||
| Date | Actual Class | Predicted Class |
| 6/1/2020 | 2 | 2 |
| 6/1/2021 | 1 | 1 |
| 8/1/2020 | 2 | 2 |
| 10/1/2021 | 2 | 2 |
| 6/1/2017 | 2 | 2 |
| 8/1/2019 | 2 | 2 |
| 10/1/2017 | 2 | 2 |
| 10/1/2018 | 2 | 2 |
| 8/1/2017 | 0 | 1 |
| 8/1/2018 | 2 | 2 |
| 4/1/2018 | 1 | 1 |
| 8/1/2021 | 2 | 2 |
| 7/1/2019 | 3 | 3 |
| 12/1/2018 | 2 | 2 |
| Here, 0 means Good AQI, 1 means Satisfactory AQI, 2 means the AQI has Moderately Poor, 3 means AQI is in Poor range, and so on. | ||
4 Conclusions
This study presents a novel solution for predicting the air quality index using a significant number of pollutant data points, and it will be crucial in protecting India’s environment. We have implemented powerful machine-learning techniques to prevent air pollution. The results show that the random forest and decision tree classifiers are more precise as compared to other ML-algorithms for air quality index (AQI) prediction. Further, the same accuracy has been achieved when the actual class/values of AQI have been compared with the predicted ones using a random forest classifier. Hence, random forest is the best ML-algorithm to predict the AQI class. Time series modelling techniques can be used to forecast the concentration of each pollutant as a further scope of this study which will help the Government to formulate policies to handle the problems of air pollution.
References
[1] Manisalidis I, Stavropoulou E, Stavropoulos A, Bezirtzoglou E. (2020). Environmental and health impacts of air pollution: a review. Frontiers in Public Health 8(14).
[2] Zhang K, Batterman S. (2013). Air pollution and health risks due to vehicle traffic. Science of the Total Environment, 450–451.
[3] Douglas MJ, Watkins SJ, Gorman DR, Higgins M. Erratum. (2011). Are cars the new tobacco? Journal of Public Health (Bangkok), 33(3), 472.
[4] Gladkova E, Saychenko L. (2022). Applying machine learning techniques in air quality prediction. Transportation Research Procedia, 63, 1999–2006.
[5] Pant A, Sharma S, Bansal M, Narang M. (2022). Comparative analysis of supervised machine learning techniques for AQI prediction. International Conference on Advanced Computing Technologies and Applications (I.C.A.C.T.A.), (pp. 1–4). IEEE.
[6] India world’s largest emitter of sulfur dioxide, emissions. (2019, October). Greenpeace India.
[7] Xu C, Zhao W, Zhang M, Cheng B. (2021). Pollution haven or halo? The role of the energy transition in the impact of FDI on SO emissions. The Science of the Total Environment, 763.
[8] Chciałowski A, Agata D, Badyda A, Piotr D. (2022). Ambient air pollution and risk of admission due to asthma in the three largest urban agglomerations in Poland: a time-stratified, case-crossover study. International Journal of Environmental Research and Public Health, 19 (10), 5988.
[9] Mekasha M, Haddis A, Shaweno T, Mereta S.T. (2018). Emission level of PM and its association with chronic respiratory symptoms among workers in cement industry: a case of Mugher cement industry, Central Ethiopia. Avicenna Journal of Environmental Health Engineering, 5, 1–7.
[10] Delavar MR, Gholami A, Shiran GR. (2019). A novel method for improving air pollution prediction based on machine learning approaches: a case study applied to the capital city of Tehran. International Journal of Geo-Information, 8(2).
[11] Mitreska Jovanovska E, Batz V, Lameski P, Zdravevski E, Herzog MA, Trajkovik V. (2023). Methods for urban air pollution measurement and forecasting: challenges, opportunities, and solutions. Atmosphere, 14(9), 1441.
[12] Pant A, Joshi RC, Sharma S, Pant K. (2023). Predictive modeling for forecasting air quality index (AQI) using time series analysis. Avicenna Journal of Environmental Health Engineering, 10(1), 38–43.
[13] Senthivel S, Chidambaranathan M. (2022). Machine learning approaches used for air quality forecast. Revue d’Intelligence Artificielle, 36(1), 73–78.
[14] Liu T, You S. (2022, March). Analysis and forecast of Beijing’s air quality index based on arima model and neural network model. Atmosphere, 13(4), 512.
[15] Sethi J.K, Mittal M. (2020). Analysis of air quality using univariate and multivariate time series models. 10th International Conference on Cloud Computing, Data Science & Engineering (Confluence), Noida, India, (pp. 823–827).
[16] Liu H, Liu Q, D Li, Yu D, Gu Y. (2019). Air quality index and air pollutant concentration prediction based on machine learning algorithms. Applied Sciences, 9(19), 4069.
[17] Pant A, Sharma S, Joshi RC. (2022). Air quality modeling for effective environmental management in Uttarakhand, India: a comparison of logistic regression and naive bayes. Journal of Air Pollution & Health, 7(3), 287–298.
[18] Halsana S. (2020). Air quality prediction model using supervised machine learning algorithms. International Journal of Scientific Research in Computer Science, Engineering and Information Technology, 6(4), 190–201.
[19] Mahalingam U, Elangovan K, Dobhal H, Valliappa C. (2019). A machine learning model for air quality prediction for smart cities. International Conference on Wireless Communications Signal Processing and Networking, (pp. 452–457).
[20] CRK, NRK, BPK and Rajendran PS. (2021). The prediction of quality of the air using supervised learning. 6th International Conference on Communication and Electronics Systems (ICCES), Coimbatore, India, (pp. 1–5).
[21] Bhalgat P, Pitale S, Bhoite S. (2019). Air quality prediction using machine learning algorithm. International Journal of Computer Applications Technology and Research, 9(9), 367–370.
[22] Song L. (2017). Impact analysis of air pollutants on the air quality index in Jinan Winter. International Conference on Computational Science and Engineering (CSE) and International Conference on Embedded and Ubiquitous Computing (EUC), (pp. 471–474). IEEE.
[23] Gore RW, Deshpande DS. (2017). An approach for classification of health risks based on air quality levels. 1st International Conference on Intelligent Systems and Information Management (ICISIM), Aurangabad, India, (pp. 58–61).
[24] Soundari G. (2019). Indian air quality prediction and analysis using machine learning. International Journal of Applied Engineering Research, 14(9), 181–186.
[25] Marjan A. (2017, September). Predictive mapping of urban air pollution using apache spark on a hadoop cluster. ICCBDC International Conference on Cloud and Big Data Computing, London: United Kingdom. (pp. 89–93).
Biographies

Alka Pant received the master’s degree in Computer Science and Engineering from Uttarakhand Technical University, Dehradun, Uttarakhand (India) in 2015, and the philosophy of doctorate degree in Computer Applications & Information Technology from Shri Guru Ram Rai University in 2023. She is currently working as an Associate Professor at the School of Computing, Graphic Era Hill University, Dehradun. She has authored books & published the scientific research for societal benefit.

Sanjay Sharma received the philosophy of doctorate degree in Computer Science and presently working as a Professor and Dean at the School of Computer Applications & Information technology, Shri Guru Ram Rai University, Dehradun. He has published a number of publications in both national and international peer-reviewed journals with IEEE conference proceeding.

Kamal Pant received the philosophy of doctorate degree in Commerce from C.C.S. University, Meerut in 2010. He is currently working as a Professor and Head at the School of Vocational Studies, Graphic Era Hill University, Dehradun. He has published many research papers in the area of analytics of National and International repute. He is also a recipient of National and International awards.
Journal of Reliability and Statistical Studies, Vol. 16, Issue 2 (2023), 229–242.
doi: 10.13052/jrss0974-8024.1621
© 2023 River Publishers