Predictive Modelling: An Assessment Through Validation Techniques
M. Iqbal Jeelani1, Faizan Danish2,* and Saquib Khan1
1Division of Statistics and Computer Science, Faculty of Basic Sciences, SKUAST-J, J&K, India
2Division of Biostatistics, Department of Population Health, School of Medicine, New York University, New York, NY, USA
E-mail: danishstat@gmail.com
Corresponding Author
Received 03 March 2021; Accepted 17 December 2021; Publication 07 February 2022
Abstract
In this investigation, various statistical models were fitted on simulated symmetric and asymmetric data. Fitting of models was carried out with the help of various libraries in R studio, and various selection criteria were also used while fitting of models. In order to evaluate different validation techniques the simulated data was divided in training and testing data set and various functions in R were developed for the purpose of validation. Coefficient summary revealed that all statistical models were statistically significant across both symmetric as well as asymmetric distributions. In preliminary analysis TFEM (Type First Exponential Model) was found out to be the best linear model across both symmetric and asymmetric distributions with lower values of RMSE, MAE, BIAS, AIC and BIC. Among non-linear models, Haung model was found out to be best model across both the distributions as it has lower values of RMSE, MAE etc. Different validation techniques were used in the present study. Lower rates of prediction error in comparison to its counter parts, 5-folded cross validation performed better across all the statistical models.
Keywords: Cross validation, prediction error rate, linear and non-linear model.
1 Introduction
Economic policy and planning requires regional agricultural data as they are extremely vital for decision making. More sophisticated models depend on mathematical statements and consequently allow us not only to explain observable facts but also to predict possibly unobserved events. Models can provide researchers a tool to make sound recommendations, to aid the conceptualization and to predict the consequences of an action that would be expensive, difficult or destructive to do with the real world. Statistical models are mostly used for making prediction on the data set. To finalize any model a number of models are compared and the best performed model is selected and proceeded for further process using different selection criteria approaches validation technique. Validation is an approach for concluding the results obtained from the real data and generalize the same to an unrelated or independent data. The concept of validation was pioneered in 1930s (Larson, 1931), and generalized by (Mosteller, 1968). Evaluation is not just a meager reflection to statistical formulation model, but is taken into consideration at every point even when functions are decided and executed on the data and when the functions are taken together to finalize the completed model. Usually in evaluating growth models it has become common to keep some data aside in order to take an unrelated benchmark test for the developed model (Snee, 1977 and Shifley, 1987). From the behavior of the model, the survive cannot be tested by the role of an unrelated or benchmark test. The cost of benchmarking may be more than the benefits if the procedure for model fitting is disclose casual parameters (Hirsch, 1991). Splitting a sample into two groups is not change for the testing data from replicated, controlled trails. The stand density and site efficiency were mystified from the passive monitory data set proposing a growth models disadvantages (Vanclay, 1994). To minimize the dangers of bias, objective procedures (Snee, 1977) may be utilized to choose benchmark data. For an unrelated data to use resampling techniques for these tests is a well reputed method (Efron and Gong, 1983; Weisberg, 1985). Subdividing the data for model selection and benchmarking cross validation is one of the reasonable method (Burk, 1990). Rather than ignoring some portion of data, each data point is ignored in turn and the model is made to the rest data. From the ignored data points benchmark tests are averaged and for the case of squared error and linear model (test statistics) then the cross validation is approximation of pure error is n times the PRESS statistics calculated by several regression packages. By omitting data, a variation on these individual observation using resampling procedures for instance geographical location etc (Tarp-Johansen et al., 1996). The most accredited methods for obtaining good internal validation estimates of statistical models in terms of predictive performance are half splitting, leave one out cross validation and k-folded cross validation.
Keeping in view all the above mentioned aspects of model validation, in the present study, we would evaluate the progress of validation techniques for linear and non-linear statistical model and will propose the efficient validation technique in terms of predictive ability of fitted linear & non-linear models.
2 Materials and Methods
Both symmetric and asymmetric data was generated through simulation technique in R Studio (R version 3.5.1) 2018 “Feather Spray”). In our study we used several statistical models to check which models works better. The functional form and description of models used in the present investigation is given below:
1. First degree polynomial model with the functional form as follows:
2. Power model having form:
3. Type I Exponential having the form:
4. Winsor model with the form:
5. Grosenbaugh model with form:
6. Haung Model with the form:
It is not left handed work to confine a selection criteria in evaluating the performance of a model and as of now, the literature does not give any evidence for any particular method for choosing the best statistical model among the available models. The common approach used to evaluate the performances of the models are using several approaches rather confine to a particular method.
Various selection criteria were used in the present study while fitting the statistical models. Some of the important selection criteria along with their descriptions are given below:
• RMSE or Root Mean Square Error
• MAE or Mean Absolute Error
• AIC or Akaike’s Information Criterion
• BIC or Bayesian Information Criterion
In order to evaluate the precision of the model in practice, we used validation techniques. Brief about the validation techniques used in the present study is as under:
• Half-splitting
• Cross-validation
• Jackknife Technique
3 Results
The present study is conducted with a view to evaluate validation techniques in linear and non-linear statistical models. The summary statistics of the symmetric and asymmetric data generated through simulation are given in Table 1. The overall summary of the coefficients of statistical models across symmetric and asymmetric distribution has been presented in Table No: 2, 3, 4 and 5. The estimates in the model were significant that indicates the models are well fitted for both the distributions.
Table 1 Summary statistics of simulated data
| Shapiro Wilk Test | |||||||
| Variables | Mean | Median | Skewness | Kurtosis | W | p-value | |
| Symmetric | Y1 | 0.9163 | 0.8932 | 0.1572 | 3.0197 | 0.9965 | 0.9395 |
| Distribution | X1 | 0.0383 | 0.0314 | 0.0653 | 3.0386 | 0.9918 | 0.3295 |
| Asymmetric | Y1 | 9.2395 | 8.1061 | 1.4103 | 5.7951 | 0.8983 | 1.986e-10 |
| Distribution | X1 | 4.9134 | 3.5108 | 1.9795 | 8.9297 | 0.8136 | 9.96e-15 |
Table 2 Parameter estimates of linear models for symmetric distribution
| Model | Model Equation | a | b | F |
| TFEM | 0.62 | 0.10 | 5.96 | |
| PWRM | 0.41 | 0.73 | 5.34 | |
| FDM | 0.06 | 0.06 | 5.12 |
Table 3 Parameter estimates of linear models for asymmetric distribution
| Model | Model Equation | a | b | F |
| TFEM | 0.02 | 1.31 | 6.01 | |
| PWRM | 0.01 | 1.16 | 5.04 | |
| FDM | 0.11 | 5.52 | 4.02 | |
| (FDM First degree polynomial model, PWRM Power model, TFEM Type I Exponential Model). | ||||
Table 4 Parameter estimates of non-linear models for symmetric distribution
| Model | Model Equation | a | b | c |
| HAM | 3.14 | 1.16 | 0.72 | |
| WNM | 1.70 | 1.35 | 1.42 | |
| GSRM | 1.34 | 0.53 | 1.44 |
Table 5 Parameter estimates of non-linear models for asymmetric distribution
| Model | Model Equation | a | b | c |
| HAM | 5.14 | 2.16 | 0.72 | |
| WNM | 2.21 | 0.84 | 2.70 | |
| GSRM | 1.82 | 0.16 | 1.85 | |
| (WNM Winsor model, GSRM Grosenbaugh model, HAM Haung model). | ||||
Performance Criteria for Symmetric and Asymmetric Distribution
3.1 Linear Models
The performance of linear models across symmetric and asymmetric distribution utilizing various selection criteria like RMSE, MAE, BIAS, AIC & BIC has been presented in Tables 6 and 7 revealed. Among linear models type first exponential model (TFEM) was found out to be the best linear model across both symmetric and asymmetric distribution with lower values of RMSE, MAE, BIAS, AIC & BIC.
Table 6 Performance criteria for linear model utilizing symmetric distribution
| Model | Model Equation | RMSE | MAE | BIAS | AIC | BIC |
| TFEM | 4.23 | 3.22 | 0.82 | 594.01 | 603.90 | |
| PWRM | 5.72 | 3.97 | 1.74 | 617.53 | 639.48 | |
| FDM | 6.96 | 3.99 | 1.95 | 1150.63 | 1161.58 |
Table 7 Performance criteria for linear model utilizing asymmetric distribution
| Model | Model Equation | RMSE | MAE | BIAS | AIC | BIC |
| TFEM | 0.96 | 0.79 | 0.30 | 162.93 | 178.92 | |
| PWRM | 1.07 | 0.88 | 0.56 | 557.83 | 563.78 | |
| FDM | 1.13 | 0.92 | 0.74 | 605.12 | 625.27 | |
| (FDM First degree polynomial model, PWRM Power Model, TFEM Type I Exponential model). | ||||||
Table 8 Performance criteria for non-linear models utilizing symmetric data
| Model | Model Equation | RMSE | MAE | BIAS | AIC | BIC |
| HAM | 2.99 | 2.35 | 0.98 | 276.56 | 288.63 | |
| WNM | 5.17 | 4.12 | 2.39 | 359.03 | 377.16 | |
| GSRM | 5.23 | 4.31 | 2.63 | 384.11 | 397.05 |
Table 9 Performance criteria for non-linear models utilizing asymmetric data
| Model | Model Equation | RMSE | MAE | BIAS | AIC | BIC |
| HAM | 4.18 | 3.17 | 0.00033 | 1141.67 | 1153.87 | |
| WNM | 4.24 | 3.25 | 0.00045 | 1154.39 | 1168.55 | |
| GSRM | 4.27 | 3.28 | 0.00069 | 1179.90 | 1185.72 | |
| (WNM Winsor model, GSRM Grosenbaugh model, HAM Haung model). | ||||||
3.2 Non-linear Models
The performance of non-linear models across symmetric and asymmetric distribution utilizing various selection criteria has been presented under Tables 8 and 9. Among non-linear models, Haung was found out to be the best non-linear model across both distributions as reflected from the values of RMSE, MAE etc.
\definecolorJK1cmyk0.87,0.54,0,0
Table 10 Performance criteria of linear models utilizing different validation techniques
| Models | Validation | RMSE | MAE | BIAS | AIC | BIC | PER |
| FDM | 50:50 | 0.90 | 0.54 | 0.26 | 144.91 | 163.52 | 1.49 |
| LOOCV | 0.88 | 0.42 | 0.18 | 144.15 | 160.09 | 1.30 | |
| 5-FOLDED | JK10.61 | JK10.33 | JK10.08 | JK1102.95 | JK1116.33 | JK10.55 | |
| PWRM | 50:50 | 0.99 | 0.72 | 0.29 | 435.85 | 464.03 | 1.11 |
| LOOCV | 0.91 | 0.50 | 0.20 | 433.91 | 440.78 | 1.08 | |
| 5-FOLDED | JK10.76 | JK10.39 | JK10.14 | JK1360.58 | JK1400.75 | JK10.66 | |
| TFEM | 50:50 | 1.03 | 0.79 | 0.094 | 468.69 | 477.92 | 0.82 |
| LOOCV | 0.97 | 0.58 | 0.06 | 453.51 | 469.17 | 0.77 | |
| 5-FOLDED | JK10.79 | JK10.41 | JK10.03 | JK1365.11 | JK1379.54 | JK10.42 | |
| (FDM First degree polynomial model, PWRM Power Model, TFEM Type I Exponential model). | |||||||
Evaluation of Validation Techniques
Symmetric Distribution
3.3 Linear Models
Different validation techniques like half splitting, LOOCV & 5-folded cross validation were used in this study. Table 10 reveals the performance criteria of FDM, PWRM and TFEM under various validation techniques in case of symmetric distribution. A perusal of the table revealed that 5-folded cross validation performs better in comparison to half splitting and LOOCV across all the three linear models in case of symmetric distribution as it revealed lower prediction error rate (PER).
3.4 Non-linear Models for
The performance criteria of HAM, WNM and GRSM under various validation techniques in case of symmetric distribution has been reveled under Table 11 and it again reveals that 5 folded cross validation performs better in comparison to its counter parts.
Table 11 Performance criteria of non-linear models utilizing different validation techniques
| Models | Validation | RMSE | MAE | BIAS | AIC | BIC | PER |
| HAM | 50:50 | 4.09 | 3.64 | 2.91 | 228.59 | 373.49 | 1.27 |
| LOOCV | 4.001 | 2.93 | 1.56 | 180.01 | 334.65 | 1.16 | |
| 5-FOLDED | JK13.84 | JK12.64 | JK10.77 | JK1140.91 | JK1299.33 | JK10.96 | |
| WNM | 50:50 | 4.77 | 3.66 | 2.28 | 397.54 | 310.36 | 1.82 |
| LOOCV | 4.52 | 3.33 | 1.71 | 365.27 | 297.11 | 1.51 | |
| 5-FOLDED | JK12.69 | JK12.53 | JK10.81 | JK1314.53 | JK1254.99 | JK10.87 | |
| GSRM | 50:50 | 3.52 | 2.97 | 1.98 | 144.91 | 291.33 | 1.98 |
| LOOCV | 2.91 | 2.08 | 1.637 | 144.15 | 221.23 | 1.75 | |
| 5-FOLDED | JK12.46 | JK11.67 | JK11.29 | JK1102.95 | JK1183.27 | JK11.06 | |
| (WNM Winsor model, GSRM Grosenbaugh model, HAM Haung model). | |||||||
Table 12 Performance criteria of linear models utilizing different validation techniques
| Models | Validation | RMSE | MAE | BIAS | AIC | BIC | PER |
| FDM | 50:50 | 5.52 | 3.97 | 1.35 | 180.77 | 291.33 | 1.85 |
| LOOCV | 3.91 | 3.08 | 1.02 | 195.72 | 221.23 | 1.51 | |
| 5-FOLDED | JK13.46 | JK12.67 | JK10.76 | JK1165.15 | JK1183.27 | JK10.79 | |
| PWRM | 50:50 | 5.50 | 3.92 | 0.75 | 924.98 | 937.21 | 2.75 |
| LOOCV | 3.86 | 2.81 | 0.26 | 670.89 | 685.49 | 2.67 | |
| 5-FOLDED | JK13.26 | JK12.39 | JK10.19 | JK1410.55 | JK1423.69 | JK11.29 | |
| TFEM | 50:50 | 4.03 | 3.18 | 0.35 | 577.01 | 595.29 | 2.92 |
| LOOCV | 3.52 | 2.73 | 0.22 | 560.58 | 583.69 | 2.91 | |
| 5-FOLDED | JK13.001 | JK12.16 | JK10.16 | JK1414.88 | JK1428.71 | JK11.86 | |
| (FDM First degree polynomial model, PWRM Power Model, TFEM Type I Exponential model). | |||||||
Asymmetric Distribution
3.5 Linear Models
The performance criteria of TFEM, PWRM &FDM under various validation techniques in case of asymmetric distribution is presented in Table 12 and again with respect to the validation techniques same results was found in this case, where 5-folded cross validation has an edge in comparison to rest of the validation techniques used in this study.
3.6 Non-linear Models
The performance criteria of WNM, GRSM and HAM under various validation techniques in case of asymmetric distribution has been presented in Table 13. It reveals that 5-folded cross validation performs better in comparison to half splitting and LOOCV.
Table 13 Performance criteria of non-linear models utilizing different validation techniques
| Models | Validation | RMSE | MAE | BIAS | AIC | BIC | PER |
| HAM | 50:50 | 2.50 | 1.78 | 0.09 | 196.51 | 217.89 | 0.96 |
| LOOCV | 2.39 | 1.54 | 0.06 | 161.32 | 198.51 | 0.79 | |
| 5-FOLDED | JK11.77 | JK11.01 | JK10.001 | JK1102.27 | JK1117.29 | JK10.33 | |
| WNM | 50:50 | 3.92 | 3.01 | 0.09 | 263.01 | 281.27 | 0.93 |
| LOOCV | 3.66 | 2.59 | 0.05 | 260.11 | 273.09 | 0.63 | |
| 5-FOLDED | JK12.12 | JK12.21 | JK10.01 | JK1198.06 | JK1205.33 | JK10.42 | |
| GSRM | 50:50 | 0.90 | 0.54 | 0.26 | 90.77 | 163.52 | 1.39 |
| LOOCV | 0.89 | 0.42 | 0.18 | 67.72 | 140.09 | 1.12 | |
| 5-FOLDED | JK10.61 | JK10.33 | JK10.07 | JK156.15 | JK1116.33 | JK10.59 | |
| (WNM Winsor model, GSRM Grosenbaugh model, HAM Haung model). | |||||||
Graphical Evaluation
The evaluation of validation techniques with respect to symmetric and asymmetric distribution were also accessed graphically with the help of library (ggplot2) in R studio. Different functions were developed to draw various multiplots, which are given in (Figures 1–6). Validation techniques in these multiplots are represented by three different colors (red color 5-folded, blue color LOOCV, green color HSP). The R codes developed for first degree polynomial model for plotting the multiplots on single window are given below.
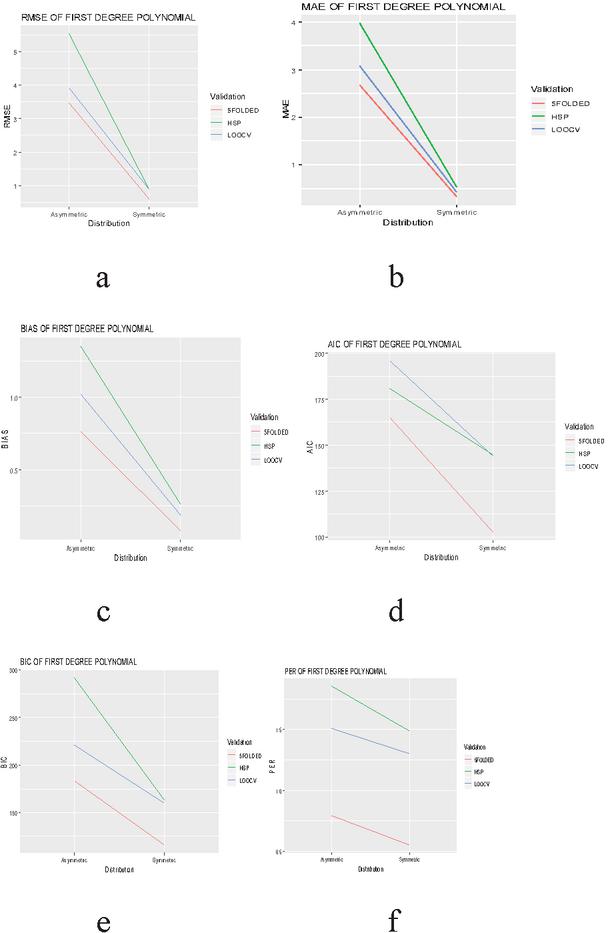
Figure 1 Evaluation of validation techniques for first degree polynomial model on the basis of different selection criteria and prediction error rate.
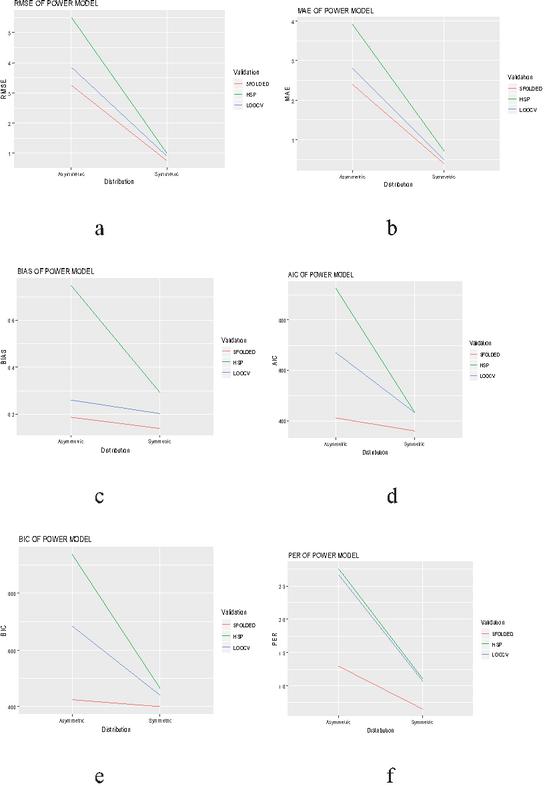
Figure 2 Evaluation of validation techniques for power model on the basis of different selection criteria and prediction error rate.
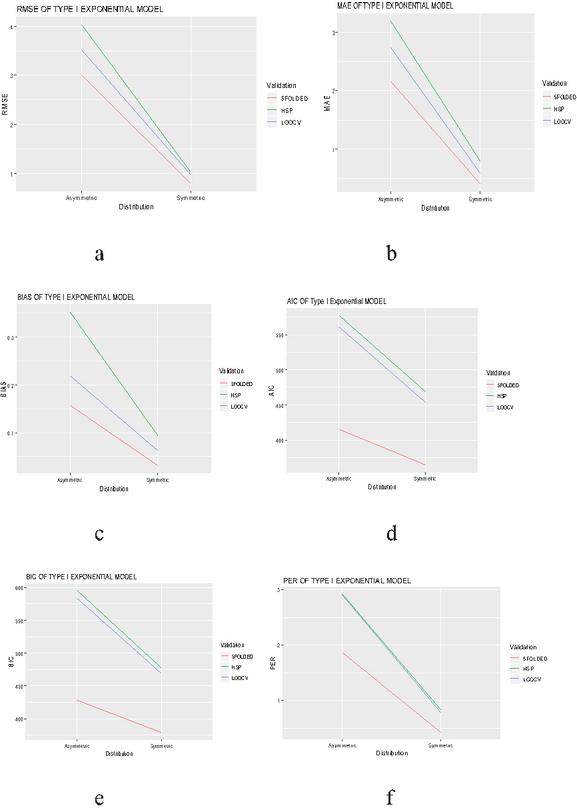
Figure 3 Evaluation of validation techniques for type first exponential model on the basis of different selection criteria and prediction error rate.
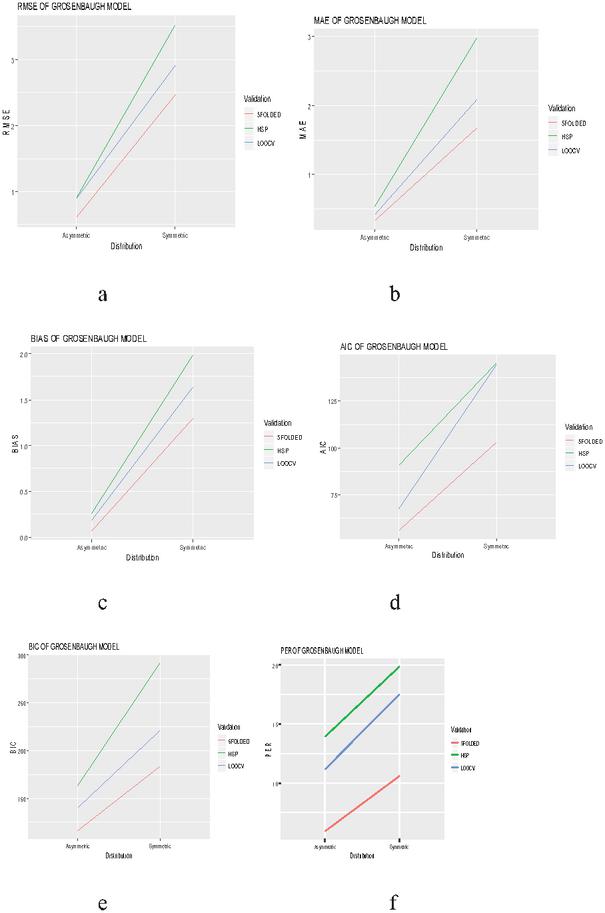
Figure 4 Evaluation of validation techniques for winsor model on the basis of different selection criteria and prediction error rate.
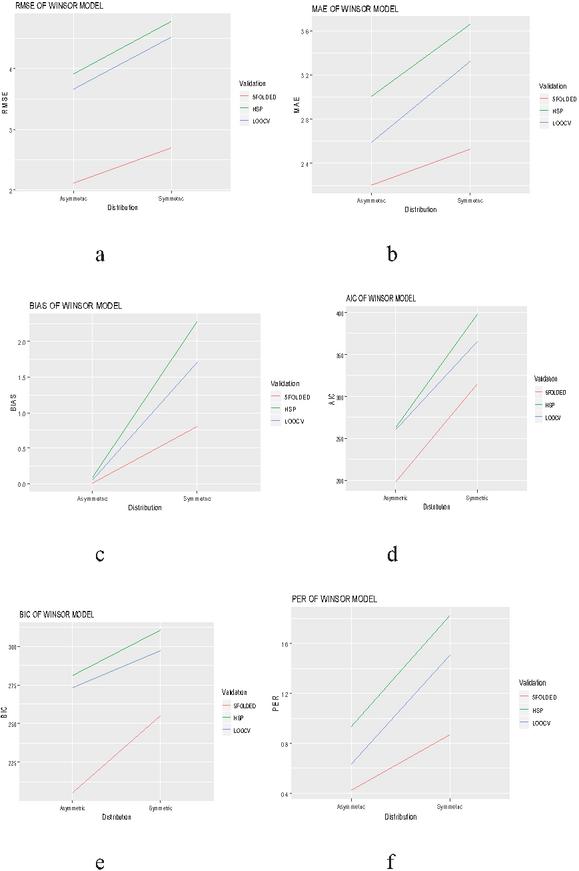
Figure 5 Evaluation of validation techniques for grosenbaugh model on the basis of different selection criteria and prediction error rate.
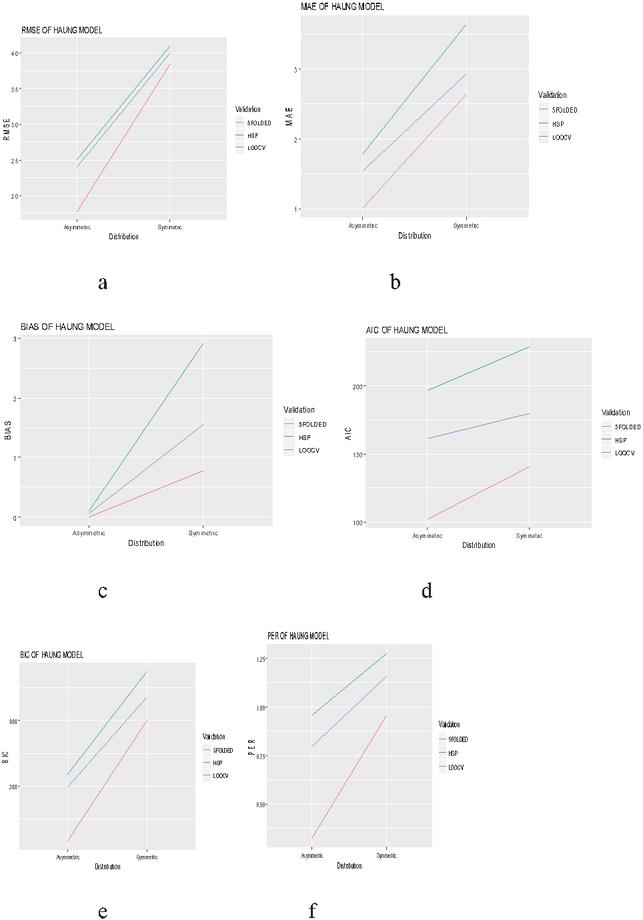
Figure 6 Evaluation of validation techniques for haung model on the basis of different selection criteria and prediction error rate.
Jackknife Technique
Apart from this, jackknife technique was also used for evaluation purpose, a perusal of jackknife method w.r.t other validation techniques across symmetric and asymmetric distribution is given in Table 14 only single selection criteria i.e. BIAS is used in this case, since the objective of jackknife is to estimate bias of statistics.
Table 14 Evaluation of validation techniques based on bias across symmetric and asymmetric distribution
| Models | Validation | Symmetric | Asymmetric |
| FDM | 50:50 | 0.26 | 1.35 |
| LOOCV | 0.18 | 1.02 | |
| JACKKNIFING | 0.15 | 0.97 | |
| 5-FOLDED | JK10.08 | JK10.73 | |
| PWRM | 50:50 | 0.29 | 0.75 |
| LOOCV | 0.20 | 0.26 | |
| JACKKNIFING | 0.17 | 0.23 | |
| 5-FOLDED | JK10.14 | JK10.19 | |
| TFEM | 50:50 | 0.094 | 0.35 |
| LOOCV | 0.04 | 0.22 | |
| JACKKNIFING | 0.04 | 0.20 | |
| 5-FOLDED | JK10.03 | JK10.16 | |
| HAM | 50:50 | 2.91 | 0.09 |
| LOOCV | 1.56 | 0.06 | |
| JACKKNIFING | 1.43 | 0.04 | |
| 5-FOLDED | JK10.77 | JK10.02 | |
| WNM | 50:50 | 2.28 | 0.09 |
| LOOCV | 1.71 | 0.05 | |
| JACKKNIFING | 1.53 | 0.04 | |
| 5-FOLDED | JK10.81 | JK10.03 | |
| GSRM | 50:50 | 1.98 | 0.26 |
| LOOCV | 1.64 | 0.18 | |
| JACKKNIFING | 1.51 | 0.15 | |
| 5-FOLDED | JK11.29 | JK10.07 |
4 Discussion
The present investigation was conducted on simulation data and various linear and non-linear statistical models were used in this study. Simulated data of 2000 observations were generated in R studio with respect to symmetric and asymmetric distribution.
4.1 Data Generation & Fitting of Models
At first stage simulated data of 2000 observations were generated in R studio with respect to symmetric and asymmetric distribution. Utilizing as matrix procedure of R various functions of R were developed to generate simulated data sets. Different models were fitted for symmetric and asymmetric distributions. Further, several selection criteria’s were used to assess the performance of the fitted models.
4.2 Linear Models
For symmetric and asymmetric distributions RMSE ranged from 4.23 to 6.96 and 0.96 to 1.13 respectively. Similar, for symmetrical distributions range for MAE, BIAS, AIC and BIC were 3.22 to 3.99, 0.82 to 1.95, 594.01 to 1150.63 and 603.90 to 1161.58, and 0.79 to 0.92, 0.30 to 0.74, 162.93 to 605.12 and 178.92 to 625.27 respectively. It can be concluded that the type first exponential model performed well in both symmetric and asymmetric distributions in case of linear models.
The classical approach having appropriate probability distributions in order to execute the model on the basis of observed data enforces us to switch towards the alternative methods due to such strict assumptions. For instance, an approach named as generalized estimating equations, (GEE) (Kowalski, 2007 and Tang, 2012) helps us to tackle such obstacles while doing a predictive modeling.Keeping the mixed effect model structure on the latent variable Chen et al. (1999) developed a skewed class of link models.
4.3 Non-linear Models
In case of symmetrical distribution RMSE, MAE, BIAS, AIC and BIC ranged from 2.99 to 5.23, 2.35 to 4.31, 0.98 to 2.63, 276.56 to 384.11 and 1141.67 to 1179.90 respectively. Similarly, the range for RMSE, MAE, BIAS, AIC and BIC were 4.18 to 4.27, 3.17 to 3.28, 0.00033 to 0.00069, 288.63 to 397.05 and 1153.87 to 1185.72 in case of asymmetric data. Thus, it demonstrates that Haung model (HAM) performed well in both symmetric and asymmetric distributions in case of nonlinear models.
The links for dichotomous regression models has been reviewed in case of asymmetrical distributions (Bazán et al. 2010). Further, there could be have increasing trend in mathematical errors and the wrong interpretation of the results while using the log transformation [Feng et al., 2014 and Hussaini et al., 2020].
For predictive ability we fitted several validation techniques and evaluated with reference to symmetry of the distribution. For the first degree polynomial model (FDM) prediction error rate varied from 1.49 to 0.55 and 1.85 to 0.79 in symmetric distribution and asymmetric distribution, with respectively having lowest prediction error rate in 5-folded cross validation as against to its counter parts and similar trend was found in case of power model (PWRM). The prediction error rate varied from 0.82 to 0.42 and 2.92 to 1.86 in symmetric distribution and asymmetric distribution for the case of type first exponential model (TFEM) respectively, and 5-folded cross validation resulted in lowest prediction error rate in comparison to other validation techniques. Similarly, 5-folded cross validation performed better in case of nonlinear models.
Applying 10-fold cross-validation for Grid-search on regularization estimates of the model (Hsu et al., 2010). In case of Haung model (HAM) prediction error rate varied from 1.27 to 0.95 and 0.96 to 0.33 in symmetric distribution and asymmetric distribution respectively, with lowest prediction error rate in 5-folded cross validation than other validation techniques. Further the estimates of prediction error rate in Winsor model (WNM) and Grosenbaugh model (GRSM) were also found lower in 5-folded cross validation.
The prediction error rate ranged from 0.42 to 1.49 and 0.87 to 1.98 among linear and non linear models with lowest prediction error rate in case of 5-folded cross validation respectively, under symmetric distribution, and 0.79 to 2.92 and 0.33 to 1.39 for asymmetric distribution. Based on the results of BIAS while considering Jackknife technique w.r.t other validation methods the results were again in favour of 5-folded cross validation, where BIAS varied from 0.03 to 0.29 and 0.16 to 1.35 in linear models in case of symmetric distribution asymmetric distribution respectively. As far as non-linear models are concerned the BIAS varied from 0.77 to 2.91 and 0.02 to 0.26 under symmetric distribution and asymmetric distribution respectively. Despite availability of several literature on asymmetric distributions like Bennett, 2003 and Kato et al., 2002 but cumbersome material is available to directly model class noise. Graphical evaluation of validation techniques on the basis of various selection criteria like RMSE, MAE, BIAS. etc were plotted in graphs. The validation techniques in these plots were represented red color represented five-folded cross validation, blue for LOOCV and green for half splitting.
The graphical evaluation of validation techniques used in the present study are given in Figures 1 to 6, where each figure is representative of six graphs depicting selection criteria and prediction error rate used in the present study. From the graphs we concluded 5-folded cross validation performs better than half splitting, leave on out cross validation (LOOCV), by giving lower prediction error rates for all statistical models.
5 Conclusion
In this study, all the estimates of models used were significant, which means all the models were well fitted and total of 2000 observations were simulated with respect to symmetric and asymmetric distributions. Among linear models, based on selection criteria Type first exponential model was found to be best linear model in both symmetric as well as asymmetric datasets as it has the lowest values of RMSE, MAE, BIAS, AIC & BIC. Amid non-linear models, based on selection criteria Haung model was found to be best non-linear model in both symmetric as well as asymmetric datasets. Under validation methods, in case symmetric distribution type first exponential model and first degree polynomial were found to be best linear model in symmetric and asymmetric distribution. As per the prediction error rate, Winsor model and Haung model were found to be best linear models for symmetric and asymmetric distribution. As far as evaluation of validation techniques are concerned 5-folded validation was found to be best in comparison to its counter parts as it has lower prediction error rates.In case of asymmetric distribution prediction error rate speckled from 0.79 to 2.92 in case of linear models and the lowest prediction error rate was found in 5-folded cross validation. Underneath asymmetric distribution prediction error rate mottled from 0.33 to 1.39 in case of non-linear models and again the results of prediction error rate were in favour of 5-folded cross validation in case of non-linear models. Hence it is concluded 5-folded cross validation should be preferred whenever we have choice and it evaluates the model performance on different subsets, of the training data. In contrast to LOOCV and jackknife, where model performance is tested at each iteration, which results in higher prediction error rates in former and higher values of BIAS in later, especially when data points are outliers, 5-folded cross validation provides solution under such circumstances by taking a good ratio of testing data points. The prediction error in 5-folded cross validation in comparison to half splitting is that every subset of data is used as training as well as testing data. Thus we can conclude that the study can be a benchmark for policy makers, as formulation and initiation of economic policy and planning becomes easy if data sets are analysed in advance which requires fitting and validation of various statistical models.
References
Bazán, J.L., Bolfarine, H., Branco, M.D. (2010): A framework for skew-probit links in binary regression. Commun. Stat. Theory Methods 39, 678–697.
Bennett, P. N. (2003): Using Asymmetric Distributions to Improve Text Classifier Probability Estimates. In SIGIR ’03: Proceedings of the 26th annual international ACM SIGIR conference on Research and development in informaion retrieval, 111–118.
Biging (eds) Forest Simulation Systems, Proc. of IUFRO Conf., 2–5 Nov. 1988. Univ. Calif., Div. Agric. and Nat. Res., Bulletin 1927, pp. 81–88.
Burk, T.E. (1990): Prediction error evaluation: preliminary results. In L.C. Wensel and G.S. Chen, M.H., Dey, D.K., Shao, Q.M. (1999): A new skewed link model for dichotomous quantal response data. J. Am. Stat. Assoc. 94(448), 1172–1186
Efron, B. and Gong, G., (1983): A leisurely look at the bootstrap, the jackknife and crossvalidation. Amer. Statist. 37:36–48.
Feng, C., Wang, H., Lu, N., Chen, T., He, H., Lu, Y. (2014): Log-transformation and its implications for data analysis. Shanghai Arch. Psychiatry, 26, 105.
Hassani, H., Yeganegi, M.R., Khan, A., Silva, E.S. (2020): The effect of data transformation on singular spectrum analysis for forecasting. Signals, 1, 2.
Hsu, C.-w., Chang, C.-c., and Lin, C.-j. (2010): A Practical Guide to Support Vector Classification.
Hirsch, R.P. (1991) Validation samples. Biometrics 47:1193–1194.
Kato, T., Omachi, S., and Aso, H. (2002): Asymmetric Gaussian and Its Application to Pattern Recognition. In Structural, Syntactic, and Statistical Pattern Recognition, volume 2396 of Lecture Notes in Computer Science. 405–413.
Kowalski J, Tu XM. (2007): Modern Applied U Statistics. New York: Wiley.
Larson, S. (1931): The shrinkage of the coefficient of multiple correlations. Journal of Educational Psychology, 22(1): 45–55.
Mosteller, F. and Turkey, J.W. (1968): Data Analysis, Including Statistics. In Handbook of Social Psycholog, Addison-Wesley. pp. 601–720.
Shifley, S.R. (1987): A generalized system of models forecasting Central States growth. USDA For. Serv., Res. Pap. NC-279. 10 p.
Snee, R. D. (1977): Validation of regression models: Methods and examples. Technometrics, 19: 415–428.
Tang W, He H, Tu XM. (2012): Applied categorical and count data analysis. FL: Chapman & Hall/CRC .
Tarp-Johansen, M.J., Skovsgaard, J.P., Madsen, S.F., Johannsen, V.K. and Skovgaard, I. (1996): Compatible stem taper and stem volume functions for oak in Denmark. Annales des Sciences Forestières, in press.
Vanclay, J. K. (1994): Modelling forest growth: Application to mixed tropical forests. CAB International, Wallingford.
Weisberg, S. (1985): Applied Linear Regression, 2nd ed. Wiley, NY, xiv+324 pp.
Biographies

M. Iqbal Jeelani is working as an Assistant Professor of Statistics at Division of Statistics and Computer Sciences, Faculty of Basic Sciences, Sher-e-Kashmir University of Agricultural Sciences & Technology of Jammu, J&K, India. He has obtained his B.Sc degree in Forestry from Wadura College, Sher-e-Kashmir University of Agricultural Sciences & Technology of Kashmir, J&K, India in 2008 and M. Sc (2011), Ph. D (2014) in Agricultural Statistics from Division of Agricultural Statistics, SKUAST-Kashmir and is a receipt of Gold Medal in M.Sc. Dr. Jeelani has research specialization in Applied Statistics and is well versed with R-software. Besides engaged in teaching undergraduate and postgraduate students, he has published large number of papers in reputed international and National journals of Statistics. Further, he has guided various postgraduate students in the field of Statistics as Major Advisor.

Faizan Danish is currently working as a Postdoctoral Fellow in Division of Biostatistics, Department of Population Health, School of Medicine, New York University, New York, 10016, USA. He has received Doctor of Philosophy (Ph.D.) in Statistics with specialization in Sampling Theory and Operations Research from Division of Statistics and Computer Sciences, Faculty of Basic Sciences, Sher-e-Kashmir University of Agricultural Sciences & Technology of Jammu, J&K, India and has graduated in Mathematics, Statistics and Economics from University of Kashmir, J&K, India. Dr. Danish has around 2 years of teaching experience and published around 25 research papers in reputed journals. Further, he has worked as Biostatiscian under Research Consultation Services, Doha Qatar. He has research expertise in Sampling Theory, Mathematical Programming, Applied Statistics and Biostatistics. Dr. Danish has proposed several methods for obtaining stratification points utilizing the classical technique as well as Mathematical Programming approach. Dr. Danish is well versed with Statistical Software’s: R, STATA, SPSS, Python Matlab, Fortran 77, O.P STAT, WINDOSTAT, Mathematica etc and have completed several online courses related to software’s from prominent global universities. Dr. Danish is a respected member of several statistical associations such as American Statistical Association, Institute of Mathematical Statistics, International Indian Statistical Association and others, and reviewer of several reputed journals.

Saquib Khan is pursuing Master’s degree in Statistics in Division of Statistics and Computer Sciences, Faculty of Basic Sciences, Sher-e-Kashmir University of Agricultural Sciences & Technology of Jammu, J&K, India. He is working in Applied statistics utilizing the Cross Validation technique to choose different models suitable for several data sets. He has done his Bachelor’s in Agriculture from SKUAST-Jammu. Mr. Saquib is trying to explore the Applied Statistics utilizing different platforms.
Journal of Reliability and Statistical Studies, Vol. 15, Issue 1 (2022), 37–60.
doi: 10.13052/jrss0974-8024.1513
© 2022 River Publishers