Modified Mixed Exponentially Weighted Moving Average-Cumulative Sum Control Charts for Autocorrelated Process
Dushyant Tyagi and Vipin Yadav*
Dr. Shakuntala Misra National Rehabilitation University, Lucknow, India
E-mail: dtyagi@dsmnru.ac.in; vipindsmnru@gmail.com
Corresponding Author
Received 11 March 2021; Accepted 02 August 2021; Publication 14 September 2021
Abstract
Statistical Process Control (SPC) is an efficient methodology for monitoring, managing, analysing and recuperating process performance. Implementation of SPC in industries results in biggest benefits, as enhanced quality products and reduced process variation. While dealing with the theory of control chart we generally move with the assumption of independent process observation. But in practice usually, for most of the processes the observations are autocorrelated which degrades the ability of control chart application. The loss caused by autocorrelation can be obliterated by making modifications in the traditional control charts. The article presented here refers to a combination of EWMA and CUSUM charting techniques supplementing modifications in the control limits. The performance of the referred scheme is measured by comparing average run length (ARL) with existing control charts. Also, the referred scheme is found reasonably well for detecting particularly smaller displacements in the process.
Keywords: Statistical process control (SPC), autocorrelation, control chart, average run length (ARL), modified mixed EWMA-CUSUM.
1 Introduction
In any manufacturing environment, the probability of two items being exactly similar is zero. All manufacturing and production processes exhibit variations which can be grouped into two categories, generally known as common cause and assignable (special) cause variations. Variations in any process caused by common cause only, the process is defined to be statistically in-control process. But, if the disparities in the process are caused by the both (common and assignable) causes then it gives rise to the statistically out of control process. SPC tools and procedures are used to control and monitor variations in process parameters or production method. Among various tools and procedures, control charts are renowned and principal tool of the Statistical Process Control. Initially in 1920s, Walter A. Shewhart applied control charts in the field of manufacturing industry to monitor process behavior. The three control schemes listed below are generally used control schemes in the theoretical application of SPC.
(i) Shewhart control scheme
(ii) Exponential Weighted Moving Average (EWMA) control scheme
(iii) Cumulative Sum (CUSUM) control scheme.
A primary assumption while exercising with control charts is that the process observations distributed normally and independently when the process under study is statistically in-control. When the above assumptions are justified, the traditional control charts can be used. But mostly, process produces observations which does not follow the assumption of independence observation. Many process observations inherently exhibit autocorrelation or serial dependence. Even, the lower degree of autocorrelation can retrograde the properties of standard control schemes. Process exhibiting autocorrelation ruins the functioning of control chart by producing incessant false signals or respond gradually to out-of-control state. The consequence of autocorrelation on different charting techniques have been studied by numerous researchers.
Johnson and Bagshaw [9] and Bagshaw and Johnson [5] have examined the run length distribution of the cumulative sum (CUSUM) when observation possess autocorrelation for autoregressive and moving average processes of order one. According to them, “the chart is not robust with respect to departures from independence”. ARL means: “average number of observations considered before a signal occurs showing the state of process to out-of-control”. The performance ability of control chart is evaluated by ARL and in the presence of autocorrelation it is not calculated properly. Harris and Ross [7] examined, “the consequence of autocorrelation on the ARL and median run length (MRL) of CUSUM and EWMA charts”. Alwan [4] discussed the impact of autocorrelation of the process observation and stated that presence of autocorrelation can reduce the detection ability of the special cause by increasing a number of false signals. The major impact of autocorrelation in quality control is that it gives rise to much tighter control limits than required.
We have various methods that can be used to get rid of the effect caused by autocorrelation, A common approach to eliminate the effect of autocorrelation is less frequently sampling of observations from the process. But there is drawback of this approach because with the limited information the process may not detect changes which can reduce the performance of control charts (Zhong [26]). Beyond this approach, two general methods in literature are often used to control the influence of autocorrelation. These two approaches are modified chart approach and residual chart approach. Former approach involves the use of control charts with accustomed control limits to neutralize influence of autocorrelation. Latter approach directs us to employ control charts to the residuals which we obtained by featuring a time-series model to process observations possessing autocorrelation.
Alwan and Roberts [3] applied a time-series modelling to the observations and after obtaining the residuals to which standard control schemes administered to reduce the effect of autocorrelation. Harris and Ross [7] mentioned: “ignoring autocorrelation may malfunction the performance of the chart”.
Lucas [13] states: “Adding Shewhart limits to a CUSUM control scheme can give an improved ARL curve as the combined scheme can be designed to detect more quickly large displacements of the mean with only small changes either in the speed of detecting small displacements or the in the in-control ARL”. R. Osei-Anning et al. [18] developed: “the mixed EWMA-CUSUM and mixed CUSUM-EWMA modified charts in presence of autocorrelation and compared the performance of the proposed scheme to the existing Shewhart, CUSUM, EWMA, combined Shewhart-CUSUM and combine Shewhart-EWMA control chart schemes”.
Vanbrackle and Reynolds [23] considers: “the EWMA and CUSUM control charts for the process mean when the observations are from an AR(1) process with additional random error”. Vasilopoulos and Stamboulis [24], “modifies and extends the existing standard methodology by utilizing the time series analysis approach showing the substantial effect of dependence on the classical quality control factors”. Schmid [21] examined: “the run length of the Shewhart chart for the correlated data”.
The remaining article is planned in the following manner: In next section, the modelling of autocorrelated process is discussed. Section 3 considers the simple design scheme of the EWMA and CUSUM type control charts. Suggested modified mixed EWMA-CUSUM scheme is discussed in Section 4. We compared the suggested modified chart with other previously defined control schemes and conclude the findings of the paper in the last section.
2 Models for Autocorrelated Process Data
The standard assumptions in implementing control schemes: “the data generated by the process are normally and independently distributed with constant mean and variance”. So, we can write the process observation at time t, as:
| (1) |
where indicates the mean of the process which we assume fixed at some target value during in-control process and it may shift to some different value as soon as assignable cause occurs and the indicates the independent random variables with constant mean and variance.
For modelling process data for an autocorrelated process, a relatively simple model may be
| (2) |
where denotes the mean of the process at time t. Here, assumption is made that the mean is drifting continuously over time and is not a fixed constant. In particular, when the state of process is in-control the mean drifts according to a time series model. The model in (2) has been used previously in various places to accommodate autocorrelated data. If follows (2) then the variance of can be attributed to the variance of mean . The variance triggered by can be regarded as short-term variability or measurement error. The overall mean will be represented by to differentiate between and the overall mean . Here follows the following form of the AR(1) process:
| (3) |
indicates autoregressive parameter with . is random shock follows . Also, there is no impact of on random shock. The preliminary value, is normally distributed having mean and variance
| (4) |
which implies that follows where for all
In several instances while working with this model, it has been beneficial to take into account the share of process variances caused by and . Thus,
| (5) |
is considered to be the share of the process variance caused by mean . So, the variance proportion caused by is . The covariance between two head-to-head observations, say and , is and this indicates that the correlation between and is
| (6) |
According to Box, Jenkins and Reinsel [6], “The AR(1) process plus an extra random error component is similar to ARMA.(1, 1) process” which can be written as:
| (7) |
Here is moving average parameter, s are independently distributed as , and are same as mentioned above and B denotes backshift operator such that . In many situations, the AR. (1) model with plus an extra random error component may be helpful in illustrating the process observations but parameter estimation approach is generally articulated with regard to ARMA (1, 1) model.
3 Traditional CUSUM and EWMA Charts
A drawback of applying Shewhart charting techniques is that it utilizes the information from the current measurements only for drawing conclusions regarding the process and neglect all other piece of information obtained by the whole points. This make Shewhart control charts insensitive to detect smaller process shift, in particular, shift of 1.5 standard deviation or less. This section considers those control charts which is based on information from all the previous observations as well as the current observations. The control chart procedures which mainly used in this category are EWMA and CUSUM and here we discuss some details of their traditional design structures.
3.1 Traditional CUSUM Control Charts
Statistical Quality Control (SQC) is one of the most important means of detecting assignable cause of variation and it measures and records the data against specific rquirements and ensures that the product conforms to the required standards. In SQC, the CUSUM technique was first introduced by E. S. Page of the University of Cambridge. CUSUM chart improves the detection ability of small shifts (i.e., less than 1.5) in the process by a statistic that combines information from both the current and previous observations from the process. Specifically, the CUSUM control charts measure the cumulative sums of the deviations of the sample values from target value. There are two CUSUM technique by which we can check the state of any process:
i. The tabular CUSUM technique
ii. The V-mask procedure
Out of these two forms, the V-mask procedure is less preferable. The tabular form of the CUSUM is practiced more which can be built for average of rational subgroups as well as for individual information.
If the process is in statistical control, let us consider , the ith process observation is distributed (either is known or its estimate is available). Oftenly is taken as a target value for Y.
The tabular form of CUSUM is executed by accruing deviations from the target value with the help of two statistics and . These statistics and termed as one-sided upper and one-sided lower CUSUM respectively. These two statistics are given as:
| (8) |
The is generally known as reference value and we consider its value equal to half of the shift in unit of standard deviation. The initial value of the statistics and is set to 0 i.e., . We plot these one-sided upper and lower statistics versus the control limit where . If any one of the statistics surpasses the , the process will be out of control otherwise in statistical control. The appropriate selection of parameters and of the CUSUM scheme is very necessary as it has major impact on the ARL values.
3.2 Traditional EWMA Control Charts
S.W. Roberts introduced the EWMA control scheme. The EWMA control scheme is also helpful while dealing with the problem of shifts in the process mean. This scheme incorporates not only past information but also the current information and the mass involved with the process data decline exponentially as the process observation become less recent. We define as:
| (9) |
here i symbolizes sample number and is an invariable quantity satisfying The preliminary value is considered as the process target i.e., .
Occasionally the mean of the prior information is used as preliminary value of the EWMA. The control limits for EWMA control chart is given by:
| (10) |
here denotes the standard deviation of quality characteristic under study and represents the width of control limit.
3.3 Adjustments in Traditional CUSUM and EWMA Control Charts
In traditional EWMA and CUSUM charts, several alterations have been proposed with an aim to improve the performance of both the charts. Lucas and Crossier [14] illustrated: “the fast initial response (FIR) for CUSUM quality control scheme in which the CUSUM is not reset to zero at start-up or after an out-of-control signal given by CUSUM, and a head start is provided to the CUSUM statistic by allocating starting value of the CUSUM statistic to some non-zero positive value”. According to Yaschin [25]: “the weighted CUSUM scheme in which he gives unlike weights to the preliminary data used in CUSUM statistic”. Riaz et al. [20] compared, “the performance of CUSUM based on run rules scheme and classical CUSUM and they noted that run rules-based CUSUM chart performs better than classical CUSUM chart for small shifts”. Steiner [22] suggested: “FIR EWMA (like FIR CUSUM) by giving a head start value to the EWMA statistic and hence upgrade the performance of EWMA charts”. Lucas and Saccucci [15] suggested: “the combined Shewhart-EWMA control chart procedure which gives the better ARL performance for small shifts”. Abbas et al. [1] compared: “the performance of EWMA control chart based on run rules scheme and standard EWMA chart and they found that run rules-based EWMA chart performs better for small shifts than classical EWMA chart”.
4 Proposed Modified Mixed EWMA-CUSUM (MMEC) Control Chart Scheme
This section suggested modifications in the conglomeration of the conventional EWMA and CUSUM control scheme. Obviously, combining the design structure of CUSUM and EWMA charts in a single composition aimed to upsurge the detection ability of the charts, particularly for smaller displacements in the process.
The suggested scheme is defined as:
First determine EWMA statistic as
| (11) |
from the observation of quality characteristic under study where are autocorrelated observations for AR(1) process with an additional random error as discussed in Section 3. Here is constant like used in classical EWMA statistic in Equation (9) satisfying The preliminary value of the EWMA statistic is taken equal to the value of target mean . The mean and variance of the statistic is expressed as follows:
| (12) |
Then the CUSUM statistic is determined by
| (13) |
where denotes reference value of proposed scheme which fluctuates with the time due to the standard deviation of The quantities and are called one sided upper CUSUM and one sided lower CUSUM statistics respectively. The starting value of these statistics are set to 0 that is
The parameters of our suggested scheme can be calculated with the help of mean and variance of . and denotes the mean and standard deviation of the population respectively. If and are unknown, we can estimate them using preliminary data.
Here we deal with the case of single observation that is n 1. This control scheme can also be used for the case of subgroups that is for n greater than unity. We plot the upper () and lower () statistic versus control limit denoted as . Both parameters and varies with time due to the impact of variance of the EWMA statistic . The values of these two parameters are defined as:
| (14) |
The constant and resembles with the constant and respectively of classical CUSUM scheme. The process is defined to be in statistical control if the and are plotted within control limits otherwise the process is defined to be out of control. It is also seen here, if the statistic exceeds the control limit , it means the process has displaced above the target value and if the statistic exceeds the control limit , it means that process has displaced below the target value.
By fixing value of the one constant , we select the value of other constant in such a way that the get fixed at our desired level. Generally, the value of is taken as one-half of the shift in terms of standard deviation. So the constant is choosen in such a way that it crafts the proposed scheme more sensitive not for small shifts only but also for moderate shifts. The following table gives the values of ARL at a 0.5 along with different values of the parameter and denotes the volume of shift (in standard units) in the process mean. All ARL values are calculated using simulation method, the programs for simulation and graphs have been developed in R-software.
Table 1 ARL of the suggested Scheme at and
| b | 0.1 | 0.2 | 0.3 | 0.4 | 0.5 | 0.6 | 0.7 | 0.8 | 0.9 | 1 | |||
| 17 | 631.2 | 211.72 | 94.51 | 53.32 | 35.24 | 25.93 | 20.54 | 17.03 | 14.52 | 12.72 | 11.35 | ||
| 0 | – | 19 | 823.49 | 258.68 | 107.01 | 59.25 | 38.93 | 28.48 | 22.34 | 18.49 | 15.82 | 13.82 | 12.34 |
| 21 | 1150.27 | 314.48 | 124.49 | 65.41 | 42.56 | 30.89 | 24.33 | 19.98 | 17.06 | 14.92 | 13.31 | ||
| 23 | 1467.92 | 384.06 | 139.77 | 72.27 | 45.89 | 33.34 | 26.06 | 21.51 | 18.32 | 16.01 | 14.28 | ||
| 17 | 544.29 | 197.31 | 91.98 | 52.87 | 35.12 | 26.02 | 20.54 | 17.02 | 14.55 | 12.76 | 11.37 | ||
| 0.2 | 0.1 | 19 | 721.98 | 245.21 | 105.38 | 59.11 | 38.61 | 28.52 | 22.43 | 18.56 | 15.84 | 13.85 | 12.36 |
| 21 | 1003.02 | 293.42 | 120.18 | 64.88 | 42.14 | 30.93 | 24.30 | 20.06 | 17.12 | 14.95 | 13.32 | ||
| 23 | 1288.86 | 354.24 | 136.77 | 71.44 | 45.97 | 33.52 | 26.12 | 21.51 | 18.35 | 16.06 | 14.29 | ||
| 17 | 379.44 | 163.91 | 83.76 | 50.34 | 34.92 | 26.13 | 20.78 | 17.2 | 14.72 | 12.91 | 11.50 | ||
| 0.2 | 0.5 | 19 | 506.16 | 194.74 | 97.33 | 56.94 | 38.38 | 28.47 | 22.68 | 18.69 | 16.01 | 13.99 | 12.46 |
| 21 | 627.55 | 233.94 | 108.36 | 62.68 | 42.03 | 30.93 | 24.46 | 20.23 | 17.27 | 15.09 | 13.44 | ||
| 23 | 840.66 | 277.60 | 122.86 | 68.57 | 45.51 | 33.41 | 26.27 | 21.74 | 18.53 | 16.21 | 14.42 | ||
| 17 | 293.06 | 137.31 | 77.45 | 48.99 | 34.48 | 26.08 | 20.83 | 17.34 | 14.86 | 13.01 | 11.61 | ||
| 0.2 | 0.9 | 19 | 367.45 | 164.82 | 88.73 | 55.03 | 37.91 | 28.57 | 22.71 | 18.85 | 16.13 | 14.10 | 12.57 |
| 21 | 478.51 | 196.54 | 99.85 | 60.82 | 41.49 | 31.04 | 24.54 | 20.39 | 17.40 | 15.21 | 13.55 | ||
| 23 | 583.34 | 229.53 | 112.16 | 66.20 | 44.91 | 33.34 | 26.42 | 21.89 | 18.64 | 16.33 | 14.51 | ||
| 17 | 465.89 | 182.58 | 88.46 | 51.76 | 35.18 | 26.07 | 20.73 | 17.07 | 14.64 | 12.81 | 11.44 | ||
| 0.4 | 0.1 | 19 | 609.64 | 219.68 | 101.38 | 58.61 | 38.66 | 28.62 | 22.52 | 18.65 | 15.91 | 13.92 | 12.42 |
| 21 | 816.74 | 263.78 | 114.34 | 64.38 | 42.32 | 31.03 | 24.37 | 20.12 | 17.19 | 15.02 | 13.38 | ||
| 23 | 1045.69 | 314.54 | 133.54 | 70.58 | 45.71 | 33.46 | 26.26 | 21.63 | 18.42 | 16.11 | 14.36 | ||
| 17 | 236.7 | 123.52 | 72.82 | 47.92 | 34.3 | 26.24 | 21.03 | 17.53 | 15.02 | 13.17 | 11.73 | ||
| 0.4 | 0.5 | 19 | 293.38 | 146.72 | 82.99 | 53.32 | 37.79 | 28.71 | 22.9 | 19.07 | 16.33 | 14.28 | 12.71 |
| 21 | 361.86 | 170.95 | 93.31 | 58.45 | 41.36 | 31.04 | 24.71 | 20.52 | 17.58 | 15.39 | 13.69 | ||
| 23 | 440.48 | 195.24 | 104.36 | 64.75 | 44.73 | 33.6 | 26.67 | 22.05 | 18.85 | 16.5 | 14.66 | ||
| 17 | 160.93 | 96.98 | 63.16 | 44.74 | 33.31 | 26.14 | 21.29 | 17.83 | 15.35 | 13.47 | 11.98 | ||
| 19 | 193.28 | 113.69 | 72.01 | 49.84 | 36.79 | 28.51 | 23.15 | 19.36 | 16.61 | 14.57 | 12.97 | ||
| 0.4 | 0.9 | 21 | 233.93 | 128.56 | 80.97 | 54.97 | 40.23 | 30.95 | 24.95 | 20.92 | 17.93 | 15.68 | 13.97 |
| 23 | 279.08 | 148.98 | 89.66 | 59.88 | 43.34 | 33.33 | 26.82 | 22.46 | 19.15 | 16.79 | 14.89 | ||
| 17 | 371.28 | 159.26 | 83.42 | 50.95 | 35.35 | 26.28 | 20.87 | 17.27 | 14.80 | 12.95 | 11.54 | ||
| 0.6 | 0.1 | 19 | 475.15 | 190.80 | 95.44 | 56.79 | 38.61 | 28.71 | 22.81 | 18.80 | 16.12 | 14.05 | 12.50 |
| 21 | 616.82 | 223.06 | 108.02 | 63.32 | 42.19 | 31.15 | 24.63 | 20.31 | 17.36 | 15.12 | 13.49 | ||
| 23 | 772.98 | 272.37 | 123.21 | 69.05 | 45.64 | 33.55 | 26.46 | 21.87 | 18.58 | 16.25 | 14.44 | ||
| 17 | 148.04 | 93.11 | 62.46 | 44.4 | 33.56 | 26.52 | 21.71 | 18.18 | 15.63 | 13.72 | 12.17 | ||
| 0.6 | 0.5 | 19 | 178.39 | 105.92 | 70.12 | 49.68 | 37.12 | 29.01 | 23.50 | 19.7 | 16.96 | 14.78 | 13.18 |
| 21 | 207.79 | 121.75 | 78.99 | 54.32 | 40.17 | 31.37 | 25.36 | 21.31 | 18.22 | 15.95 | 14.11 | ||
| 23 | 243.9 | 137.04 | 87.23 | 59.57 | 43.81 | 33.87 | 27.29 | 22.76 | 19.50 | 17.01 | 15.14 | ||
| 17 | 100.42 | 71.19 | 53.01 | 40.44 | 32.14 | 26.18 | 21.89 | 18.67 | 16.21 | 14.21 | 12.68 | ||
| 0.6 | 0.9 | 19 | 115.13 | 80.86 | 58.98 | 44.91 | 35.14 | 28.61 | 23.79 | 20.22 | 17.47 | 15.37 | 13.68 |
| 21 | 132.88 | 91.24 | 64.94 | 48.98 | 38.16 | 30.99 | 25.61 | 21.82 | 18.75 | 16.51 | 14.67 | ||
| 23 | 151.64 | 100.01 | 72.41 | 53.31 | 41.71 | 33.28 | 27.42 | 23.27 | 20.04 | 17.57 | 15.66 | ||
| 17 | 247.41 | 130.86 | 77.09 | 50.41 | 35.83 | 27.12 | 21.65 | 17.91 | 15.24 | 13.26 | 11.76 | ||
| 0.8 | 0.1 | 19 | 309.97 | 152.61 | 87.49 | 55.72 | 39.10 | 29.63 | 23.49 | 19.45 | 16.52 | 14.39 | 12.76 |
| 21 | 374.10 | 176.07 | 98.01 | 61.51 | 42.71 | 32.08 | 25.41 | 20.98 | 17.85 | 15.51 | 13.77 | ||
| 23 | 457.65 | 203.47 | 108.7 | 66.98 | 46.39 | 34.41 | 27.32 | 22.45 | 19.08 | 16.61 | 14.73 | ||
| 17 | 97.50 | 72.53 | 55.06 | 42.91 | 34.39 | 28.10 | 23.52 | 19.91 | 17.06 | 14.94 | 13.25 | ||
| 0.8 | 0.5 | 19 | 109.75 | 80.28 | 60.89 | 46.86 | 37.51 | 30.23 | 25.34 | 21.47 | 18.47 | 16.15 | 14.28 |
| 21 | 124.41 | 88.85 | 66.62 | 51.11 | 40.34 | 32.81 | 27.15 | 23.05 | 19.82 | 17.29 | 15.27 | ||
| 23 | 139.17 | 98.54 | 72.09 | 55.11 | 43.13 | 35.09 | 29.09 | 24.55 | 21.08 | 18.47 | 16.31 | ||
| 17 | 72.25 | 58.24 | 47.28 | 39.17 | 32.93 | 27.87 | 23.81 | 20.72 | 18.09 | 15.94 | 14.21 | ||
| 0.8 | 0.9 | 19 | 79.27 | 63.87 | 51.44 | 42.56 | 35.41 | 29.95 | 25.62 | 22.16 | 19.47 | 17.18 | 15.28 |
| 21 | 87.45 | 68.46 | 55.68 | 45.81 | 38.32 | 32.19 | 27.46 | 23.85 | 20.84 | 18.42 | 16.29 | ||
| 23 | 95.51 | 75.16 | 60.07 | 49.25 | 40.91 | 34.47 | 29.39 | 25.32 | 22.23 | 19.59 | 17.41 | ||
5 Comparison and Conclusion
In this section, our suggested scheme has been compared with some previously defined control schemes. The model given in (2) and (3) may fit a number of observations produced by autocorrelated processes. With the help of ARL, we see how well a control chart performs. The ARL values of our suggested scheme has been arranged in Table 1 which is compared with the results given by Vanbrackle and Reynolds [23]. According to them :“ARL of the EWMA is greatly affected by the autocorrelation as it reduced the detection time for small to moderate shifts away from the target and increased the detection time for large shifts.”
Table 2 ARL of the EWMA control scheme of observation for autocorrelated process of Lu, C.W. and Reynolds, Jr, M.R. [10]
| c | 0.1 | 0.2 | 0.3 | 0.4 | 0.5 | 0.6 | 0.7 | 0.8 | 0.9 | 1 | ||||
| 3.085 | 0.4 | 0.5 | 0.05 | 368.52 | 262.2 | 138.68 | 80.73 | 52.85 | 37.81 | 28.92 | 23.22 | 19.34 | 16.52 | 14.37 |
| 3.289 | 0.1 | 375.28 | 281.28 | 165.05 | 97.69 | 61.74 | 42.41 | 31.11 | 23.98 | 19.23 | 15.96 | 13.55 | ||
| 3.375 | 0.15 | 378.52 | 306.59 | 191.82 | 115.96 | 73.46 | 49.32 | 35.31 | 26.53 | 20.74 | 16.71 | 13.90 | ||
| 3.391 | 0.2 | 370.19 | 304.11 | 207.42 | 127.78 | 82.24 | 55.65 | 39.23 | 29.07 | 22.33 | 17.67 | 14.48 | ||
| 3.394 | 0.25 | 367.24 | 317.25 | 216.44 | 143.28 | 91.15 | 62.12 | 43.72 | 32.01 | 24.42 | 19.13 | 15.41 | ||
| 3.387 | 0.3 | 373.57 | 315.56 | 229.17 | 152.31 | 100.81 | 68.99 | 48.66 | 35.55 | 26.91 | 20.75 | 16.61 | ||
| 3.375 | 0.35 | 376.01 | 322.24 | 243.16 | 164.77 | 111.03 | 76.25 | 53.72 | 39.08 | 29.39 | 22.68 | 17.97 | ||
| 3.355 | 0.4 | 382.18 | 338.57 | 250.57 | 173.95 | 120.16 | 83.29 | 59.23 | 42.85 | 32.02 | 24.62 | 19.41 | ||
| 3.299 | 0.5 | 379.64 | 339.11 | 264.59 | 191.41 | 134.79 | 94.32 | 68.05 | 49.51 | 37.47 | 28.74 | 22.48 | ||
| 4.591 | 0.8 | 0.5 | 0.05 | 373.54 | 322.53 | 231.05 | 158.51 | 111.26 | 81.51 | 62.38 | 48.85 | 39.50 | 33.01 | 28.01 |
| 4.625 | 0.1 | 372.37 | 334.83 | 250.38 | 182.03 | 129.68 | 93.69 | 69.63 | 54.20 | 42.94 | 34.87 | 28.93 | ||
| 4.536 | 0.15 | 381.18 | 347.12 | 271.49 | 200.71 | 144.77 | 105.66 | 79.34 | 60.79 | 47.79 | 38.17 | 31.03 | ||
| 4.375 | 0.2 | 369.97 | 334.85 | 269.46 | 203.71 | 150.07 | 109.92 | 82.76 | 64.26 | 50.27 | 39.72 | 32.42 | ||
| 4.272 | 0.25 | 376.75 | 350.72 | 283.99 | 217.59 | 164.01 | 119.12 | 90.73 | 69.59 | 54.18 | 43.01 | 34.61 | ||
| 4.143 | 0.3 | 377.64 | 359.51 | 291.94 | 223.13 | 169.66 | 124.53 | 95.68 | 74.04 | 56.84 | 45.13 | 36.38 | ||
| 4.015 | 0.35 | 371.42 | 350.64 | 290.91 | 226.22 | 171.09 | 131.02 | 98.21 | 75.44 | 58.91 | 46.52 | 37.69 | ||
| 3.906 | 0.4 | 381.79 | 351.87 | 292.44 | 240.79 | 178.70 | 132.91 | 100.96 | 79.74 | 61.91 | 48.82 | 39.15 | ||
| 3.707 | 0.5 | 384.14 | 355.76 | 300.64 | 244.93 | 188.61 | 142.65 | 109.42 | 84.42 | 66.48 | 52.55 | 42.04 | ||
| 3.479 | 0.4 | 0.9 | 0.05 | 375.52 | 281.14 | 162.61 | 98.43 | 64.94 | 46.37 | 35.22 | 28.12 | 23.23 | 19.73 | 17.06 |
| 3.684 | 0.1 | 372.69 | 301.96 | 190.49 | 119.14 | 77.18 | 54.05 | 39.19 | 29.88 | 23.99 | 19.63 | 16.62 | ||
| 3.748 | 0.15 | 371.98 | 311.15 | 208.72 | 138.55 | 90.69 | 61.96 | 44.78 | 33.71 | 26.17 | 21.01 | 17.34 | ||
| 3.75 | 0.2 | 375.42 | 321.47 | 228.23 | 155.21 | 101.56 | 70.34 | 50.28 | 37.27 | 28.71 | 22.81 | 18.49 | ||
| 3.732 | 0.25 | 370.35 | 329.65 | 235.76 | 164.27 | 111.74 | 77.33 | 55.13 | 40.90 | 31.26 | 24.77 | 20.02 | ||
| 3.703 | 0.3 | 378.08 | 321.15 | 246.62 | 173.27 | 121.76 | 84.72 | 60.99 | 45.61 | 34.38 | 27.12 | 21.47 | ||
| 3.656 | 0.35 | 367.74 | 326.33 | 256.18 | 184.69 | 128.24 | 89.63 | 66.71 | 48.51 | 37.24 | 29.03 | 22.94 | ||
| 3.622 | 0.4 | 369.95 | 344.26 | 257.62 | 193.21 | 139.77 | 98.96 | 71.55 | 53.96 | 40.54 | 31.41 | 24.94 | ||
| 3.513 | 0.5 | 373.62 | 347.62 | 267.78 | 202.32 | 149.28 | 109.37 | 80.98 | 59.81 | 46.34 | 35.60 | 28.07 | ||
| 5.654 | 0.8 | 0.9 | 0.05 | 370.62 | 331.28 | 267.74 | 202.41 | 148.31 | 113.39 | 88.82 | 69.98 | 57.02 | 47.56 | 40.31 |
| 5.641 | 0.1 | 370.67 | 343.10 | 291.26 | 224.72 | 175.78 | 131.27 | 101.79 | 80.77 | 65.21 | 52.94 | 44.51 | ||
| 5.43 | 0.15 | 371.73 | 340.52 | 292.83 | 235.88 | 183.95 | 142.13 | 112.66 | 89.10 | 71.61 | 57.94 | 47.85 | ||
| 5.203 | 0.2 | 371.15 | 350.56 | 311.19 | 248.15 | 193.68 | 152.59 | 117.19 | 95.85 | 75.15 | 62.21 | 50.21 | ||
| 4.981 | 0.25 | 373.12 | 336.08 | 308.69 | 247.16 | 198.42 | 154.53 | 125.11 | 100.83 | 80.06 | 63.81 | 53.65 | ||
| 4.781 | 0.3 | 373.41 | 355.62 | 311.36 | 262.72 | 204.24 | 162.92 | 131.82 | 102.25 | 82.59 | 68.16 | 55.69 | ||
| 4.57 | 0.35 | 372.27 | 348.46 | 312.19 | 256.92 | 201.46 | 164.66 | 132.37 | 105.39 | 84.52 | 70.10 | 56.84 | ||
| 4.394 | 0.4 | 374.18 | 350.24 | 311.41 | 259.49 | 209.63 | 169.67 | 135.65 | 109.17 | 88.24 | 72.68 | 59.43 | ||
| 4.074 | 0.5 | 368.97 | 357.06 | 316.28 | 265.25 | 219.51 | 173.87 | 140.71 | 112.85 | 90.61 | 74.52 | 61.64 | ||
Table 3 ARL of the suggested Modified Mixed‘ EWMA-CUSUM Scheme for autocorrelated process at a 0.5
| c | 0.1 | 0.2 | 0.3 | 0.4 | 0.5 | 0.6 | 0.7 | 0.8 | 0.9 | 1 | ||||
| 41.67 | 0.4 | 0.5 | 0.05 | 371.97 | 156.91 | 87.58 | 58.05 | 44.09 | 35.51 | 30.29 | 26.35 | 23.52 | 21.36 | 19.57 |
| 33.89 | 0.1 | 369.23 | 157.80 | 88.79 | 58.31 | 42.36 | 33.25 | 27.55 | 23.70 | 20.91 | 18.78 | 17.09 | ||
| 28.5 | 0.15 | 369.14 | 166.27 | 91.32 | 58.81 | 41.51 | 32.14 | 26.33 | 22.27 | 19.41 | 17.25 | 15.61 | ||
| 24.31 | 0.2 | 370.53 | 170.44 | 92.74 | 58.55 | 41.67 | 31.57 | 25.44 | 21.32 | 18.36 | 16.19 | 14.49 | ||
| 21.29 | 0.25 | 373.75 | 174.78 | 94.41 | 59.78 | 41.70 | 31.62 | 25.04 | 20.77 | 17.78 | 15.53 | 13.84 | ||
| 18.7 | 0.3 | 374.23 | 174.74 | 95.22 | 60.27 | 41.65 | 31.01 | 24.79 | 20.26 | 17.19 | 14.95 | 13.22 | ||
| 16.9 | 0.35 | 373.86 | 178.61 | 99.71 | 62.27 | 42.87 | 31.51 | 25.02 | 20.11 | 16.94 | 14.66 | 12.90 | ||
| 15.11 | 0.4 | 376.61 | 182.62 | 100.25 | 63.98 | 44.33 | 32.11 | 25.34 | 19.72 | 16.53 | 14.21 | 12.45 | ||
| 12.5 | 0.5 | 373.62 | 184.83 | 105.55 | 64.34 | 43.28 | 31.54 | 24.28 | 19.49 | 16.15 | 13.74 | 11.95 | ||
| 93.6 | 0.8 | 0.5 | 0.05 | 373.26 | 213.67 | 142.37 | 101.71 | 77.97 | 63.70 | 53.31 | 46.61 | 41.27 | 37.25 | 33.86 |
| 74.8 | 0.1 | 375.55 | 218.63 | 145.62 | 102.83 | 77.88 | 62.10 | 51.42 | 44.09 | 38.52 | 34.26 | 30.81 | ||
| 61.6 | 0.15 | 377.76 | 221.97 | 148.55 | 103.62 | 78.53 | 61.98 | 50.57 | 42.85 | 36.98 | 32.60 | 29.19 | ||
| 52.18 | 0.2 | 369.75 | 224.32 | 145.68 | 103.16 | 77.54 | 61.58 | 49.59 | 41.73 | 35.79 | 31.38 | 27.85 | ||
| 45.1 | 0.25 | 377.11 | 230.17 | 149.61 | 105.63 | 78.57 | 60.81 | 49.15 | 41.31 | 35.06 | 30.48 | 26.96 | ||
| 39.1 | 0.3 | 376.62 | 229.44 | 149.73 | 105.06 | 77.45 | 60.81 | 48.82 | 40.54 | 34.29 | 29.79 | 26.07 | ||
| 35.6 | 0.35 | 374.08 | 225.74 | 151.07 | 106.18 | 77.91 | 60.21 | 48.50 | 40.08 | 33.83 | 29.18 | 25.56 | ||
| 30.7 | 0.4 | 371.14 | 225.84 | 149.26 | 105.92 | 77.17 | 59.95 | 48.03 | 39.46 | 33.27 | 28.51 | 24.93 | ||
| 24.83 | 0.5 | 371.57 | 228.91 | 149.11 | 105.56 | 77.40 | 59.6 | 47.48 | 38.68 | 32.26 | 27.50 | 23.88 | ||
| 54.2 | 0.4 | 0.9 | 0.05 | 378.04 | 175.97 | 102.67 | 69.37 | 52.44 | 42.37 | 35.74 | 31.26 | 27.91 | 25.30 | 23.19 |
| 42.8 | 0.1 | 372.33 | 175.50 | 102.77 | 68.23 | 49.95 | 39.67 | 32.74 | 28.04 | 24.65 | 22.11 | 20.12 | ||
| 36.2 | 0.15 | 372.37 | 182.04 | 104.28 | 69.12 | 49.93 | 39.07 | 31.72 | 26.82 | 23.39 | 20.73 | 18.68 | ||
| 30.8 | 0.2 | 370.45 | 184.51 | 106.83 | 70.16 | 49.72 | 38.27 | 30.79 | 25.87 | 22.22 | 19.62 | 17.50 | ||
| 26.8 | 0.25 | 372.70 | 188.13 | 108.45 | 69.92 | 49.97 | 37.92 | 30.46 | 25.31 | 21.53 | 18.81 | 16.76 | ||
| 23.6 | 0.3 | 374.55 | 189.11 | 110.31 | 71.64 | 50.09 | 37.78 | 30.08 | 24.68 | 21.02 | 18.28 | 16.14 | ||
| 21.1 | 0.35 | 374.49 | 195.56 | 111.04 | 71.71 | 49.87 | 37.71 | 29.84 | 24.44 | 20.68 | 17.81 | 15.68 | ||
| 18.75 | 0.4 | 371.8 | 193.66 | 110.57 | 71.51 | 49.95 | 37.42 | 29.42 | 23.93 | 20.11 | 17.32 | 15.15 | ||
| 15.55 | 0.5 | 373.86 | 198.32 | 115.28 | 73.59 | 51.31 | 37.88 | 29.46 | 23.76 | 19.75 | 16.89 | 14.66 | ||
| 132.2 | 0.8 | 0.9 | 0.05 | 371.44 | 243.69 | 173.62 | 127.88 | 100.35 | 81.46 | 69.43 | 60.13 | 53.16 | 47.87 | 43.65 |
| 106.1 | 0.1 | 372.43 | 247.10 | 173.05 | 128.24 | 99.43 | 81.14 | 68.01 | 58.21 | 50.91 | 45.26 | 40.75 | ||
| 86.8 | 0.15 | 373.10 | 245.91 | 172.71 | 128.99 | 100.02 | 80.67 | 66.73 | 57.08 | 49.15 | 43.82 | 38.82 | ||
| 73.75 | 0.2 | 371.37 | 244.45 | 176.35 | 129.72 | 99.40 | 80.36 | 66.05 | 55.94 | 48.46 | 42.58 | 37.96 | ||
| 63.66 | 0.25 | 369.49 | 249.13 | 174.68 | 128.81 | 99.49 | 79.55 | 65.62 | 55.48 | 47.8 | 41.56 | 36.79 | ||
| 56.17 | 0.3 | 370.31 | 247.91 | 177.75 | 129.81 | 99.92 | 80.49 | 65.23 | 55.06 | 47.52 | 41.19 | 36.53 | ||
| 49.82 | 0.35 | 373.62 | 252.37 | 181.93 | 130.28 | 99.94 | 80.08 | 65.32 | 55.13 | 46.89 | 40.59 | 35.69 | ||
| 44.36 | 0.4 | 370.39 | 250.90 | 177.92 | 130.98 | 100.05 | 79.46 | 64.82 | 54.04 | 46.15 | 39.98 | 35.15 | ||
| 36.46 | 0.5 | 371.64 | 255.26 | 183.91 | 133.59 | 102.12 | 79.48 | 65.27 | 53.68 | 45.91 | 39.39 | 34.61 | ||
Table 4 ARL of the CUSUM Scheme for autocorrelated process at a 0.5
| b | 0.1 | 0.2 | 0.3 | 0.4 | 0.5 | 0.6 | 0.7 | 0.8 | 0.9 | 1 | |||
| 0.4 | 0.5 | 5.60 | 369.40 | 209.58 | 124.54 | 78.35 | 52.04 | 37.08 | 27.31 | 21.25 | 16.99 | 14.11 | 11.93 |
| 0.4 | 0.9 | 6.78 | 370.41 | 214.23 | 133.21 | 87.51 | 59.44 | 43.22 | 32.34 | 25.40 | 20.51 | 16.98 | 14.44 |
| 0.8 | 0.5 | 9.95 | 371.80 | 237.84 | 163.80 | 116.59 | 84.55 | 64.23 | 49.57 | 40.18 | 32.61 | 27.17 | 22.98 |
| 0.8 | 0.9 | 14.65 | 372.10 | 258.01 | 186.58 | 138.40 | 105.65 | 83.50 | 66.77 | 54.31 | 45.32 | 38.30 | 32.84 |
Results shown by our proposed scheme indicates the lesser detection points for small to moderate shifts, which is better in comparison to the scheme given by Vanbrackle and Reynolds [23] for detecting the process shifts, particularly smaller shifts ().
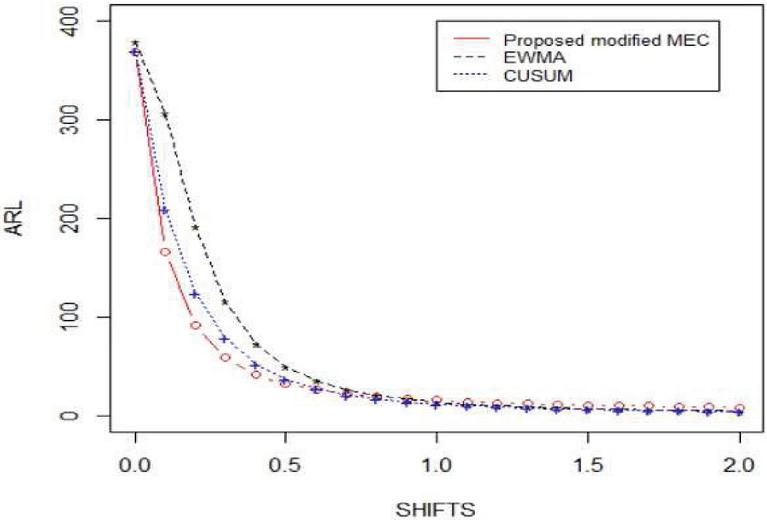
Figure 1 ARL of the suggested scheme, the EWMA chart of the autocorrelated Observations from Lu, C.W. and Reynolds, Jr, M.R. [10] at and CUSUM chart at and for autocorrelated process at and .
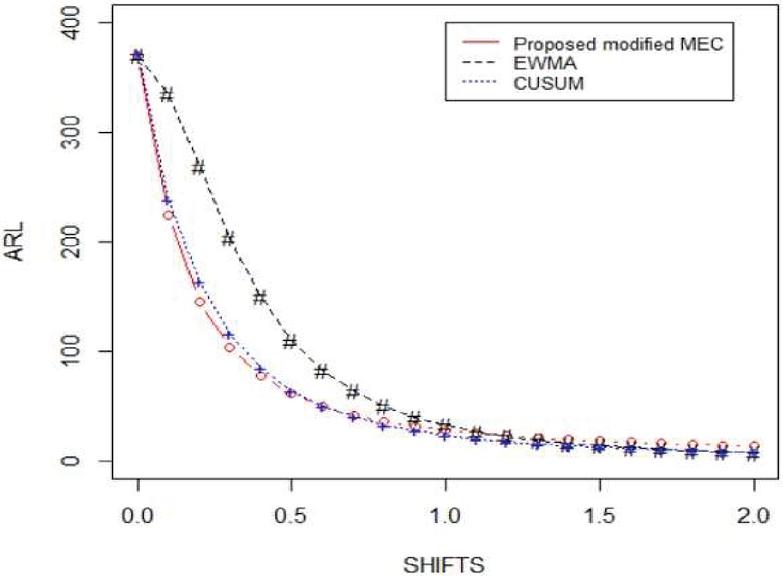
Figure 2 ARL of the suggested scheme, the EWMA chart of the autocorrelated Observations from Lu, C.W. and Reynolds, Jr, M.R. [10] at and CUSUM chart at and for autocorrelated process at and .
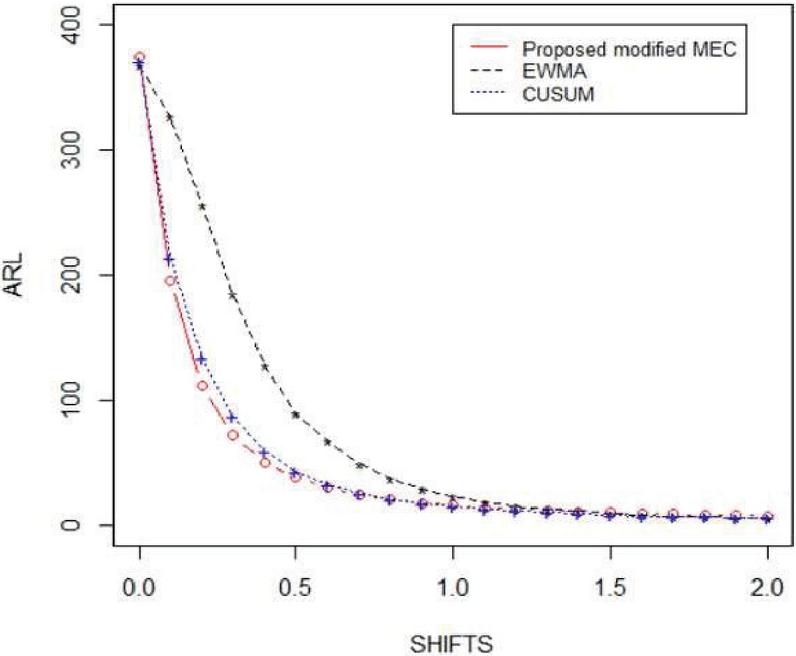
Figure 3 ARL values of the suggested scheme, the EWMA chart of the autocorrelated Observations from Lu, C.W. and Reynolds, Jr, M.R. [10] at and CUSUM chart at and for autocorrelated process at and .
Lu and Reynolds[10] concluded that : “when the level of autocorrelation is reasonably high the time required to detect a shift which is given fraction of the process standard deviation is much longer than the time ”. Table 2 represents the only ARL values of the EWMA chart of observation only given by Lu and Reynolds [10] at different levels of autocorrelation. Table 3 gives the ARL values of the proposed modified mixed EWMA-CUSUM scheme, the parameter b is tuned so as to give in-control ARL approximately 370. Table 4 gives the values of the CUSUM chart for AR(1) plus random error model at a 0.5. If we compare the values of the Table 2 with Tables 3 and 4, we found the lesser detection time for smaller shifts () which indicates that our proposed modified mixed EWMA-CUSUM scheme is far better than the scheme given by Lu and Reynolds [10].
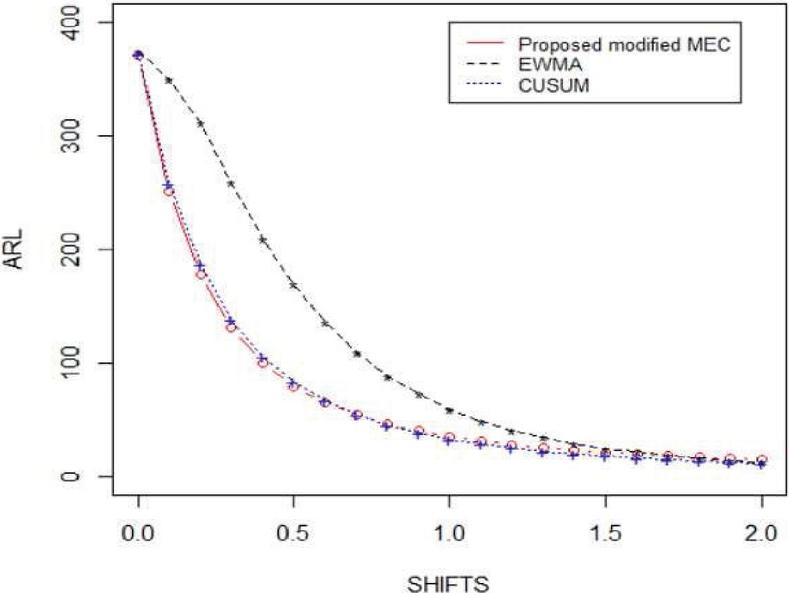
Figure 4 ARL of the suggested scheme, the EWMA chart of the autocorrelated Observations from Lu, C.W. and Reynolds, Jr, M.R. [10] at and CUSUM chart at and for autocorrelated process at and .
From Table 3, we also observed that when the parameter increases, the out-of-control ARL for small shifts increases. On the other hand, for moderate shifts the out-of-control ARL decreases as the value of increases. So, if we wish to spot smaller shifts the lower value of is preferable and vice-versa. That means when we are designing our proposed chart for small shifts, it responses better for small shifts and when we are designing our proposed chart for large shifts, it responses better for large shifts which is not the property of existing chart.
The performance of our suggested scheme can also be assessed by the graphs shown in Figures 1 to 4 in which we can see that the ARL of our suggestd schemes for AR(1) process plus random error performs much better for particularly for early shifts ( in comparison to the other mentioned schemes.
References
[1] Abbas N, Riaz M, Does R. J. M. M., ‘Enhancing the Performance of EWMA Charts’, Quality and Reliability Engineering International, 27(6):821–833, 2010.
[2] Abbas, N., Riaz, M., and Does, R. J. M. M. ‘Mixed exponentially weighted moving average-cumulative sum charts for process monitoring’, Quality and Reliability Engineering International, 29, 345–356, 2013.
[3] Alwan, L. C., and Roberts, H. V., ‘Time series process modelling for statistical control. Journal of Business and Economic Statistics’, 6, 87–95, 1988.
[4] Alwan, L. C., ‘Effects of autocorrelation on control chart performance’, Communications in Statistics: Theory and Methods, 21, 1025–1049, 1992.
[5] Bagshaw, M., and Johnson, R. A., ‘The effect of serial correlation on the performance of CUSUM tests II’, Technometrics, 17, 73–80, 1975.
[6] Box, G. E. P., Jenkins, G. M. and Reinsel, G. C., ‘Time Series Analysis, Forecasting and Control’, 3rd edition, Prentice Hall, Englewood Cliffs, N. J., 1994.
[7] Harris, T.J. and Ross, William. ‘Statistical process control procedures for correlated observations’, The Canadian Journal of Chemical Engineering. 69. 48–57, 1991.
[8] Jiang W, Shu L, Aplet DW., ‘Adaptive CUSUM Procedures with EWMA-Based Shift Estimators’, IIE Transactions, 40(10):992–1003, 2008
[9] Johnson, R. A., and Bagshaw, M., ‘The effect of serial correlation on the performance of CUSUM tests’, Technometrics, 16, 103–112, 1974.
[10] Lu, C. W. and Reynolds, M. R. Jr., ‘EWMA control charts for monitoring the mean of autocorrelated processes’, Journal of Quality Technology, 31(2), 166–188, 1999a.
[11] Lu, C. W. and Reynolds, M. R. Jr., ‘Control charts for monitoring the mean and the variance of autocorrelated processes’, Journal of Quality Technology, 31(3), 259–274, 1999b.
[12] Lu, C. W., and Reynolds, M. R. Jr., ‘CUSUM charts for monitoring an autocorrelated Process. Journal of Quality Technology’, 33, 316–334, 2001.
[13] Lucas, J. M., ‘Combined Shewhart-CUSUM quality control schemes’ Journal of Quality Technology, 14, 51–59, 1982.
[14] Lucas, J., and Crosier, R., ‘Fast Initial Response for CUSUM Quality-Control Schemes: Give Your CUSUM A Head Start’, Technometrics, 24(3), 199–205, 1982.
[15] Lucas, J. M., and Saccucci, M. S., ‘Exponentially weighted moving average control schemes: Properties and enhancements’, Technometrics, 32(1), 1–12, 1990.
[16] Montgomery, D. C. (2009). Introduction to Statistical Quality Control (6th ed.). New York, NY: Wiley.
[17] Montgomery, D.C. and Mastrangelo, C.M., ‘Some Statistical Process Control Methods for Autocorrelated Data’, Journal of Quality Technology, 23, 179–193, 1991.
[18] Osei-Aning, R., S. A. Abbasi, and M. Riaz., ‘Mixed EWMA-CUSUM and mixed CUSUM-EWMA for monitoring first order autoregressive processes’ Quality Technology and Quantitative Management 14(4):429–53, 2017.
[19] Psarakis, S., and Papaleonida, G. E. A., ‘SPC procedures for monitoring autocorrelated processes’, Quality Technology and Quantitative Management, 4, 501–540, 2007.
[20] Riaz M, Abbas N, Does RJMM., ‘Improving the Performance of CUSUM Charts’, Quality and Reliability Engineering International, 27(4):415–424, 2011.
[21] Schmid, W., ‘On the run length of a Shewhart chart for correlated data’, Statistical Papers, 36, 139–130, 1995.
[22] Steiner SH., ‘EWMA control charts with time varying control limits and fast initial response. Journal of Quality Technology’, 31(1):75–86, 1999.
[23] Vanbrackle, L. N., and Reynolds, M. R., ‘EWMA and cusum control charts in the presence of correlation’, Communications in Statistics – Simulation and Computation, 26, 979–1008, 1997.
[24] Vasilopoulos, A. V., and Stamboulis, A. P., ‘Modification of control chart limits in the presence of data correlation’ Journal of Quality Technology, 10, 20–30, 1978.
[25] Yashchin E., ‘Weighted Cumulative Sum Technique’, Technometrics, 31(1):321–338, 1989.
[26] Zhong, X., ‘Efficient sampling plans for control charts when monitoring an autocorrelated process’, (PhD dissertation). Virginia Polytechnic Institute and State University, 2006.
Biographies

Dushyant Tyagi has done his M.Sc., M.Phil. and Ph.D. (Statistics) from Department of Statistics, Ch. Charan Singh University, Meerut and possess Eleven years of experience of educating in various institutions of repute like G. B. Pant University of Agriculture and Technology, Institute of Technology and Science Ghaziabad, International College of Financial Planning, New Delhi and Lady Shri Ram College for Women, New Delhi. He is currently working as an Assistant Professor at the Department of Mathematics and Statistics, Faculty of Science and Technology, Dr. Shakuntala Misra National Rehabilitation University, Lucknow. His research area is Statistical Quality Control and Computational Statistics. He held the responsibility of Convener and resource person for three AICTE sponsored Faculty Development Program on Advance Data Analysis through Data Analysis Software’s. He delivered lectures in more than 25 research methodology workshops. He has six research paper publication in reputed International journals and one book. He has presented his research work in various National and International Conferences and attended several seminars and FDP’s of statistics and related areas.

Vipin Yadav has done his M.Sc. (GOLD MEDALIST) in Applied Statistics from the Department of Mathematics and Statistics at Dr. Shakuntala Misra National Rehabilitation University (DSMNRU) Lucknow in 2017. Qualified U.G.C. NET and J.R.F. and currently he is pursuing Ph.D. in Statistics from DSMNRU, Lucknow.
Journal of Reliability and Statistical Studies, Vol. 14, Issue 2 (2021), 471–490.
doi: 10.13052/jrss0974-8024.1425
© 2021 River Publishers