Regression-in-Ratio Estimators for Population Mean by Using Robust Regression in Two Phase Sampling
Muhammad Noor-ul-Amin1 and Aamir Raza2,*
1COMSATS University Islamabad-Lahore Campus, Pakistan
2Department of Statistics, Graduate College, Mandi Bahauddin, Pakistan
E-mail: nooramin.stats@gmail.com; amir.vu@gmail.com
Corresponding Author
Received 11 March 2021; Accepted 29 August 2021; Publication 08 October 2021
Abstract
The estimation of population mean is not meaningful using ordinary least square method when data contains some outliers. In the current study, we proposed efficient estimators of population mean using robust regression in two phase sampling. An extensive simulation study is conduct to examine the efficiency of proposed estimators in terms of mean square error (MSE). Real life example and extensive simulation study are cited to demonstrate the performance of the proposed estimators. Theoretical example and simulation studies showed that the suggested estimators are more efficient than the considered estimators in the presence of outliers.
Keywords: Auxiliary information, M-estimator, outliers, robust regression, two phase sampling.
1 Introduction
In the presence of outliers, OLS method fails to produce efficient results as it is highly sensitive toward the outliers. Robust regression using redescending M-estimator is used as an alternate tool to obtain efficient estimates when data contain outliers. A numbers of robust regression techniques are available in literature but most commonly used technique given by Huber (1964) i.e. M-estimator to remove the effect of outliers.
Two phase sampling is normally applied to obtain auxiliary information about population parameters. Neyman (1938) introduced the two phase sampling to obtain the information on strata sizes. Chand (1975), Kiregyera (1984), Singh and Vishwakarma (2007), Vishwakarma and Gangele (2014), Noor-ul-Amin et al. (2016), Misra (2018), Raza et al. (2019), Sabzar et al. (2020), de Menezes et al. (2021), Ahuja et al. (2021) and Anas et al. (2021) incorporated auxiliary information in considered sampling design to obtain efficient estimates.
Huber (1964) developed the following objective function for robust regression by using .
| (1) |
where ‘’ is the residual associated with ith observation and v is tuning constant, which is used to controls the robustness of the M-estimator. Huber (1964) advised that , where “s” is the estimate of population standard deviation of error (residuals) terms.
The Huber’s (1964) M-estimator is not flexible to weight the larger residuals. To overcome this deficiency an efficient redescending M-estimator is proposed by Raza et al. (2019) that can control the robustness of estimators up to a desire level to detect the outliers. The objective function of M-estimator proposed by Raza et al. (2019) is given as
| (2) |
where ‘v’ and ‘a’ are tuning constants. The optimum values of ‘a’ are 5 and 7. For more details, one can read Raza et al. (2019).
1.1 Notations
Let us consider a finite population of size N having observations . In first phase, sample of size is obtained to collect the auxiliary information. In second phase, sample of size is selected from , to obtain information regarding study variable and auxiliary variable. The sample mean of auxiliary variable is represented by in first phase. In second phase, the sample mean of auxiliary variable and study variables are denoted by and respectively. The simple random sampling (SRS) without replacement is utilized in both phases. The population mean of study variable and auxiliary variables are represented as and respectively. Following notations are used to develop expression of bias and means square errors:
| (3) | ||
| (4) | ||
| (5) |
2 Regression-in-Ratio Estimators in Two Phase Sampling
Kadilar et al. (2004) suggested that information regarding auxiliary variable like coefficient of variation () and coefficient of kurtosis () can also be used to obtain efficient estimators of population mean. Following Kadilar (2004), Noor-ul-Amin et al. (2016) proposed following regression-in-ratio estimators for population mean in two phase sampling
| (6) |
where is the OLS estimator of regression coefficient between study variable and auxiliary variable and
| (7) |
The following expression of MSE of estimators given in (8) is obtained using Taylor series approximation up to order one.
| (8) |
where
| (9) |
In the presence of outlier, in Equation (6) failed to produced reliable results. So Noor-ul-Amin et al. (2016) proposed the following robust regression-in-ratio estimators for population mean in two phase sapling using Huber (1964) M-estimator
| (10) |
Where is obtained by minimizing the by using the objective function defined in Equation (1). Unfortunately, there are some typing errors in the expression of MSE given by Noor-ul-Amin et al. (2016), where the correct expression of MSE for the estimator given in Equation (10) is given as
| (11) |
The values of are similar as given in Equation (9).
3 Proposed Regression-in-Ratio Estimators in Two Phase Sampling
As mentioned earlier, Huber’s (1964) M-estimator does not perform well for larger values of residuals. To overcome this deficiency, we have proposed the following regression-in-ratio estimators for population mean in two phase sampling using the objective function developed by Raza et al. (2019)
| (12) |
where is obtained by minimizing the by using objective function defined in Equation (2). The expression of MSE of proposed regression-in-ratio estimators is obtained as under
| (13) |
4 Efficiency Comparison
In this session, we compared the efficiencies of proposed estimators with existing estimators of the basis of MSE. The proposed estimators performed better if we have,
| (14) |
5 Applications
In this section, performance of proposed robust regression-in-ratio estimators of population mean is compared with and considered estimators using MSEs. Superiority of proposed regression-in-ratio estimators is supported by using a real life data example and using extensive simulation study.
5.1 Real Life Data Example
The data used in this example is about the level of apple production ‘y’ in tons as variable of interest and numbers of apple trees (X, 1 unit 100 trees) as auxiliary variable in 94 villages of the Akdeniz Region in Turkey, 1999. (Source: Institute of Statistics, Republic of Turkey). Statistics regarding the population of Example are given in Table 1 and Graph of the used data is presented in Figure 1. Presence of outliers is verified from this Figure 1.
Table 1 Statistics of data used in Example 4.1
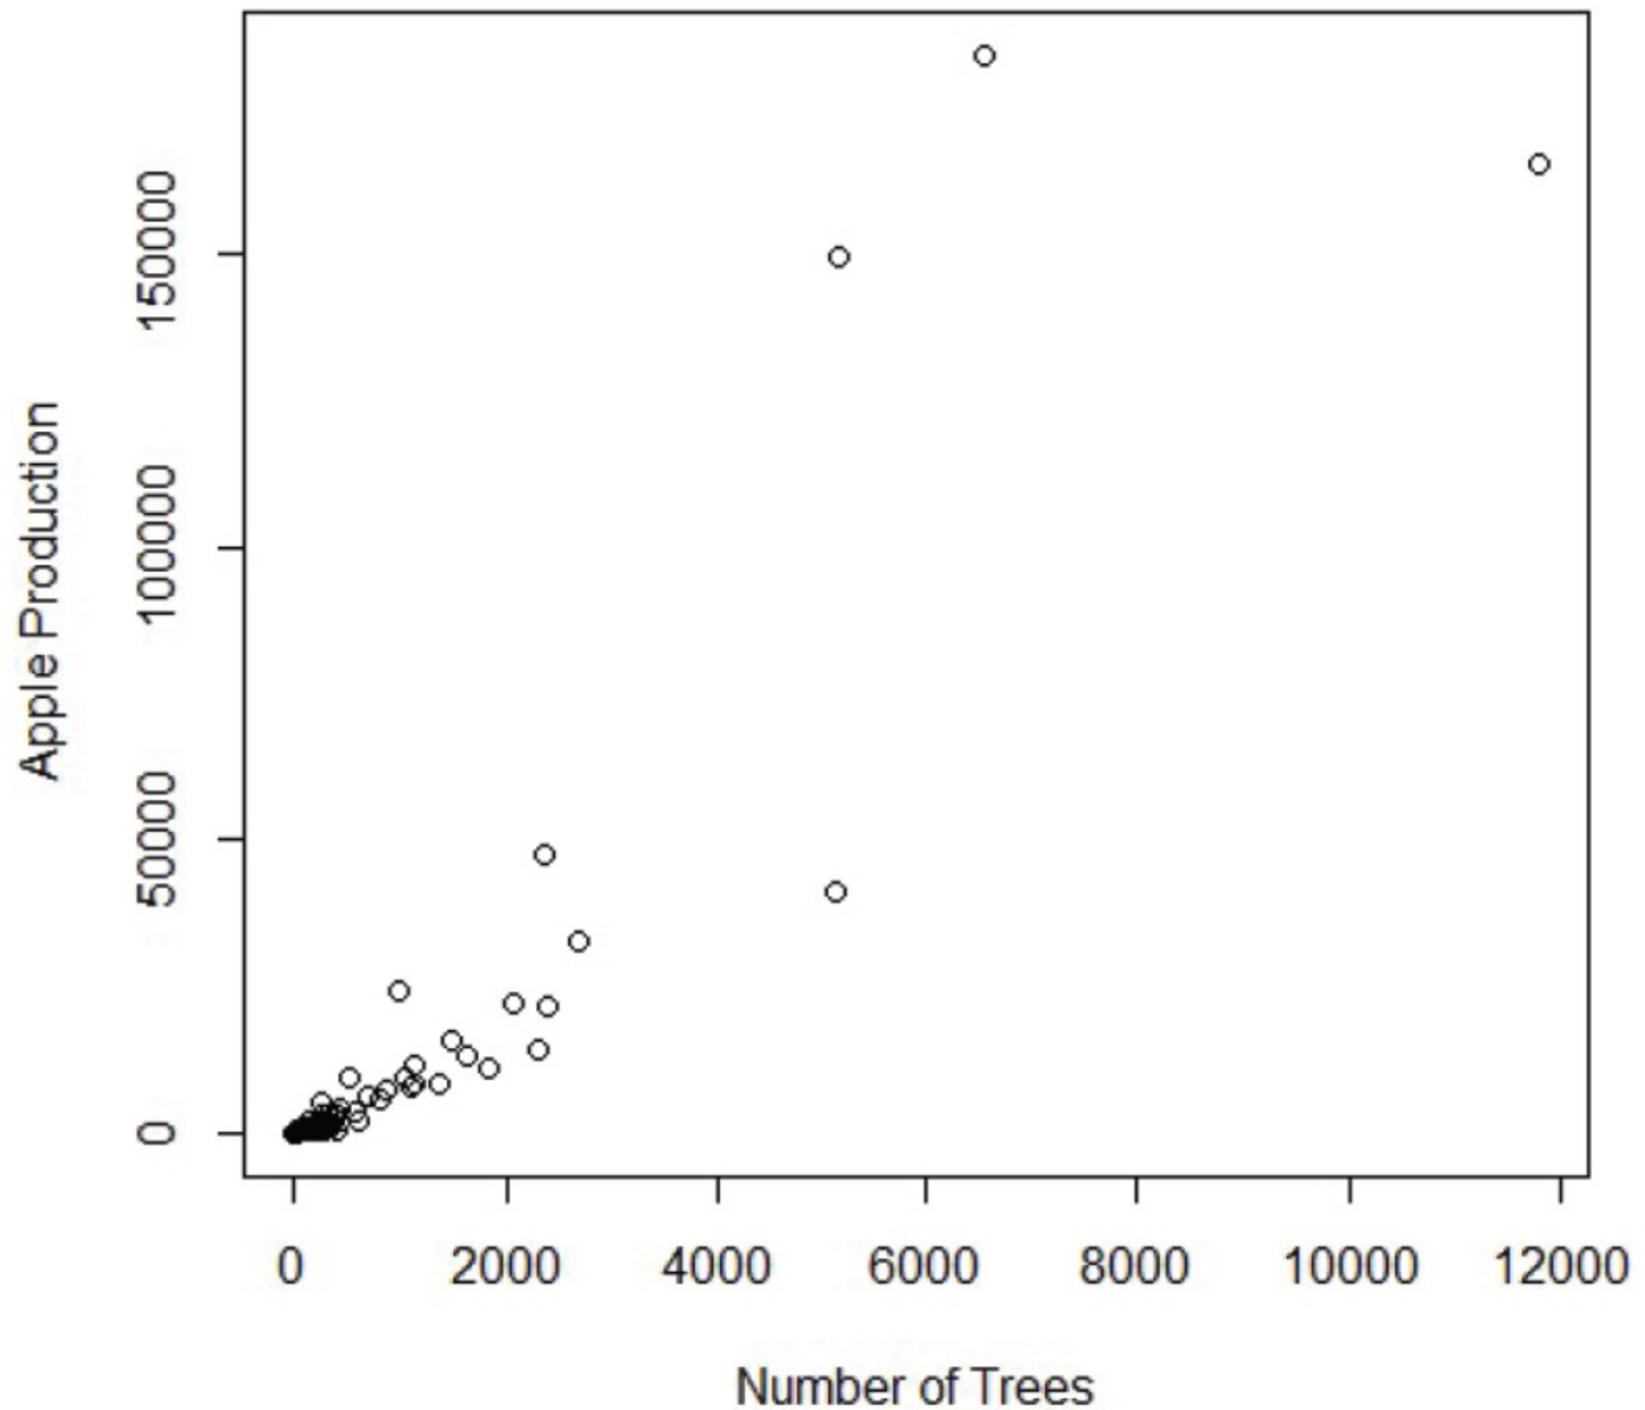
Figure 1 Apple production and number of trees.
A sample of size is taken in first phase from the population using SRS without replacement to obtain the auxiliary information. Three different samples of sizes 5, 10 and 30 at phase II are considered to check the efficiencies of proposed estimators.
By incorporating the data in R programming, the MSE of proposed and considered estimators are calculated using Equations (7), (11) and (13). The R.Es of proposed estimators with considered estimators are obtained by using Equation (14) and presented in Table 2.
| (15) |
where and .
Table 2 R.E of proposed estimators w.r.t considered estimators in two phase sampling at
| R.E | |||||||||||
| 5 | 2.68 | 2.66 | 2.54 | 2.68 | 2.68 | 1.65 | 1.65 | 1.70 | 1.65 | 1.60 | |
| 2.68 | 2.67 | 2.55 | 2.68 | 2.69 | 1.64 | 1.65 | 1.70 | 1.64 | 1.59 | ||
| 2.76 | 2.75 | 2.62 | 2.76 | 2.77 | 1.56 | 1.57 | 1.61 | 1.56 | 1.51 | ||
| 2.68 | 2.67 | 2.54 | 2.68 | 2.68 | 1.65 | 1.65 | 1.70 | 1.65 | 1.60 | ||
| 2.59 | 2.58 | 2.46 | 2.59 | 2.60 | 1.67 | 1.67 | 1.72 | 1.67 | 1.62 | ||
| 10 | 2.35 | 2.34 | 2.24 | 2.35 | 2.36 | 1.52 | 1.53 | 1.56 | 1.52 | 1.49 | |
| 2.36 | 2.35 | 2.25 | 2.36 | 2.36 | 1.52 | 1.52 | 1.56 | 1.52 | 1.48 | ||
| 2.41 | 2.40 | 2.30 | 2.41 | 2.42 | 1.45 | 1.46 | 1.49 | 1.45 | 1.42 | ||
| 2.35 | 2.34 | 2.24 | 2.35 | 2.36 | 1.52 | 1.53 | 1.56 | 1.52 | 1.48 | ||
| 2.29 | 2.28 | 2.19 | 2.29 | 2.30 | 1.54 | 1.54 | 1.58 | 1.54 | 1.50 | ||
| 30 | 1.66 | 1.65 | 1.60 | 1.66 | 1.66 | 1.25 | 1.25 | 1.27 | 1.25 | 1.24 | |
| 1.66 | 1.65 | 1.61 | 1.66 | 1.66 | 1.25 | 1.25 | 1.27 | 1.25 | 1.23 | ||
| 1.68 | 1.67 | 1.62 | 1.68 | 1.68 | 1.22 | 1.22 | 1.23 | 1.22 | 1.20 | ||
| 1.66 | 1.65 | 1.60 | 1.66 | 1.66 | 1.25 | 1.25 | 1.27 | 1.25 | 1.24 | ||
| 1.64 | 1.63 | 1.58 | 1.64 | 1.64 | 1.26 | 1.26 | 1.28 | 1.26 | 1.25 |
The Table 2 indicates that proposed regression-in-ratio estimators worked efficiently in two phase sampling to estimate the population mean as compare to the considered estimators, for all samples sizes. Performance of estimators given by Noor-ul-Amin et al. (2016) is better than OLS estimators but significantly less than proposed estimators for all conditions. At small sample of size , proposed estimator is 268% efficient than OLS estimators and 165% efficient than estimator . As the sample size of phase II increases i.e. , efficiency of estimator is 166% as compare to estimator and 125%, relative to estimators . So increase of phase II sample size decreases the R.E of the proposed estimator but it remains higher than considered estimators.
5.2 Simulation Study
The usefulness of suggested regression-in-ratio estimators to estimate the population mean in two phase sampling is evaluated using extensive simulation study. The R-programing is used to generate a bivariate normal population of size with mean vector and variance covariance matrix . To examine the robustness of proposed estimators, two different levels of contaminations of outliers are used in the population i.e. 2%, and 6% which are termed as low level and high level of containments respectively using a bivariate normal distribution with mean vector and variance covariance vector is similar as discussed above. A sample of 100 values is chosen using SRS without replacement from the considered population in Phase I to obtain auxiliary information and sample of sizes 10, 20 and 30 are drawn using SRS without replacement in phase II to obtain the information regarding the variable of interest and auxiliary variable.
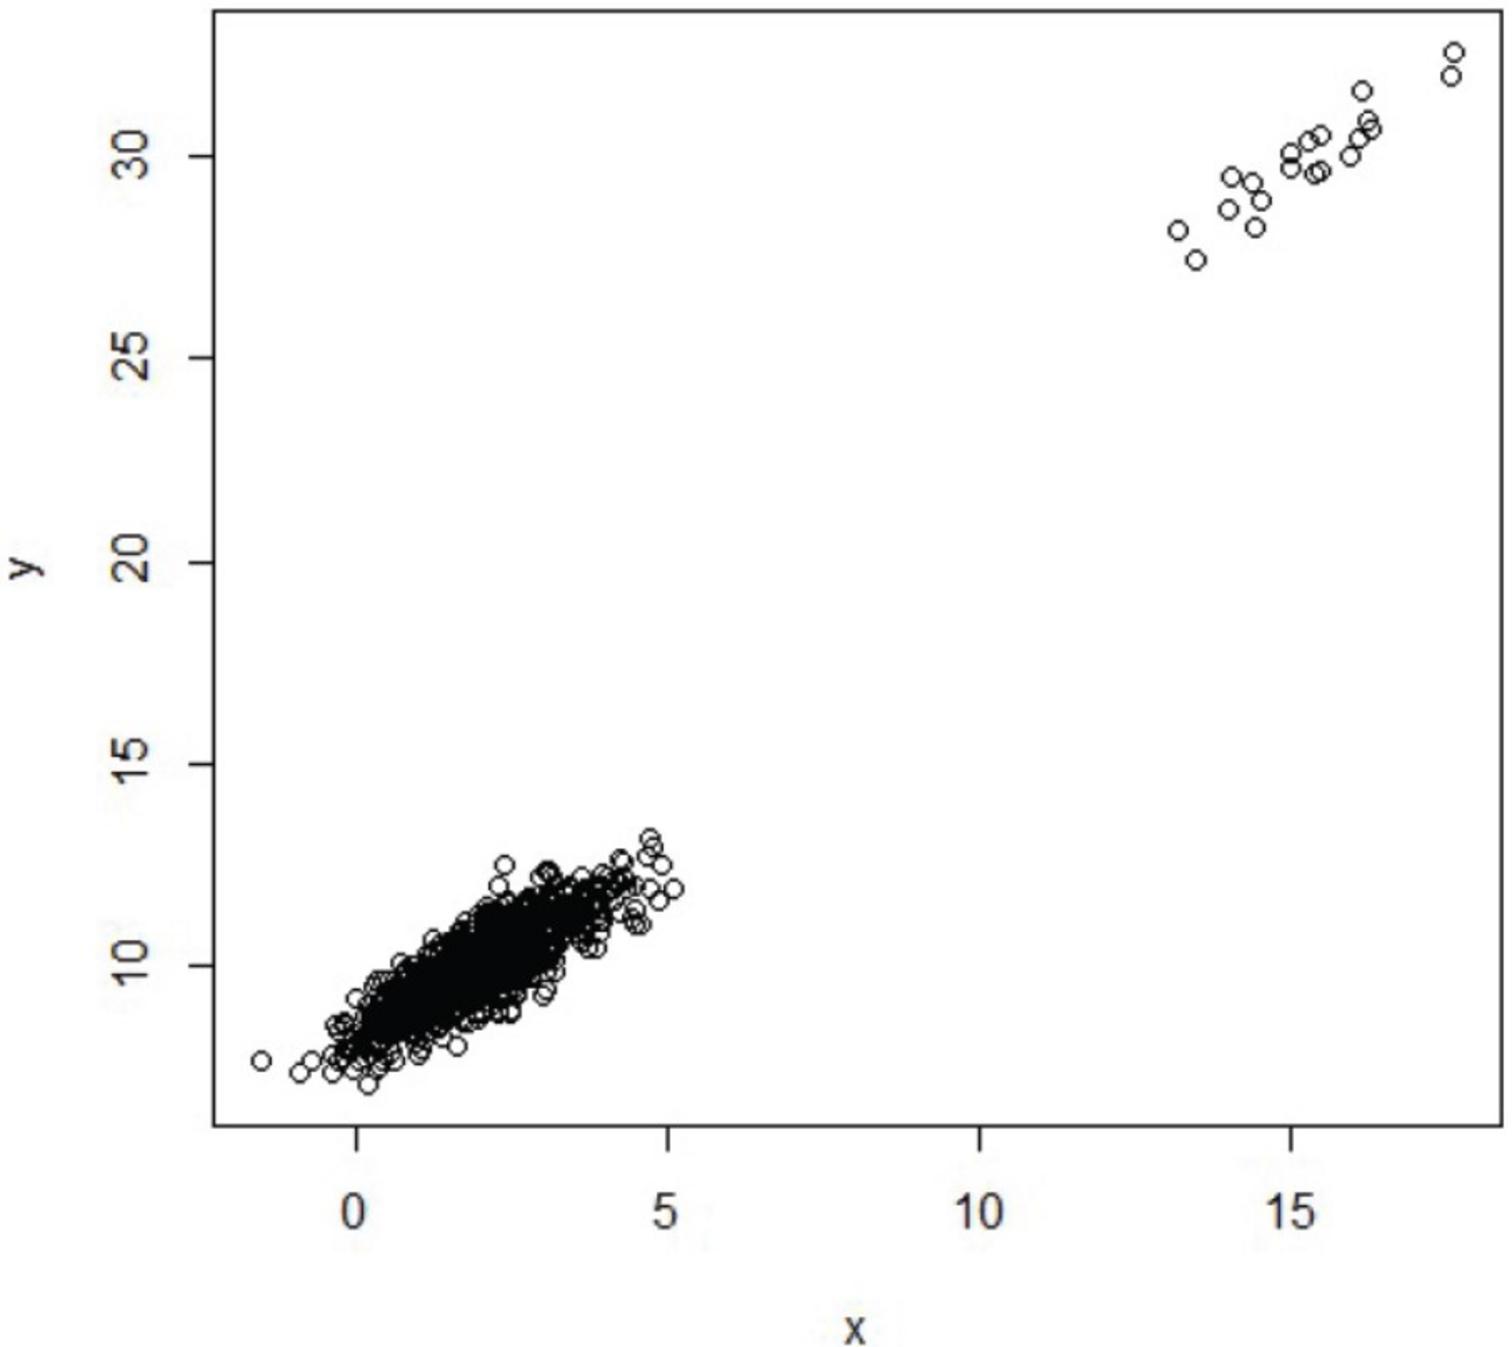
Figure 2 Generated population with 2% outliers.
For each sample size, 50000 iterations are carried out to obtained the MSE of using following formula
| (16) |
where , , and is the mean of from 50000 samples. The graph of generated population with 2% contamination of outliers is presented in Figure 2.
The MSE of proposed and considered estimators are calculated by using Equation (16). The R.Es of considered regression-in-ratio estimators of population mean are calculated by using Equation (15) and presented in Tables 3 and 4.
Table 3 R.E of proposed estimators w.r.t. considered estimators in two phase sampling at and 2% outliers
| R.E | |||||||||||
| 10 | 3.34 | 3.26 | 2.62 | 3.34 | 2.60 | 1.85 | 1.78 | 28 | 1.85 | 1.27 | |
| 3.51 | 3.42 | 2.75 | 3.50 | 2.73 | 1.94 | 1.87 | 1.35 | 1.94 | 1.34 | ||
| 5.40 | 5.26 | 4.22 | 5.39 | 4.20 | 2.99 | 2.88 | 2.07 | 2.98 | 2.05 | ||
| 3.35 | 3.26 | 2.62 | 3.34 | 2.61 | 1.85 | 1.79 | 1.29 | 1.85 | 1.27 | ||
| 5.46 | 5.32 | 4.27 | 5.45 | 4.25 | 3.02 | 2.91 | 2.10 | 3.02 | 2.08 | ||
| 20 | 3.01 | 2.92 | 2.24 | 3.01 | 2.23 | 1.88 | 1.81 | 1.30 | 1.88 | 1.29 | |
| 3.15 | 3.05 | 2.35 | 3.15 | 2.33 | 1.97 | 1.89 | 1.36 | 1.96 | 1.35 | ||
| 4.56 | 4.43 | 3.40 | 4.56 | 3.38 | 2.85 | 2.74 | 1.98 | 2.84 | 1.96 | ||
| 3.02 | 2.92 | 2.25 | 3.01 | 2.23 | 1.88 | 1.81 | 1.31 | 1.88 | 1.30 | ||
| 4.60 | 4.46 | 3.43 | 4.59 | 3.41 | 2.87 | 2.76 | 1.99 | 2.87 | 1.98 | ||
| 30 | 2.98 | 2.89 | 2.23 | 2.98 | 2.21 | 1.74 | 1.68 | 1.23 | 1.74 | 1.22 | |
| 3.10 | 3.00 | 2.32 | 3.09 | 2.30 | 1.81 | 1.74 | 1.28 | 1.81 | 1.27 | ||
| 4.15 | 4.03 | 3.10 | 4.14 | 3.08 | 2.42 | 2.34 | 1.72 | 2.42 | 1.70 | ||
| 2.99 | 2.90 | 2.23 | 2.98 | 2.21 | 1.74 | 1.68 | 1.23 | 1.74 | 1.22 | ||
| 4.18 | 4.06 | 3.13 | 4.18 | 3.10 | 2.44 | 2.36 | 1.73 | 2.44 | 1.71 |
Table 3 depicted that performance of proposed estimators for population mean in two phase sampling is better than OLS and considered robust estimators for all sample sizes at low level contamination of outliers i.e. 2%. The R.E of proposed estimator at sample of size 10 is 3.34 i.e. 334 % as compare to estimator and 1.85 i.e. 185% as compare to estimator . These R.Es are 298% and 174% respectively at phase II sample of size 30 with reference to estimator . It is also concluded from Table 3 that estimators given by Noor-ul-Amin et al. (2016) have overall high R.Es than OLS estimators. It is due to low level of contamination of outliers. As the sample size of Phase II increases performance of considered estimators of population mean improves significantly but still remains less than proposed regression-in-ratio estimators for population mean.
Table 4 R.E of proposed estimators w.r.t. considered estimators in two phase sampling at and 6% outliers
| R.E | |||||||||||
| 10 | 5.18 | 4.97 | 4.15 | 5.16 | 4.22 | 5.14 | 4.93 | 4.11 | 5.12 | 4.18 | |
| 5.64 | 5.42 | 4.52 | 5.62 | 4.60 | 5.59 | 5.37 | 4.47 | 5.57 | 4.55 | ||
| 8.46 | 8.12 | 6.78 | 8.43 | 6.89 | 8.38 | 8.05 | 6.71 | 8.35 | 6.83 | ||
| 5.22 | 5.01 | 4.18 | 5.20 | 4.25 | 5.17 | 4.96 | 4.14 | 5.15 | 4.21 | ||
| 8.12 | 7.80 | 6.50 | 8.09 | 6.62 | 8.05 | 7.72 | 6.44 | 8.02 | 6.55 | ||
| 20 | 3.80 | 3.64 | 2.98 | 3.78 | 3.03 | 3.76 | 3.61 | 2.95 | 3.75 | 3.00 | |
| 4.06 | 3.90 | 3.19 | 4.05 | 3.24 | 4.03 | 3.86 | 3.16 | 4.01 | 3.21 | ||
| 5.63 | 5.39 | 4.42 | 5.61 | 4.49 | 5.58 | 5.35 | 4.37 | 5.56 | 4.45 | ||
| 3.82 | 3.66 | 3.00 | 3.80 | 3.05 | 3.78 | 3.63 | 2.97 | 3.77 | 3.02 | ||
| 5.48 | 5.25 | 4.30 | 5.46 | 4.37 | 5.43 | 5.21 | 4.26 | 5.41 | 4.33 | ||
| 30 | 3.05 | 2.93 | 2.42 | 3.04 | 2.46 | 3.04 | 2.91 | 2.41 | 3.03 | 2.45 | |
| 3.23 | 3.10 | 2.56 | 3.22 | 2.61 | 3.22 | 3.09 | 2.55 | 3.20 | 2.60 | ||
| 4.20 | 4.03 | 3.33 | 4.18 | 3.39 | 4.18 | 4.01 | 3.32 | 4.16 | 3.38 | ||
| 3.06 | 2.94 | 2.43 | 3.05 | 2.48 | 3.05 | 2.93 | 2.42 | 3.04 | 2.47 | ||
| 4.10 | 3.93 | 3.26 | 4.08 | 3.31 | 4.08 | 3.92 | 3.24 | 4.07 | 3.30 |
From Table 4, it is concluded that as the percentage of outliers increases in the population, efficiencies of considered estimators given in Equation (12) for population mean decrease like the estimators given in Equation (6) and the level of robustness decayed significantly due to high level of contaminations of outliers. For example, at phase II sample of size 10, the R.E of is 518% and 514% as compare to OLS estimator and robust estimator respectively. These R.Es become 305% and 304% respectively at . It is practically proved that estimators for population mean based on redescending estimator proposed by Huber (1964) failed to produce robust estimates at high level of contamination of outliers as their performance is similar to the estimators based on OLS technique at this level of contamination.
6 Conclusion
Results obtained in above sections concluded that proposed regression-in-ratio estimators performed significantly better than considered estimators of population mean for all condition and for all sample sizes in two phase sampling design. It is suggested that devised estimators should be utilized for estimation of population mean in two phase sampling design as they outfit the considered estimators for population mean. The proposed estimators can be used in other sampling designs and in quality control to obtain efficient estimator of mean when data have outliers.
Acknowledgement
The authors are thankful to Prof. Cem Kadilar for providing the data of example 1.
Appendix
Using the notations given in Section 1.1, following expression is obtained for the estimator given in (14).
where
Expanding last term up to order one
Ignoring square and higher order terms
Squaring and applying expectation on both sides
The MSE of proposed regression-in-ratio estimators is obtained as under
References
[1] Ahuja, T.K., Misra, P. and Behwal, O.K. (2021). A generalized two phase sampling estimator of ratio of population means using Auxilary information. Journal of Reliability and Statistical Studies, 14(1), pp. 1–16.
[2] Anas, M.M., Huang, Z., Alilah, D.A. Shafqat, M. and Hussain, S. (2021). Mean estimators using robust quantile regression and L-moments’ characteristics for complete and partial auxiliary information. Mathematical Problems in Engineering, 1, pp. 1–8.
[3] Chand, L. (1975). Some Ratio-Type Estimator Based on Two or More Auxiliary Variables. Unpublished Ph.D. dissertation). Iowa State University, Iowa.
[4] Davison, A.C. and Hinkley, D.V. (1997). Bootstrap Methods and Their Application. Cambridge University Press. https://doi.org/10.1155/2021/9242895
[5] Huber, P.J. (1964). Robust estimation of a location parameter. The Annals of Mathematical Statistics, 35(1), pp. 73–101.
[6] Kadilar, C. and Cingi, H. (2004). Ratio estimators in simple random sampling. Applied Mathematics and Computation, 151, pp. 893–902.
[7] Kiregyera, B. (1984). Regression-type estimators using two auxiliary variables and model of two phase sampling from finite populations. Metrika, 31, pp. 215–226.
[8] Menezes, D.Q.F., Prata, D.M., Secchi, A. R. and Pinto, J. C. (2021). A review on robust M-estimator for regression analysis. Commuters & Chemical Engineering, 147. https://doi.org/10.1016/j.compchemeng.2021.107254
[9] Misra, P. (2018). Regression type double sampling estimator of population mean using auxiliary information. Journal of Reliability and Statistical Studies, 11(1), pp. 21–28.
[10] Neyman, J. (1938). Contribution to the theory of sampling human populations. Journal of American Statistical Association, 33, pp. 101–116.
[11] Noor-ul-Amin, M., Shahbaz, Q.M. and Kadilar, C. (2016). Ratio estimators of population mean using robust regression in two phase sampling. Gazi University Journal of Science, 29(4), pp. 793–798.
[12] Raza, A., Noor-ul-Amin, M. and Hanif, M. (2019). Regression-in-ratio estimators in the presence of outliers based on redescending M-estimator. Journal of Reliability and Statistical Studies, 12(2), pp. 1–10.
[13] Singh, H.P. and Vishwakarma, G.K. (2007). Modified exponential ratio and product estimators for finite population mean in two phase sampling. Austrian Journal of Statistics, 36(3), pp. 217–225.
[14] Subzar, M., Al-Omari, A.I. and Alanzi, R.A. (2020). The robust regression methods for estimating of finite population mean based on SRSWOR in case of outliers. Computers, Materials and Continua, 65(1), pp. 125–138.
[15] Vishwakarma, G.K. and Gangele, R.K. (2014). A class of chain ratio-type exponential estimators in two phase sampling using two auxiliary variates. Applied Mathematics and computation, 227, pp. 171–175.
Biographies

Muhammad Noor-ul-Amin received his Ph.D. degree from NCBA&E, Lahore, Pakistan. He has working experience in various universities for teaching and research that includes the Virtual University of Pakistan, University of Sargodha, Pakistan, and the University of Burgundy, France. He is currently working as an Assistant Professor at COMSATS University Islamabad-Lahore Campus. His research interests include sampling techniques and control charting techniques. He is an HEC approved supervisor.

Aamir Raza received his Ph.D. degree from National College of Business Administration & Economics (NCBA&E), Lahore, Pakistan. He did his M. Phil & M.Sc. Statistics from University of the Punjab, Lahore. He is currently working as Lecturer in Statistics at Govt. Graduate College, Mandi Bahauddin. His research interests include sampling techniques and Robust Regression.
Journal of Reliability and Statistical Studies, Vol. 14, Issue 2 (2021), 527–540.
doi: 10.13052/jrss0974-8024.1427
© 2021 River Publishers