Modeling Age at Menstrual Onset and Developing Menarcheal Life Table
Brijesh P. Singh
Department of Statistics, Institute of Science, Banaras Hindu University, Varanasi, Uttar Pradesh, India
E-mail: brijesh@bhu.ac.in
Received 11 March 2021; Accepted 29 August 2021; Publication 09 October 2021
Abstract
Population scientists are generally developing mathematical models/techniques in demography and trying to provide brief explanation of extensive data sets. The prime objective of the present paper is to suggest a probability model to illustrate the distribution of female’s age at first menstrual onset. Menarcheal age distribution is used to evaluate risk associated to reproductive issues and may be used as a demographic indicator of female fecundity. The suitability of the model suggested is tested with the real data sets. Parameters of the model have been estimated through least square estimation technique. It is observed that older female’s age at menarche is somewhat higher than the younger female’s age at menarche. Also, a life table for menarcheal age using a probability model has been constructed. This life table will enable providing the expected duration of getting menarche for a girl of a particular age.
Keywords: Age at menarche, logistic distribution, life table, expected waiting time.
1 Introduction
Menarche, the onset of first menstruation is the most remarkable incident in the process of female puberty, which in turn is a part of adolescence. It is a significant aspect of female growth and broadly used as a marker of population health, timing of maturation and nutritional status. Menarcheal age distribution is used to evaluate risk of reproductive concerns and may be used as a demographic indicator of female fecundity. The reproductive span of a female begins from menarche and continued till the end of menstruation i.e. menopause. The age at menarche has garnered relatively a slight attention among the researchers, because of the lack of reliable data and the lack of interest. There is a major variation in the age at menarche around the world within and between the populations (Aryal, 2002; Thomas et al., 2001). The highest age of menarche is observed among females of New Guinea tribes, rural Bangladesh, rural Rwanda and the nomadic Dobe Kung, that ranges from about 15 to 19 years however the lowest age at menarche is found among urban and developed societies, that ranges from about 12 to 14 years (Becker, 1993; Eveleth and Tanner, 1976). Several investigations have found a small decline in the mean age at menarche over time (Singh and Singh, 2021) and the average amount of decrease is observed about two months per decades (Prado, 1984; Wyshak, 1984). The onset of the menarche is an indicator of the maturity and readiness for marriage and conception. Nutritional status plays a vital role in determining the onset of menstruation and numerous evidences have been given in demographic literature (Marshall, 1986; Wyshak and Frisch, 1982; Varea et al., 2000). Several studies have found a direct relationship between fooding behavior and age at menarche (Nakamura, 1986; Urdy and Cliquet, 1984). Age at menarche influences fertility through the length of reproductive span, adolescent infecundity, and foetal wastage during adolescent period. Also early menarche is responsible for shorter birth interval and higher life time fertility (Riley et al., 1993).
Demographic models may be created either by defining the process in mathematical forms or by using certain empirical observations in numerical forms. A limited use of model for studying the demographic behaviour might perhaps be due to lack of controlled experiments (Aryal, 2002). The aim of the paper is to suggest a stochastic model to explain distribution of age at menarche and hence obtain a summary measure of age at menarche. Also an attempt has been made to compute waiting time at birth for attaining menarche through life table technique (Nambodiri and Suchindran, 1987) using the considered distribution.
2 Probability Model
Usually onset of menarche occurs at about 12 years of age and almost all females attain it up to 20–21 years of age. Onset of menarche increases first with the age reaches maximum about 14–15 years and there after declines quickly. Keeping this into mind and other pragmatic findings, a stochastic distribution is used to explain the distribution of female’s age at menarche. Let X denotes the age at menarche and follows a logistic distribution given by
| (1) |
and are the location and the scale parameters of the distribution respectively. The corresponding distribution function (CDF) is given as:
| (2) |
and the hazard function is
| (3) |
It is clear that the hazard of logistic distribution in increasing. We know that as age of girls increases, the chance of onset of menstruation is increases, thus it is expected that the considered distribution will be suitable for the data on age at menarche.
Estimation of the Parameters
For estimating the parameters of the logistic distribution, method of least square has been used. Rearranging Equation (2) and taking logarithms it becomes a linear function:
| (4) |
Thus the parameters and can easily be estimated by the usual method of least squares principle from expression (4). Mean and Variance of the considered distribution is calculated as and respectively.
3 Data
The suitability of the considered model has been tested with the real data set which has been collected from the girls residing in the hostels of Banaras Hindu University, Varanasi during January to March 2019 using stratified random sampling (Singh et al., 2020). A total of 308 under graduate and postgraduate girl students gave information on the practices regarding menstrual hygiene and about some reproductive issues. Stratified random sampling has been used. For populations that are large, the following equation provides a representative sample for proportions.
Where n is the sample size, is the abscissa of the normal curve that cuts off an area at the tails ( equals the desired confidence level, e.g., 95 percent), e is the desired level of precision, p is the estimated proportion of girls using hygiene sanitary practices. We have considered a 95 percent confidence level and 5 percent precision. The estimated proportion of girls using hygiene sanitary practices is taken as 75 percent, thus the estimated sample size come out to be 288. Further 10 percent more samples added for non-response or non availability in the room. Thus we started survey with final sample size is equal to 317 but after the end of survey we have gathered information only from 308 girls. The non response is only 2 percent in the survey. The age-wise collected data is shown below
Table 1 Distribution of age at menarche according to the different age of respondent
| Age of Respondent | |||
| Age at Menarche | 18–21 | 21 | Total |
| 10 | 0 | 6 | 6 |
| 11 | 8 | 8 | 16 |
| 12 | 23 | 39 | 62 |
| 13 | 40 | 59 | 99 |
| 14 | 29 | 40 | 69 |
| 15 | 17 | 22 | 39 |
| 16 | 2 | 10 | 12 |
| 17 | 1 | 4 | 5 |
| Total | 120 | 188 | 308 |
4 Construction of Menarcheal Life Table
The considered model is applied to the data taken from female students residing in the hostel of Banaras Hindu University, Varanasi. To inspect the incidence of female’s age at menarche according to two age cohorts such as age between 18–21 and above 21 years is taken. The expected proportion of females who got menarche between the age is given by
| (5) |
It is important to understand the concept of construction of the menarcheal life-table using a stochastic model. The proportion survived i.e. not having menarche in a specific age or age intervals are calculated after fitting the logistic distribution. Let be the proportion of females who experienced menarche at age x years or less can be obtained through logistic distribution. is the proportion survived or not having menarche at age x thus (). We know that where is the cohort of the life table. The probability of experiencing menarche between x and years of age is obtained using the expression given as
| (6) |
The other functions such as (person-year experienced menarche by the cohort at age x), (total person year experience menarche by the cohort after age x) and (average number of years expected to experience menarche at age x) are computed.
Table 2 Distribution of age at menarche of females aged 18–21 years
| Age at | Observe Number | Expected Number | Theoretical |
| Menarche | of Females | of Females | (Empirical) Values |
| 11–12 | 8 | 8.05 | |
| 12–13 | 23 | 21.18 | |
| 13–14 | 40 | 41.63 | Mean |
| 14–15 | 29 | 33.05 | 13.75 |
| 15–16 | 17 | 12.08 | (13.28) |
| 16–17 | 2 | 3.09 | |
| 17–18 | 1 | 0.92 | |
| Total | 120 | 120.00 | Variance |
| Parameter | 1.52 (1.47) | ||
| 1.67 | |||
| p-value | 0.43 | ||
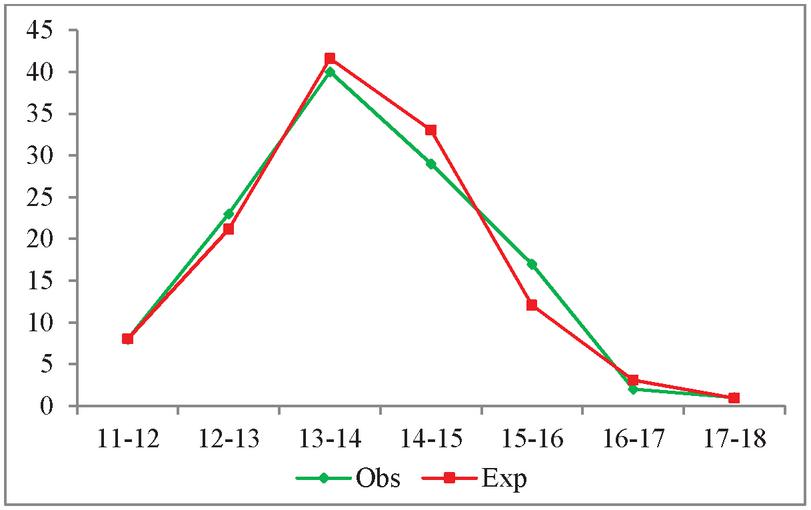
Figure 1 Patten of age at menarche of females aged 18–21 years.
Table 3 Distribution of age at menarche of females aged 21 years
| Age at | Observe Number | Expected Number | Theoretical |
| Menarche | of Females | of Females | (Empirical) Values |
| 10–11 | 6 | 5.62 | |
| 11–12 | 8 | 12.15 | |
| 12–13 | 39 | 31.33 | |
| 13–14 | 59 | 53.34 | Mean |
| 14–15 | 40 | 48.37 | 13.85 |
| 15–16 | 22 | 24.43 | (13.30) |
| 16–17 | 10 | 8.80 | |
| 17–18 | 4 | 3.96 | Variance |
| Total | 188 | 188.00 | 2.21 (2.07) |
| Parameter | |||
| 5.73 | |||
| p-value | 0.22 | ||
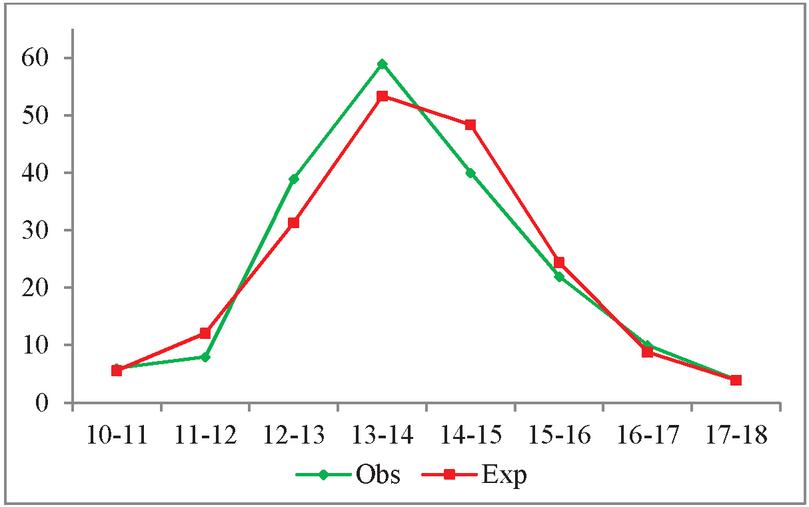
Figure 2 Patten of age at menarche of females aged 21 years.
Table 4 Distribution of age at menarche of all females
| Age at | Observe Number | Expected Number | Theoretical |
| Menarche | of Females | of Females | (Empirical) Values |
| 10–11 | 6 | 6.70 | |
| 11–12 | 16 | 17.28 | |
| 12–13 | 62 | 50.77 | |
| 13–14 | 99 | 94.30 | Mean |
| 14–15 | 69 | 84.13 | 13.85 |
| 15–16 | 39 | 38.20 | (13.29) |
| 16–17 | 12 | 12.06 | |
| 17–18 | 5 | 4.56 | Variance |
| Total | 308 | 308.00 | 1.85 (1.84) |
| Parameter | |||
| 5.63 | |||
| p-value | 0.23 | ||
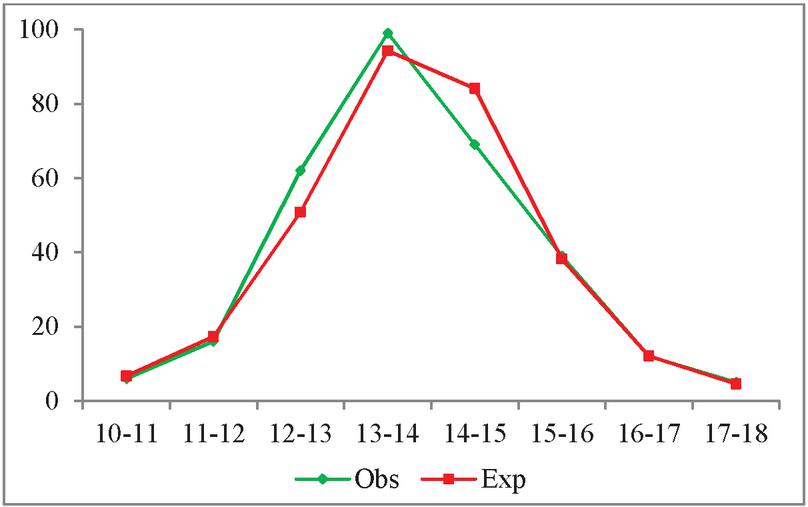
Figure 3 Patten of age at menarche of all females.
Table 5 Menarcheal life table for the female aged 18–21
| Age | |||||||
| 0–11 | 0.016 | 1.000 | 100000.00 | 0.02 | 1063091.08 | 1244020.92 | 12.44 |
| 11–12 | 0.067 | 0.933 | 93289.29 | 0.19 | 84464.25 | 180929.84 | 1.94 |
| 12–13 | 0.244 | 0.756 | 75639.21 | 0.46 | 58295.00 | 96465.59 | 1.28 |
| 13–14 | 0.590 | 0.410 | 40950.79 | 0.67 | 27181.46 | 38170.59 | 0.93 |
| 14–15 | 0.866 | 0.134 | 13412.13 | 0.75 | 8378.05 | 10989.13 | 0.82 |
| 15–16 | 0.967 | 0.033 | 3343.97 | 0.77 | 2055.39 | 2611.08 | 0.78 |
| 16–17 | 0.992 | 0.008 | 766.80 | 0.78 | 469.55 | 555.69 | 0.72 |
| 17–18 | 0.998 | 0.002 | 172.29 | 0.77 | 86.15 | 86.15 | 0.50 |
Table 6 Menarcheal life table for the female aged 21 and above
| Age | |||||||
| 0–10 | 0.009 | 1.000 | 100000.00 | 0.01 | 985056.66 | 1272497.65 | 12.72 |
| 10–11 | 0.030 | 0.970 | 97011.33 | 0.07 | 93781.15 | 287440.99 | 2.96 |
| 11–12 | 0.094 | 0.906 | 90550.96 | 0.18 | 82217.98 | 193659.85 | 2.14 |
| 12–13 | 0.261 | 0.739 | 73885.00 | 0.38 | 59698.56 | 111441.86 | 1.51 |
| 13–14 | 0.545 | 0.455 | 45512.11 | 0.57 | 32646.86 | 51743.31 | 1.14 |
| 14–15 | 0.802 | 0.198 | 19781.61 | 0.66 | 13283.92 | 19096.45 | 0.97 |
| 15–16 | 0.932 | 0.068 | 6786.23 | 0.69 | 4445.18 | 5812.53 | 0.86 |
| 16–17 | 0.979 | 0.021 | 2104.13 | 0.70 | 1052.07 | 1367.34 | 0.65 |
| 17–18 | 0.994 | 0.006 | 630.55 | 0.69 | 315.28 | 315.28 | 0.50 |
Table 7 Menarcheal life table for all female
| Age | |||||||
| 0–10 | 0.006 | 1.000 | 100000.00 | 0.01 | 989123.39 | 1275971.15 | 12.76 |
| 10–11 | 0.022 | 0.978 | 97824.68 | 0.06 | 95020.11 | 286847.76 | 2.93 |
| 11–12 | 0.078 | 0.922 | 92215.55 | 0.18 | 83973.39 | 191827.65 | 2.08 |
| 12–13 | 0.243 | 0.757 | 75731.22 | 0.40 | 60423.43 | 107854.26 | 1.42 |
| 13–14 | 0.549 | 0.451 | 45115.63 | 0.61 | 31457.50 | 47430.84 | 1.05 |
| 14–15 | 0.822 | 0.178 | 17799.37 | 0.70 | 11597.79 | 15973.34 | 0.90 |
| 15–16 | 0.946 | 0.054 | 5396.21 | 0.73 | 3438.27 | 4375.55 | 0.81 |
| 16–17 | 0.985 | 0.015 | 1480.32 | 0.73 | 740.16 | 937.28 | 0.63 |
| 17–18 | 0.996 | 0.004 | 394.25 | 0.69 | 197.12 | 197.12 | 0.50 |
5 Results and Discussion
The findings based on the data collected from the 308 under graduate and postgraduate girls residing in the hostels of Banaras Hindu University, Varanasi are presented in the Tables 2 to 7. Theoretical age at menarche was found slightly higher for older birth cohort (13.85 years) than the recent age cohort (13.75 years). Some adjustment is to be needed in the estimated mean age at menarche through model because the age at menarche is recorded in completed years at the survey date. So the adjustment factor would be c and it is reasonably equal to 0.5 years. Hence the adjusted mean age at menarche would be 13.35 and 13.25 respectively. According to the life table analysis the waiting time for experiencing menarche for females aged 18–21 is 12.44 years however the waiting time for experiencing menarche for females aged 21 and above is 12.72 years. A low mean age at menarche among the recent age cohort females may perhaps be due to the effects of modernization and good quality of nutrition. The expected waiting time for experiencing menarche at birth is observed as 12.76 years for all females, which is a consistent result with the mean age at menarche (13.35 years) through the model. Hence both the techniques provided more or less consistent estimate of average age at menarche in the study population. The logistic distribution considered here is found to be appropriate to the data for describing distribution of age at menarche. Author presume that the finding of the paper provides some interesting and valuable results, which may motivate future research in the field of demography especially, age at menarche, menopause reproductive health and hence fertility.
References
[1] Aryal TR. (2002). Some demographic models and their applications with reference to Nepal. Unpublished Ph.D. thesis, Banaras Hindu University, India.
[2] Becker S. (1993). The determinants of adolescent fertility with special reference to biological variables. Edited by Gray R, Leridon, H and Spira A in Biomedical and Demographic Determinants of Reproduction. Clarendon Press Oxford. 1993: 50–64.
[3] Eveleth PB and Tanner JM. (1976). World wide variations in human growth. Cambridge University Press, Cambridge.
[4] Johnson, N.L. and S. Kotz. (1970). Continuous distributions. John Wiley & Sons, New York, USA.
[5] Marshall WA and Tanner M. Puberty. (1986). Edited WA Marshall and JM Tanner. Human Growth, 2nd edn. Plenum Press, London. 171–209.
[6] Nambodiri, N.K. and C.M. Suchindran. (1987). Life table techniques and their applications. Academic Press, New York, U.S.A.
[7] Nakamura I, Shirmura M, Nonakand K and Miura T. (1986). Changes of recollected menarcheal age and month among woman in Tokyo over a period of 90 years. Annals of Human Biology. 13(6): 547–54.
[8] Prado C. (1984). Secular change in menarche in woman in Madri. Annals of Human Biology. 11(2): 165–6.
[9] Riley AP, Samuelson JL and Huffman SL. (1993). The relationship of age at menarche and fertility in undernourished adolescents. Ed. by Gray R Leridon H and Spira A in Biomedical and Demographic Determinants of Reproduction. Clarendon Press Oxford. 50–64.
[10] Singh, Brijesh P. and Singh G. (2021). Age at menarche in India. India 2020: Population and Social Protection, Ed. by Aalok Ranjan, MLC Foundation, Shyam Institute, Bhopal, 85–94.
[11] Singh, Brijesh P., Nidhi and Muskan (2020). Assessment of practices on menstrual hygiene in girls reside in university hostel. International Journal of Medical and Health Research. 6(8): 198–200.
[12] Thomas F, Renaud F, Benefice E. Meeus TD and Guegan JF. (2001). International variability of ages at menarche and menopause: patterns and main determinants. Human Biology. 73(2): 272–290.
[13] Urdy JR and Cliquet RL. (1982). A cross-cultural examination of the relationship between ages at menarche, marriage and first birth. Demography. 19(1): 53–63.
[14] Varea C, Bernis C, Montero P, Aris S, Barroso, A and Gongales B. (2000). Secular trends and intra populational variability in age at menopause in Spanish women. Journal of Bio-social Science. 32: 383–393.
[15] Wyshak G. (1984). Secular changes in age at menarche in a sample of US women. Annals of Human Biology. 10(1): 75–7.
[16] Wyshak G and Frisch RE. (1982). Evidence of a secular trend in age at menarche. New England of Journal of Medicine. 306(17): 1033–5.
Biography

Brijesh P. Singh is currently working as Professor in the Department of Statistics, Institute of Science, Banaras Hindu University, Varanasi, India. He obtained his Ph.D. degree in Statistics from Banaras Hindu University, Varanasi. He has a more than 20 years of teaching and research experience in the area of Statistical Demography. He has published 153 research articles in the various refereed journals and books of national and international repute. Also he edited 2 books containing research papers and has a reference book for data analysts. His area of research interests are statistical modeling and analysis of demographic phenomenon specially fertility, mortality, reproductive health and domestic violence with its reason and consequences.
Journal of Reliability and Statistical Studies, Vol. 14, Issue 2 (2021), 541–550.
doi: 10.13052/jrss0974-8024.1428
© 2021 River Publishers