Design of Improved EWMA Control Chart for Monitoring the Process Mean Using New Median Quartile Double Ranked Set Sampling
Wasif Yasin, Muhammad Tayyab* and Muhammad Hanif
Department of Statistics, National College of Business Administration and Economics, Lahore, Pakistan
E-mail: wasif.yasin988@gmail.com; m_tayyab82@hotmail.com; drhanif@ncbae.edu.pk
*Corresponding Author
Received 31 July 2021; Accepted 28 October 2021; Publication 06 December 2021
Abstract
It is essential to monitor the mean of a process regarding quality characteristics for the ongoing production. For enhancement of mean monitoring power of the exponentially weighted moving average (EWMA) chart, a new median quartile double ranked set sampling (MQDRSS) based EWMA control chart is proposed and named as EWMA-MQDRSS chart. In order to study the performance of the developed EWMA-MQDRSS chart, performance measures; average run length, and the standard deviation of run length are used. The shift detection ability of the proposed chart has been compared with counterparts, under the simple random sampling and ranking based sampling techniques. The extensive simulation-based results indicate that the EWMA-MQDRSS chart performs better to trace all kinds of shifts than the existing charts. An illustrative application concerning monitoring the diameter of the piston ring of a machine is also provided to demonstrate the practical utilization of the suggested chart.
Keywords: Average run length, control chart, EWMA, ranked set sampling, simulation.
1 Introduction
Statistical process control (SPC) comprises tools that can be beneficial for checking the shift in process parameters. In competitive markets at present, there prevails a great tussle between the various competitive service providers, and sustainability of the value of the goods or amenities is vital for the contentment of the clients to carry on and for capturing the industry. The buyers have various choices that they can select from, thus, product quality plays a key role in attracting the consumers. Control charts are the most refined and frequently adopted SPC tool in industries like medicine, ecology and technology used to monitor study variable during the production and to focus the situation where the process gets out of control (OOC). A process is considered in control (IC) if production is controlled in a way that measurement of process production variation remains between given lower and upper control limits. Effective monitoring of mean during the production process by an economical sampling scheme has gained reasonable attention of the quality statistician to retain the quality of products (Montgomery, 2009).
The idea of control chart used for monitoring the process mean was given by Shewhart (1924) and this chart is very beneficial to determine the major change in process parameters. The EWMA charting structure is developed by Roberts (1959) for monitoring unnatural changes in the process and showed this as a better alternative of the mean chart to trace small or modest changes in the process mean. The sample measurements of the quality characteristic for constructing control charting structures involve cost and time constraints and ranked set sampling (RSS) is an inexpensive and efficient alternate of simple random sampling (SRS) mostly in conditions where measurement on the selected matters are challenging or costly to obtain, but, on the other hand, the ranking of the elements permitting to the study variable is comparatively easy and economical. The RSS along with its modified forms has been effectively used to improve the efficiency of charts for monitoring of process mean. McIntyre (1952) firstly presented the idea of RSS for estimation of the average production of the pasture. The author established it as a valued sampling technique that provides more effectual estimates than the SRS technique. Median RSS (MRSS) and quartile RSS (QRSS) are the efficient modified RSS schemes suggested by Muttlak (1997, 2003) for parametric estimation. In order to pursue a more efficient sampling scheme, Al-Saleh and Al-Kadiri (2000) and Al-Omari and Al-Saleh (2009) suggested extensions of RSS, named double RSS (DRSS) and quartile double RSS (QDRSS) schemes respectively, for estimating the population mean more effectively than usual RSS.
Abujiya and Muttlak (2004, 2007) investigated that Median double RSS (MDRSS) and Extreme double RSS (EDRSS) schemes based charts perform better in detecting shift in the process mean than the conventional RSS scheme. Al-Omari and Haq (2012) used Shewhart chart for betterment in the process monitoring by using DRSS schemes like double quartile RSS (DQRSS), QDRSS and double extreme RSS (DERSS). Abujiya and Lee (2013) extended the work on EWMA, CUSUM and Shewhart charts by applying RSS techniques, instead of SRS technique and they showed that the charts based on RSS techniques to be more sensitive when judge against its competitors in SRS. Haq et al. (2015) produced EWMA charts under perfect mixed RSS (MxRSS) and imperfect mixed RSS (IMxRSS) and concluded based on average run length (ARL), mean deviation of run length (MDRL) and standard deviation of run length (SDRL) values that the new charts are performing more efficiently when compared with classical EWMA chart in tracing a shift in the process location. Tayyab et al. (2019) presented paired RSS based EWMA type charts and explored that these developed charts are cost-effective and more sensible for detection the shift than that of EWMA-SRS chart. Some efficient charts were also proposed by Noor-ul-Amin et al. (2019) by using Paired DRSS (PDRSS), extreme PDRSS (EPDRSS) and quartile PDRSS (QPDRSS) strategies. ARL and SDRL were used to compare the enactment of proposed and existing charts via simulation study. Noor-ul-Amin and Tayyab (2020) enhanced the efficiency of the EWMA chart by using economical and well-organized RSS type techniques. Ali et al. (2020) used the RSS scheme to design a new non-parametric EWMA sign chart and studied the performance of the suggested chart when data is not normal.
The use of an efficient sampling technique has a key role in enhancing the shift detection ability of charts to improve the monitoring of process parameters. In this research study, a new and efficient MQDRSS scheme is introduced to design the EWMA-MQDRSS chart for mean monitoring with the aim of enhancing the ability of the chart to identify the small to moderate shifts. The proposed chart is also valuable in such circumstances when some supplementary information about the quality characteristic of interest is already available without any extra cost. The additional information can be useful for ranking mechanism and helpful to draw more representative sample to get an actual measurement of quality characteristic under study. We expect that the suggested chart will be more efficient for diagnosing the unnatural variation in the process mean than its counterparts. The upcoming formation of the manuscript is followed by Section 2 which is being delivered the design structure of efficient EWMA-MQDRSS chart. The performance evaluation and comparative study of the suggested chart is presented in Section 3, followed by the application of the EWMA-MQDRSS chart in Section 4. Finally, this study ends with conclusions and recommendations.
2 Design of the Proposed EWMA-MQDRSS Control Chart
In this section, an efficient EWMA charting structure has been designed by exploiting a new ranked based sampling scheme named as MQDRSS. The proposed chart is named as EWMA-MQDRSS chart and it is more beneficial when the ranking mechanism of quality characteristic of interest occurs without any cost. The proposed ranked based MQDRSS procedure is provided in the following steps.
Step 1. Select units from population and distribute these units between sets at random. Each set contains subsets of units.
Step 2. Without identifying actual measurements, the units of each subset of sets are ranked visually or with auxiliary information or by any cost-free method, and then apply MRSS design on the sets. This step contains median ranked set samples of size each.
Step 3. Again rank each median ranked set sample, obtained during Step 2, and then apply QRSS to select improved DRSS (MQDRSS) of size for the actual measurement.
Step 4. Repeat the Steps 1–3 independently times, if essential to select a final sample of size .
The following example illustrates the MQDRSS procedure for selecting the sample with size 6.
Example: To select a MQDRSS of size for , identify (6 sets of size 36 each) sampling units. Let be the smallest ranked unit from subset of the set, where . Rank the units of each subset of all 6 sets, according to the variable under study.
| (1) |
Then select the middle units in boxes from each set and the sampling units in each set are given in rows, as follows:
| (2) |
Without quantifying the actual measurement of the units of these subsets, rank units of each subset of above set again and then choose ranked unit (in boxes), i.e. from subset and choose ranked unit (in boxes), i.e. from subset for actual quantification shown as below:
| (3) |
The units in boxes represent MQDRSS of size .
Assume that be a random sample of size drawn from a distribution with density function , distribution function , mean and variance . The SRS mean is and along with . The cycle in this study is replicated once i.e. . Let shows first quartile unit from subset and shows third quartile unit from subset for even sample size. Let shows first quartile unit from subset , shows third quartile unit from subset and be the median of set for odd sample size. Note that , and . It is also assumed that and be the MQDRSS mean estimators for the even and odd sample sizes, respectively. The respective and estimators are defined as:
| (4) |
and
| (5) |
Following the structure of the Classical EWMA Chart (Montgomery, 2009), a sample of size based on MQDRSS design at each time point is considered. We also assume that be the sequence of identically, independently and normally distributed random variables, for and denotes the mean of sample at . By using the , the EWMA-MQDRSS statistic (plotting statistic) is defined as
| (6) |
where is the smoothing-constant, and when is not known. The variance of is derived by
| (7) |
Control limits of the proposed EWMA-MQDRSS chart is given by
| (8) |
where
| (9) |
and
| (10) |
Here, is a control-coefficient of EWMA-MQDRSS chart, and signify the lower and the upper control limits. The value of is determined, according to the pre-specified value of . Furthermore, a process under EWMA-MQDRSS chart is called OOC, if the plotting-statistic lies beyond the and .
3 Performance Evaluation and Comparative Study
To assess the efficiency of EWMA-MQDRSS chart for IC and OOC situations, we used ARL and SDRL as performance measures. The values of run-length (RL) for proposed EWMA-type chart and considered modified DRSS based charts (EWMA-DRSS, EWMA-EDRSS, EWMA-MDRSS and EWMA-QDRSS) are calculated by using Monte Carlo simulation study in R-Language. On the basis of IC process, standard normal distribution is used and 100,000 samples of size are randomly chosen then estimated lower and upper limits of EWMA-DRSS, EWMA-EDRSS, EWMA-MDRSS, EWMA-QDRSS, EWMA-SRS and EWMA-MQDRSS charts with exact-ranking. With the setting of , the simulated 10,000 Phase-II samples of size in each, are drawn from and then ARL with SDRL estimated results of considered and proposed charts are determined. For evaluating the performance of the proposed EWMA-MQDRSS chart, we reported the values of with various choices of for which is fixed at 370 and results are given in Table 1. For comparative study, we have taken , , and for justifiable reasoning of suggested chart and RL results are placed in Tables 2–5.
Table 1 Performance evaluation of the proposed EWMA-MQDRSS chart for various choices of when and
| 0.00 | ARL | 370.7207 | 370.9989 | 371.8835 | 370.7247 |
| SDRL | 379.1414 | 371.4939 | 368.3937 | 365.4463 | |
| 0.05 | ARL | 115.7943 | 150.2544 | 211.6349 | 262.4377 |
| SDRL | 112.3641 | 144.5767 | 210.2592 | 260.1857 | |
| 0.10 | ARL | 41.0214 | 52.0252 | 84.3254 | 136.5405 |
| SDRL | 34.7925 | 46.1766 | 82.7830 | 136.8407 | |
| 0.25 | ARL | 8.8857 | 10.1607 | 13.5716 | 22.7962 |
| SDRL | 6.0978 | 6.9956 | 10.5585 | 20.8639 | |
| 0.50 | ARL | 2.9398 | 3.2663 | 3.6870 | 4.5188 |
| SDRL | 1.6914 | 1.8133 | 2.0755 | 3.0729 | |
| 0.75 | ARL | 1.6529 | 1.7937 | 1.9516 | 2.1144 |
| SDRL | 0.7845 | 0.8549 | 0.9293 | 1.0806 | |
| 1.00 | ARL | 1.2026 | 1.2713 | 1.3373 | 1.3978 |
| SDRL | 0.4296 | 0.4855 | 0.5340 | 0.5868 | |
| 1.25 | ARL | 1.0408 | 1.0638 | 1.0960 | 1.1111 |
| SDRL | 0.1983 | 0.2472 | 0.2959 | 0.3215 | |
| 1.50 | ARL | 1.0073 | 1.0092 | 1.0168 | 1.0180 |
| SDRL | 0.0851 | 0.0954 | 0.1285 | 0.1344 | |
| 1.75 | ARL | 1.0006 | 1.0011 | 1.0015 | 1.0024 |
| SDRL | 0.0244 | 0.0331 | 0.0387 | 0.0489 | |
| 2.00 | ARL | 1.0000 | 1.0000 | 1.0001 | 1.0001 |
| SDRL | 0.0000 | 0.0000 | 0.0100 | 0.0100 | |
| 3.00 | ARL | 1.0000 | 1.0000 | 1.0000 | 1.0000 |
| SDRL | 0.0000 | 0.0000 | 0.0000 | 0.0000 | |
Table 2 Performance comparison of EWMA-MQDRSS chart when and
| CHART | |||||||
| EWMA- | EWMA- | EWMA- | EWMA- | EWMA- | EWMA- | ||
| SRS | DRSS | EDRSS | QDRSS | MDRSS | MQDRSS | ||
| 0.00 | ARL | 200.7897 | 200.1237 | 200.8548 | 200.1214 | 200.559 | 200.6491 |
| SDRL | 216.5813 | 217.5797 | 211.9462 | 214.9439 | 213.325 | 218.1511 | |
| 0.05 | ARL | 177.6349 | 113.1382 | 135.2745 | 100.0508 | 88.1721 | 73.4607 |
| SDRL | 190.0858 | 116.6684 | 143.7699 | 101.8467 | 88.6285 | 72.1830 | |
| 0.10 | ARL | 129.6552 | 53.2011 | 74.5652 | 43.0920 | 36.7537 | 27.8757 |
| SDRL | 136.3758 | 50.8719 | 73.5582 | 40.4018 | 33.0570 | 24.2009 | |
| 0.25 | ARL | 47.9933 | 13.4452 | 19.5807 | 10.8511 | 8.8225 | 6.5662 |
| SDRL | 45.6784 | 10.6625 | 16.1643 | 8.4339 | 6.6426 | 4.6751 | |
| 0.50 | ARL | 17.1182 | 4.4524 | 6.6145 | 3.5938 | 2.9796 | 2.2705 |
| SDRL | 13.9193 | 3.0037 | 4.7619 | 2.3726 | 1.8480 | 1.2845 | |
| 0.75 | ARL | 9.0689 | 2.4498 | 3.5120 | 2.0071 | 1.6908 | 1.3788 |
| SDRL | 6.8293 | 1.4363 | 2.2523 | 1.0842 | 0.8466 | 0.5982 | |
| 1.00 | ARL | 5.6700 | 1.6498 | 2.3006 | 1.4112 | 1.2530 | 1.0883 |
| SDRL | 3.9387 | 0.8216 | 1.3090 | 0.6316 | 0.4823 | 0.2868 | |
| 1.25 | ARL | 4.0353 | 1.2868 | 1.6928 | 1.1504 | 1.0630 | 1.0110 |
| SDRL | 2.6824 | 0.5195 | 0.8451 | 0.3773 | 0.2478 | 0.1043 | |
| 1.50 | ARL | 3.0331 | 1.1163 | 1.3910 | 1.0421 | 1.0113 | 1.0008 |
| SDRL | 1.8725 | 0.3301 | 0.6108 | 0.2013 | 0.1057 | 0.0282 | |
| 1.75 | ARL | 2.4162 | 1.0370 | 1.1870 | 1.0075 | 1.0014 | 1.0001 |
| SDRL | 1.4216 | 0.1914 | 0.4229 | 0.0862 | 0.0373 | 0.0100 | |
| 2.00 | ARL | 2.0176 | 1.0088 | 1.0904 | 1.0010 | 1.0000 | 1.0000 |
| SDRL | 1.1141 | 0.0933 | 0.2919 | 0.0316 | 0.0000 | 0.0000 | |
| 3.00 | ARL | 1.2566 | 1.0000 | 1.0008 | 1.0000 | 1.0000 | 1.0000 |
| SDRL | 0.4918 | 0.0000 | 0.0282 | 0.0000 | 0.0000 | 0.0000 | |
Table 3 Performance comparison of EWMA-MQDRSS chart when and
| CHART | |||||||
| EWMA- | EWMA- | EWMA- | EWMA- | EWMA- | EWMA- | ||
| SRS | DRSS | EDRSS | QDRSS | MDRSS | MQDRSS | ||
| 0.00 | ARL | 200.986 | 201.7473 | 200.0152 | 201.3467 | 200.6361 | 200.555 |
| SDRL | 216.9549 | 215.5833 | 218.9451 | 216.4543 | 214.4325 | 220.0323 | |
| 0.05 | ARL | 173.1492 | 107.0433 | 129.0895 | 94.9536 | 78.8984 | 58.7670 |
| SDRL | 184.8944 | 110.5526 | 137.8684 | 97.6608 | 79.0397 | 56.5090 | |
| 0.10 | ARL | 129.1749 | 48.3775 | 67.0559 | 39.7094 | 30.6945 | 21.2337 |
| SDRL | 133.7282 | 45.9790 | 66.5801 | 36.5590 | 26.7145 | 17.9833 | |
| 0.25 | ARL | 48.3291 | 11.8660 | 17.2783 | 9.5450 | 7.2080 | 4.9118 |
| SDRL | 46.0134 | 9.2268 | 14.1144 | 7.3246 | 5.3592 | 3.3502 | |
| 0.50 | ARL | 17.1921 | 3.9060 | 5.9112 | 3.2105 | 2.4942 | 1.8078 |
| SDRL | 13.9757 | 2.5468 | 4.2227 | 2.0291 | 1.4724 | 0.9450 | |
| 0.75 | ARL | 8.9453 | 2.1744 | 3.0994 | 1.8253 | 1.4774 | 1.1714 |
| SDRL | 6.7397 | 1.2100 | 1.9160 | 0.9486 | 0.6811 | 0.3987 | |
| 1.00 | ARL | 5.6581 | 1.4991 | 2.0679 | 1.2953 | 1.1283 | 1.0182 |
| SDRL | 3.9923 | 0.7091 | 1.1283 | 0.5277 | 0.3447 | 0.1344 | |
| 1.25 | ARL | 4.0113 | 1.2013 | 1.5502 | 1.0925 | 1.0218 | 1.0011 |
| SDRL | 2.6510 | 0.4326 | 0.7472 | 0.2975 | 0.1460 | 0.0331 | |
| 1.50 | ARL | 3.0399 | 1.0600 | 1.2656 | 1.0200 | 1.0027 | 1.0001 |
| SDRL | 1.8907 | 0.2416 | 0.4984 | 0.1414 | 0.0518 | 0.0100 | |
| 1.75 | ARL | 2.4131 | 1.0173 | 1.1274 | 1.0027 | 1.0000 | 1.0000 |
| SDRL | 1.3942 | 0.1319 | 0.3458 | 0.0518 | 0.0000 | 0.0000 | |
| 2.00 | ARL | 2.0153 | 1.0024 | 1.0524 | 1.0005 | 1.0000 | 1.0000 |
| SDRL | 1.1071 | 0.0489 | 0.2246 | 0.0223 | 0.0000 | 0.0000 | |
| 3.00 | ARL | 1.2558 | 1.0000 | 1.0003 | 1.0000 | 1.0000 | 1.0000 |
| SDRL | 0.4902 | 0.0000 | 0.0173 | 0.0000 | 0.0000 | 0.0000 | |
Table 4 Performance comparison of EWMA-MQDRSS chart when and
| CHART | |||||||
| EWMA- | EWMA- | EWMA- | EWMA- | EWMA- | EWMA- | ||
| SRS | DRSS | EDRSS | QDRSS | MDRSS | MQDRSS | ||
| 0.00 | ARL | 370.0326 | 370.9499 | 370.1715 | 372.7233 | 376.9636 | 370.7616 |
| SDRL | 390.7855 | 388.4784 | 384.993 | 385.2872 | 390.0622 | 377.9665 | |
| 0.05 | ARL | 313.4847 | 187.2319 | 229.7951 | 163.532 | 135.0883 | 107.8952 |
| SDRL | 325.4136 | 184.0379 | 228.0746 | 158.6047 | 132.0583 | 107.6180 | |
| 0.10 | ARL | 212.6695 | 75.7897 | 108.5092 | 61.4427 | 49.8817 | 35.7901 |
| SDRL | 216.6743 | 70.9902 | 103.3676 | 55.0476 | 43.4161 | 29.6895 | |
| 0.25 | ARL | 67.2010 | 16.5372 | 25.5354 | 13.1974 | 10.7230 | 7.6545 |
| SDRL | 60.2927 | 12.4413 | 20.3130 | 9.5039 | 7.5885 | 5.1434 | |
| 0.50 | ARL | 21.5543 | 5.2649 | 8.0259 | 4.2788 | 3.4836 | 2.5779 |
| SDRL | 16.5424 | 3.3811 | 2.5336 | 2.6290 | 2.0544 | 1.4469 | |
| 0.75 | ARL | 10.8764 | 2.8238 | 4.1419 | 2.2533 | 1.8825 | 1.4938 |
| SDRL | 7.6838 | 1.5885 | 2.5336 | 1.2169 | 0.9440 | 0.6660 | |
| 1.00 | ARL | 6.7223 | 1.8559 | 2.6353 | 1.5605 | 1.3482 | 1.1326 |
| SDRL | 4.4488 | 0.9141 | 1.4544 | 0.7139 | 0.5560 | 0.3524 | |
| 1.25 | ARL | 4.7155 | 1.4008 | 1.9305 | 1.2233 | 1.1063 | 1.0195 |
| SDRL | 2.9341 | 0.6033 | 0.9843 | 0.4452 | 0.3165 | 0.1382 | |
| 1.50 | ARL | 3.5408 | 1.1788 | 1.5309 | 1.0697 | 1.0227 | 1.0014 |
| SDRL | 2.1185 | 0.4003 | 0.6927 | 0.2573 | 0.1509 | 0.0373 | |
| 1.75 | ARL | 2.7752 | 1.0639 | 1.2845 | 1.0411 | 1.0027 | 1.0001 |
| SDRL | 1.5760 | 0.2470 | 0.5079 | 0.1179 | 0.0518 | 0.0100 | |
| 2.00 | ARL | 2.2915 | 1.0175 | 1.1401 | 1.0021 | 1.002 | 1.0000 |
| SDRL | 1.2349 | 0.1311 | 0.3595 | 0.0457 | 0.0141 | 0.0000 | |
| 3.00 | ARL | 1.3594 | 1.0001 | 1.0021 | 1.0000 | 1.0000 | 1.0000 |
| SDRL | 0.5646 | 0.0100 | 0.0457 | 0.0000 | 0.0000 | 0.0000 | |
Table 5 Performance comparison of EWMA-MQDRSS chart when and
| CHART | |||||||
| EWMA- | EWMA- | EWMA- | EWMA- | EWMA- | EWMA- | ||
| SRS | DRSS | EDRSS | QDRSS | MDRSS | MQDRSS | ||
| 0.00 | ARL | 370.0875 | 370.9484 | 370.7777 | 370.8612 | 370.725 | 371.5046 |
| SDRL | 385.2726 | 383.7889 | 380.3405 | 387.8859 | 384.3543 | 393.1296 | |
| 0.05 | ARL | 310.4283 | 166.3566 | 222.0646 | 148.7629 | 119.1026 | 83.6310 |
| SDRL | 321.4991 | 167.8902 | 232.1651 | 148.1591 | 118.3827 | 78.0557 | |
| 0.10 | ARL | 213.3268 | 67.1165 | 98.7937 | 53.5403 | 39.9294 | 27.0221 |
| SDRL | 217.2951 | 62.4886 | 95.1638 | 47.4724 | 34.0929 | 21.9266 | |
| 0.25 | ARL | 67.5817 | 14.6152 | 22.0425 | 11.6448 | 8.7304 | 5.9358 |
| SDRL | 62.0721 | 10.7303 | 17.0660 | 8.2402 | 5.9435 | 3.8783 | |
| 0.50 | ARL | 21.5311 | 4.6158 | 6.9785 | 3.7713 | 2.8505 | 2.0148 |
| SDRL | 16.4577 | 2.8935 | 4.6216 | 2.3092 | 1.6084 | 1.0444 | |
| 0.75 | ARL | 10.8690 | 2.4713 | 3.6330 | 2.0373 | 1.6127 | 1.2470 |
| SDRL | 7.6183 | 1.3560 | 2.1461 | 1.0589 | 0.7637 | 0.4728 | |
| 1.00 | ARL | 6.7976 | 1.6569 | 2.3372 | 1.4206 | 1.1854 | 1.0381 |
| SDRL | 4.5554 | 0.7842 | 1.2372 | 0.6162 | 0.4106 | 0.1924 | |
| 1.25 | ARL | 4.7242 | 1.2750 | 1.7506 | 1.1397 | 1.0375 | 1.0016 |
| SDRL | 2.9632 | 0.4945 | 0.8480 | 0.3511 | 0.1899 | 0.0399 | |
| 1.50 | ARL | 3.5357 | 1.1025 | 1.3878 | 1.0356 | 1.0039 | 1.0000 |
| SDRL | 2.1033 | 0.3111 | 0.5889 | 0.1858 | 0.0623 | 0.0000 | |
| 1.75 | ARL | 2.7870 | 1.0291 | 1.1847 | 1.0049 | 1.0003 | 1.0000 |
| SDRL | 1.5820 | 0.1698 | 0.4144 | 0.0698 | 0.0173 | 0.0000 | |
| 2.00 | ARL | 2.2983 | 1.0069 | 1.0782 | 1.0005 | 1.0000 | 1.0000 |
| SDRL | 1.2267 | 0.0827 | 0.2714 | 0.0223 | 0.0000 | 0.0000 | |
| 3.00 | ARL | 1.3625 | 1.0000 | 1.0006 | 1.0000 | 1.0000 | 1.0000 |
| SDRL | 0.5686 | 0.0000 | 0.0244 | 0.0000 | 0.0000 | 0.0000 | |
On the basis of ARL with SDRL results presented in Tables 1–5, a descriptive list of key findings is given as:
• In Table 1, when value of decreases, the shift finding ability of the proposed EWMA-MQDRSS chart escalates for all shifts. For example, for and at , the OOC ARL values are 136.5405, 84.3254, 52.0252 and 41.0214 respectively. It indicates that designed chart performs well for several shifts with . Therefore, the value of is choose for all comparison cases.
• Tables 2–5 demonstrate that the values of for proposed chart decline quickly at a fixed when the process turns into OOC. For with , the value of proposed chart is decreased speedily at 27.8757 for .
• The SDRL values of EWMA-MQDRSS chart also decrease speedily when the value of increases.
• For a given value of , the value of of EWMA-MQDRSS chart declines rapidly as decreases, e.g. for , values are 370, 200 and the corresponding values are 107.8952, 73.4607 respectively when .
• When the value of increases, the value of of offered EWMA-type chart decreases. For instance, for at with , values are 7.6545, 5.9358 respectively. This indicates that a greater value of increases the shift finding ability of EWMA-MQDRSS chart. The decrease in the values of of the proposed chart is quicker than all existing charting structures.
• The performance of the proposed EWMA-MQDRSS chart is better in detecting a shift in the process mean than considered EWMA-DRSS, EWMA-EDRSS, EWMA-MDRSS, EWMA-QDRSS, and EWMA-SRS charts.
• The recommended EWMA-MQDRSS chart capably detects small, moderate, and up to a certain degree large shifts for process mean.
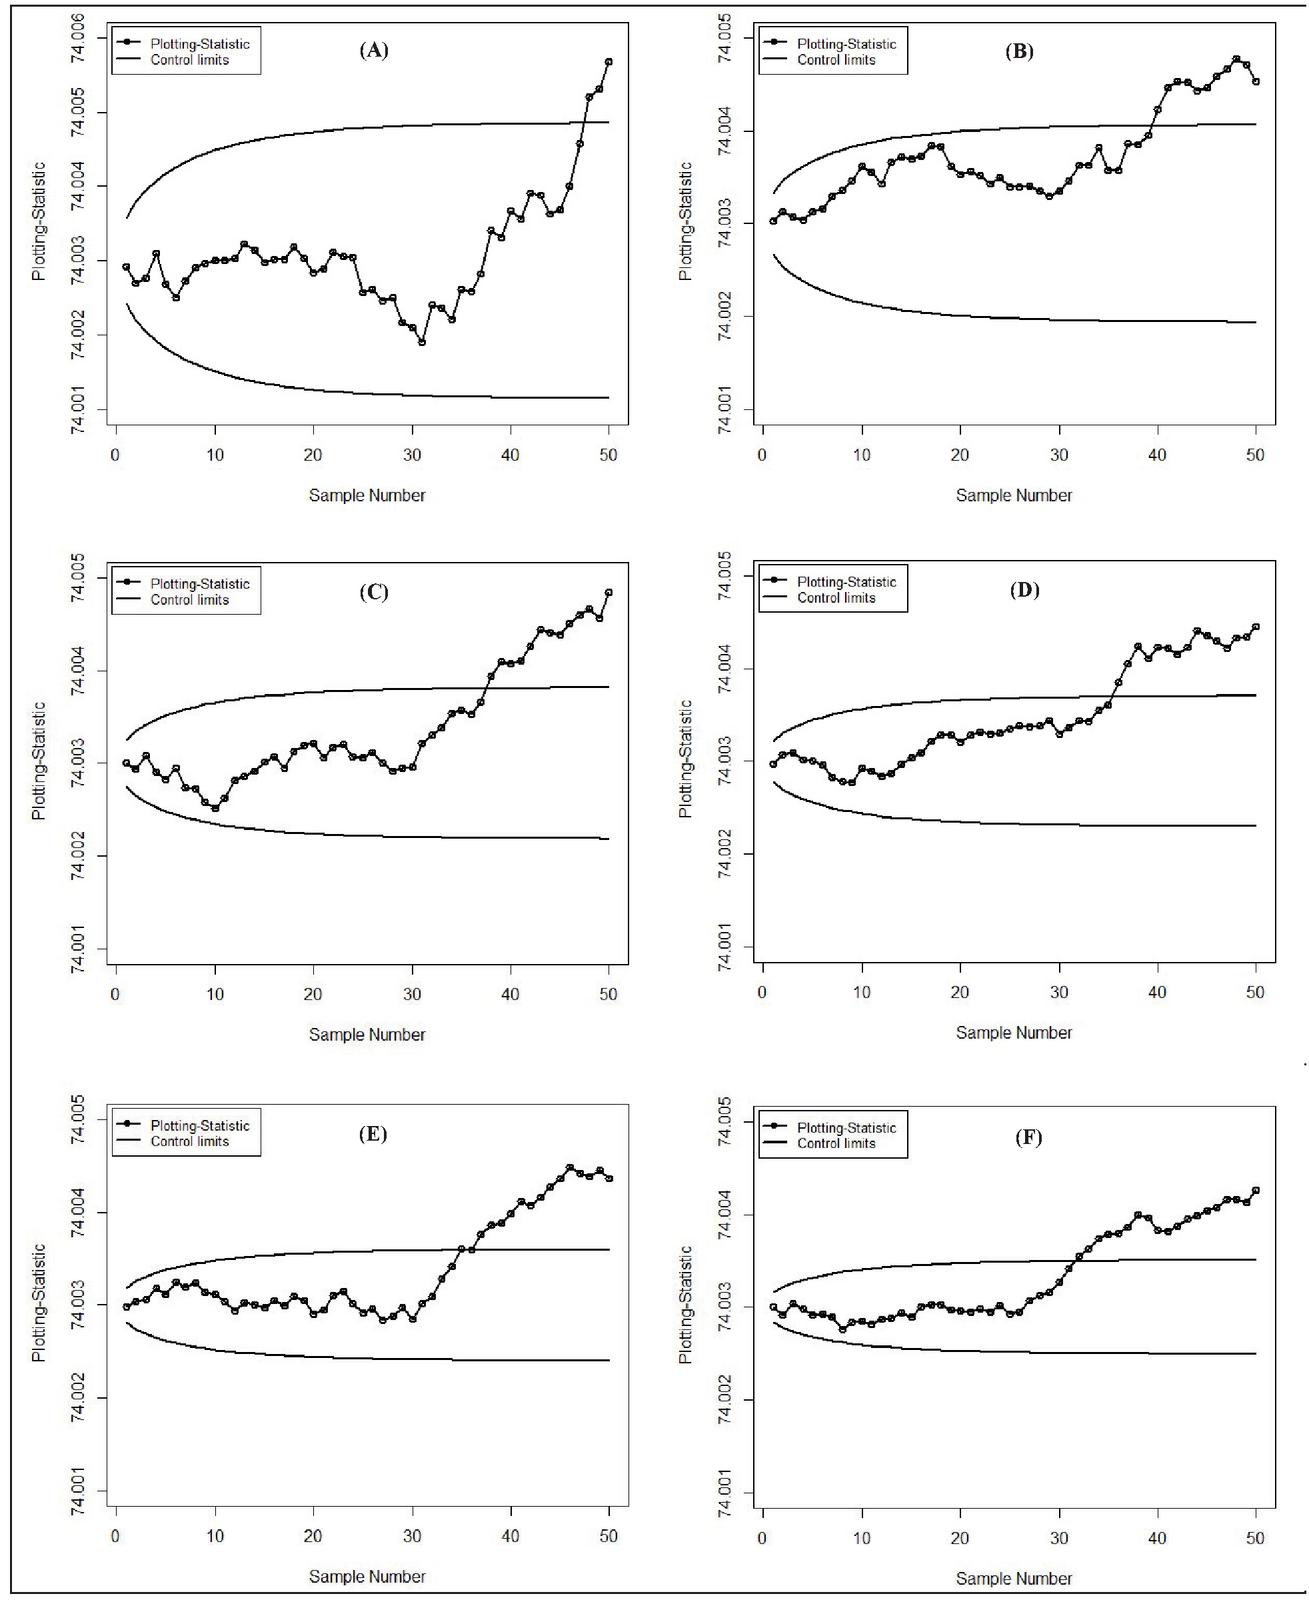
Figure 1 The shift detection ability comparison between (A) EWMA-SRS, (B) EWMA-EDRSS, (C) EWMA-DRSS, (D) EWMA-QDRSS, (E) EWMA-MDRSS and (F) EWMA-MQDRSS charts.
4 An Application
In this section, a practical example to illustrate the application of the proposed EWMA-MQDRSS chart is provided using a real data set. Suppose that we need to determine statistical control the diameter of piston ring of a machine, produced through a forgoing process (Montgomery, 2009). The 40 samples with size five each, are selected for this process. The measurement of diameters is considered in mm. All samples are combined such that to have a population of 200 measurements and this dataset is utilized for selecting SRS, DRSS, EDRSS, MDRSS, QDRSS, and MQDRSS based samples. We applied the Shapiro-Wilk normality test and found that the dataset is normally distributed. We set with for EWMA-MQDRSS and considered competitor charts.
Thirty samples of size 6 in each are generated using MQDRSS, SRS, QDRSS, EDRSS, MDRSS and DRSS methods, from the population, and these thirty samples are described as Phase-I samples. These sample measurements are exploited for computing the control limits and plotting statistics of EWMA-DRSS, EWMA-EDRSS, EWMA-MDRSS, EWMA-QDRSS, EWMA-SRS and EWMA-MQDRSS charts. Later on, twenty new samples of size 6 in each are again generated from above mentioned charting structures, by adding , in the piston rings data, for monitoring of phase-II. The graphical display of the proposed and considered EWMA-type charts, using data, is presented in Figure 1.
The results given in Figure 1 show that the proposed EWMA-MQDRSS and considered EWMA structures are capturing shifts after sample number 30 which indicates the process is IC for the first 30 samples. It is also observed that EWMA-SRS, EWMA-EDRSS, EWMA-DRSS, EWMA-QDRSS, EWMA-MDRSS and EWMA-MQDRSS charts trigger the OOC signal at sample number 48, 40, 38, 36, 35 and 32, respectively. This demonstrates the better shift capturing ability of the designed EWMA-MQDRSS chart as judged against its EWMA-type counterparts. This superiority of proposed chart for real life example validates the run-length results of Section 3 and conclude that suggested EWMA-MQDRSS chart is the best among all its EWMA counterparts.
5 Conclusion
In this study, a new memory type chart has been designed to monitor the process mean, by introducing a more efficient MQDRSS scheme and named as EWMA-MQDRSS chart. This chart, for various controlled and out-of-controlled situations, has been evaluated and comparison has been made with conventional EWMA-SRS and DRSS based EWMA type charts (EWMA-EDRSS, EWMA-MDRSS, EWMA-QDRSS and EWMA-DRSS). The performance measures ARL and SDRL are used for this purpose. It is discovered from the simulation results of OOC RL performance that the proposed EWMA-MQDRSS chart outperforms the considered charts by detecting shift first in mean of the process. An illustrative application concerning the monitoring the diameter of the piston ring of a machine determines the superiority of the proposed chart for identification of small and moderate shifts while justifiably sustaining its worth for large shifts. These findings of current study demonstrate that the proposed EWMA-MQDRSS chart is used effectively for mean monitoring than its counterparts and also recommended most beneficial when ranking the units is economical and easier before selection of units for actual measurement. The proposed study can be extended with auxiliary information and a new HEWMA chart could also be designed.
References
[1] Abujiya, M. R. and Lee, M. H. (2013). The three statistical control charts using ranked set sampling. In: 5th International Conference on Modeling, Simulation and Applied Optimization (ICMSAO). Hammamet Tunisia, 1–6.
[2] Abujiya, M. R. and Muttlak, H. A. (2004). Quality control chart for the mean using double ranked set sampling, Journal of Applied Statistics, 31(10), pp. 1185–1201.
[3] Abujiya, M. R. and Muttlak, H. A. (2007). Monitoring the process mean and variance using ranked set sampling and its modifications, J. Stat. Theory Appl., 6(4), pp. 408–422.
[4] Ali, S., Abbas, Z., Nazir, H. Z., Riaz, M., Zhang, X. and Li, Y. (2020). On designing non-parametric EWMA sign chart under ranked set sampling scheme with application to industrial process, Mathematics, 8, 1497. doi.org/10.3390/math8091497.
[5] Al-Omari, A. I. and Al-Saleh, M. F. (2009). Quartile double ranked set sampling for estimating the population mean, Econ. Qual. Control, 24(2), pp. 243–253.
[6] Al-Omari, A. I. and Haq, A. (2012). Improved quality control charts for monitoring the process mean using double-ranked set sampling methods, Journal of Applied Statistics, 39(4), pp. 745–763.
[7] Al-Saleh, M. F. and Al-Kadiri, M. A. (2000). Double ranked set sampling, Statistics and Probability Letters, 48(2), pp. 205–212.
[8] Haq, A., Brown, J. and Moltchanova, E. (2015). A new exponentially weighted moving average control chart for monitoring the process mean, Quality and Reliability Engineering International, 31(8), pp. 1623–1640.
[9] McIntyre, G. A. (1952). A method for unbiased selective sampling using ranked sets, Australian Journal of Agricultural Research, 3, pp. 385–390.
[10] Montgomery, D. C. (2009). Introduction to Statistical Quality Control, John Wiley and Sons, New York.
[11] Muttlak, H. A. (1997). Median ranked set sampling, Journal of Applied Statistical Sciences, 6(4), pp. 245–255.
[12] Muttlak, H. A. (2003). Investigating the use of quartile ranked set samples for estimating the population mean, Applied Mathematics and Computation, 146, pp. 437–443.
[13] Noor-ul-Amin, M. and Tayyab, M (2020). Enhancing the performance of exponential weighted moving average control chart using paired double ranked set sampling, Journal of Statistical Computation and Simulation, 90(6), pp. 1118–1130.
[14] Noor-ul-Amin, M., Arif, F. and Hanif, M. (2019). Joint monitoring of mean and variance using likelihood ratio test statistic under pair ranked set sampling scheme, Iranian Journal of Science and Technology, Transections A: Science, 43(5), pp. 2449–2460.
[15] Roberts, S. W. (1959). Control chart tests based on geometric moving averages, Technometrics, 1(3), pp. 239–250.
[16] Shewhart, W. A. (1924). Some applications of statistical schemes to the analysis of physical and engineering data, Bell Technical Journal, 3, pp. 43–87.
[17] Tayyab, M., Noor-ul-Amin, M. and Hanif, M. (2019). Exponential weighted moving average control charts for monitoring the process mean using pair Ranked Set Sampling schemes, Iranian Journal of Science and Technology, Transactions A: Science, 43(4), pp. 1941–1950.
Biographies

Wasif Yasin is a Ph.D. student at the National College of Business Administration & Economics (NCBA&E), Lahore, Pakistan. He did his M.Phil and M.Sc. degree from the University of the Punjab, Lahore. He is currently working as Secretary Regional Transport Authority, Sahiwal. His research interests include sampling techniques and Statistical Process Control.

Muhammad Tayyab received the master’s degree in Statistics from College of Statistical and Actuarial Sciences, University of the Punjab, Lahore, M. Phil Statistics from Allama Iqbal Open University, Islamabad and philosophy of doctorate degree in Statistics from National College of Business Administration & Economics (NCBA&E), Lahore, Pakistan. He is currently working as Senior Subject Specialist (Statistics) in department of Education. His research areas include mathematical statistics, sampling techniques and control charting structures. He has been serving as a reviewer for many highly-respected journals.

Muhammad Hanif completed his Master’s degree from New South Wales University, Australia in Multistage Cluster Sampling. He completed his Ph.D. in Statistics from the University of Punjab, Lahore, Pakistan. He has more than 40 years of research experience. He is an author of more than 200 research papers and 10 books. He has served as a Professor in various parts of the world i.e. Australia, Libya, Saudi Arabia, and Pakistan. He is presently a Professor of Statistics and Vice-Rector (Research) at NCBA & E, Lahore, Pakistan.
Journal of Reliability and Statistical Studies, Vol. 14, Issue 2 (2021), 651–668.
doi: 10.13052/jrss0974-8024.14213
© 2021 River Publishers