The Reliability and Validity Study of the Scale Measuring High School Students’ Attitude Towards Biology: Using Factor Analysis
Shahzad Ahmad1,*, Naveed Sultana2 and Sadia Jamil3
1Department of Mathematics, Federal College of Education, H-9, Islamabad, Pakistan
2Department of Secondary Teacher Education, AIOU, H-8, Islamabad, Pakistan
3Research Associate, Federal College of Education, H-9, Islamabad, Pakistan
E-mail: mianshahzadali17@gmail.com
*Corresponding Author
Received 07 July 2020; Accepted 19 March 2021; Publication 22 June 2021
Abstract
This study focused on the statistical technique using factor analysis to validate the scale measuring high school students’ attitudes towards Biology. The study sample consisted of 500 students (male 220, female 280) from public and private institutions offering high school education with Biology as an elective subject, in Islamabad. As part of this study, the scale developed by (Ahmad and Jamil, 2019) for the attitude of students towards biology was adopted. Research has shown that attitude and achievement are interrelated. Previously, research studies used exploratory factor analysis to analyze the validity of the scale construction. The present study used exploratory and confirmatory factor analysis to fill the gap in the literature because, after exploratory factor analysis, confirmatory factor analysis is required to test whether the models estimate the intended theoretical constructs. Following the procedure of factor analysis, six factors of the Biology Attitude Scale (BAS) were identified. The findings of the study show that the scale had a multidimensional construct. Further, the internal consistency reliability analysis was performed. Cronbach’s alpha coefficient was 0.86 which shows high internal consistency. It is recommended that BAS is a reliable and valid measurement tool that can be used to determine the attitude of secondary students towards Biology.
Keywords: Attitude, reliability, factor analysis, biology, validity, exploratory factor analysis, confirmatory factor analysis.
Introduction
At the secondary level of education in Islamabad (Pakistan), most of the students select biology as an elective subject rather than computer science. Despite the popularity of biology as a science subject, it is important to note that there is a question mark on students’ achievement in SSC examinations in biology. Numerous factors affect students’ learning in biology but the most debated factor in the existing literature is their attitude towards biology. Attitude may be positive, negative, or neutral as well. It can be defined as the concept that identifies someone’s feeling of liking or disliking anything under consideration. Attitude may be considered as a method, disposition, awareness, or situation concerning an individual or object, predominantly related to the mind (Khan and Ali, 2012). There is a lack of agreement among researchers on the meaning of attitude because attitude is a multi-faceted construct. According to Salta and Tzougraki (2004), an attitude is the predisposition to think, feel, or act positively or negatively towards objects in our surroundings.
Like attitude, the definition of attitude towards science coming to an issue among researchers. According to Osborne, Simon and Collins (2003), attitude consists of different sub-constructs which eventually give rise to a person’s attitude towards science. Different components of attitude towards science have been discussed by different researchers (Crawley and Black, 1992; Gardner, 1975; Koballa, 1988; Oliver and Simpson, 1988; Salta and Tzougraki, 2004).
There is a need to clarify the concepts of attitude towards science and scientific attitude. Bennett (2003) makes the distinction between attitude towards science and scientific attitude. He considered attitude towards science as the views and images that the individual develops about science due to his interaction with different situations, while the term scientific attitude is perceived to be the ways and means of thinking or scientific method, which involves skills and is related to the world of work. According to Yara (2009), attitude towards science denotes interest or feeling towards studying science. It is the students’ disposition towards liking or disliking science.
According to Adesoji (2002), attitude is comprised of cognitive, emotional, and action tendencies toward a specific behavioral intent. He further added that attitude is an essential factor that ascertained students’ achievement in science. Akinbobola, (2009), stated that attitude is the product of learning and modified through influence using various techniques. Attitude, once recognized, supports to outline experiences the individual has about an object or person. Though attitude changes gradually, people continuously form new attitudes and adjust to the previous one when they come across new information and new experience (Adesina and Akinbobola, 2005). It is more likely that students’ attitude towards science influences their academic achievement in science rather than achievement influencing attitude (O’ Connell, 2000).
Biology, being a natural science subject, comprising of contents about microscopic organisms related to the biosphere, all living things, and covering the earth’s surface (Okwo and Tartiyus, 2004). Throughout the world, biology due to its characteristics and importance is considered a standard subject taught at all levels of an education system. It is one of the main subjects particularly at the Secondary School Certificate (SSC), required to accomplish the necessities of living a successful life (Akindele, 2009).
Several research studies have been reported in the literature regarding the relation of attitude towards science with gender. A study conducted by Jebson and Hena, (2015), who found out that gender affects the attitude of students toward science subjects which is not following the findings of Iranian secondary school students (Soltani and Nasr, 2010) and Greek secondary school students (Mavrikaki et al., 2012). A growing body of research studies suggested that Biology as an elective science subject is more popular among females than males (Jones et al., 2000; Prokop et al., 2007b; Usak et al., 2009).
Reid (2006), in measuring attitude while teaching science, has mentioned four objectives like the subject of science, learning science, a topic or a theme within the lesson, and methods within the subject of science. Among these objectives, the most widely studied is the attitude towards the subject of science (Kaya, 2012; Kind et al., 2007; Krough and Thomson, 2005; Osborne et al., 2003; Pell and Jarvis, 2001; Reid and Skryabina, 2002; Senturk and Ozdemir, 2014). In these studies, attitude towards the subject of science lessons was viewed as a sub-dimension of attitude towards the subject of science. There are various researches in which only the attitudes of students towards science lessons were investigated. Here science lessons are meant for either general science or specific physics, chemistry, and biology lessons. The studies of Nuhoglu (2008), Shah and Mahmood (2011) can be given as examples of studies in which the attitudes towards science lessons were investigated; the analyses of Bennett (2001), Hancer, Uludag and Yılmaz (2007), Kan and Akbas (2005) can be given as examples of studies in which the attitudes towards chemistry lesson were investigated; the studies of Atik et al. (2015), Ekici and Hevedanlı (2010), Kocakoglu and Turkmen (2010), Pehlivan and Koseoglu (2010) and Prokop et al. (2007) can be given as examples of projects in which attitudes towards biology lesson were researched, and the works of Demirci (2004), Kaya and Boyuk (2011), Kurnaz and Yigit, (2010), Ozyurek and Eryılmaz (2001) and Tekbıyık and Akdeniz (2010) can be given as examples of ideas which investigate attitudes towards physics lesson. Numerous such studies demand the need for attitude scales.
From the Pakistani perspective, there are some research studies concerning students’ attitude towards science in general (Iqbal et al., 2008; Anwar et al., 2012) and subjects like chemistry and biology in specific (Khan and Ali, 2012; Ahmad and Jamil, 2019). The purpose of the present study was the reliability and validity study of the scale measuring high school students’ attitude towards Biology at the secondary level.
Research Questions
This study was conducted to investigate the following research questions:
i. Does the biology attitude scale have appropriate validity?
ii. Does the biology attitude scale have suitable reliability?
iii. Is there any significant difference between the attitude of male and female students toward biology at the secondary level?
iv. Is there any significant difference between the attitude of public and private students toward biology at the secondary level?
Method
Sample
The population of the study was comprised of all students opting for biology as an elective subject at the secondary level in Islamabad. A total of 500 students were selected from eight (08) different institutions in Islamabad. The number of public and private students in the sample is given in Table 1.
Table 1 Sample in detail
| Type of School | Male | Female | Total |
| Public | 103 | 194 | 297 |
| Private | 117 | 86 | 203 |
| Total | 220 | 280 | 500 |
It is suggested that the size of samples should be larger for conducting factor analysis to ensured more precise and stable estimates of factor loadings in the population, however, there is little agreement as to how large a sample must be to yield such estimates (Hogarty et al., 2005). Comrey and Lee (1973) described the size of a sample as follows: 100 poor, 200 appropriate, 300 good, 400 very good, 1000, and more=perfect. The researcher selected 500 students for the present study which is a good sample size for factor analysis.
Instrument
The research instrument used in this study was the Biology Attitude Scale (BAS) was initially developed and validated by Ahmad and Jamil (2019). To develop the scale, a draft of 40 items on seven different constructs was developed. The draft scale was tested on 200 9th grade biology students (girls 97, boys 103). The construct validity of BAS was determined by performing exploratory factor analysis with a varimax rotated method. Then, the final scale was reduced to 25 items with six factors explaining 52.2% of the total variance. Further, the Cronbach alpha reliability coefficient of the biology attitude scale was found as 0.81. Finally, a reliable and valid instrument was obtained for measuring a student’s attitude toward biology.
In the present study, BAS consists of 25 items on 5-point Likert-type scales with six different constructs about the attitudinal object. Students’ response was recorded on the scale ranging from 1 Strongly disagree to 5 Strongly agree. The scale has a possible minimum score of 25 and a maximum score of 125. Biology Attitude Scale (BAS) comprised of both positive and negative statements. The researcher followed separate criteria for marking both positive and negative statements. In case of positive statements i.e. Strongly Disagree 1, Disagree 2, Neutral 3, Agree 4, Strongly Agree 5 and reversed in case of negative statements i.e. Strongly Disagree 5, Disagree 4, Neutral 3, Agree 2, Strongly Agree 1.
Factor Analysis
To determine the factor structure of the scale, the data collected during the implementation of the scale were analyzed using SPSS version 23.0. The analysis of data collected following the application of the BAS was carried out using two main factor analysis techniques like Exploratory Factor Analysis (EFA) and Confirmatory Factor Analysis (CFA). The objective of EFA is to determine the implicit structure of the scale, and the purpose of using CFA is to verify the implicit structure determined (Secer, 2015). The purpose of using EFA is to ascertain the factor structure of the scale and to view the construct validity. In CFA, the construct validity is considered with the verification of determined scale factor structure (Buyukozturk et al., 2009). EFA is used for the reliability of the scale, while the CFA is used for the reliability of the model (Şencan, 2005). The analysis was completed by calculating the reliability of the scale after the analysis of the factors finished.
The Kaiser-Meyer-Olkin (KMO) test and Bartlett’s Test of Sphericity measure of sampling adequacy were used to examine the suitability of factor analysis. The KMO test attempts to measure sampling adequacy, which varies between 0 and 1. When this value is high, it means that each variable of the scale can be estimated perfectly by the other variables of the scale. If the test result is greater than 0.5, the factor analysis can be continued (Sencan, 2005, p. 384). Kaiser (1974) stated that if this value is less than 0.5 it is not acceptable, if it is within 0.5 it is miserable, in the 0.6, it is poor, in the 0.7, it is average, in the 0.8, it is meritorious, and in the 0.9, it is wonderful. Bartlett’s Test of Sphericity gives the value of the chi-square statistics. According to Sencan (2005), the acceptable value necessary to carry out factor analysis is that it must be less than 0.05.
There are different kinds of criteria used to determine the suitable number of factors for the scale under consideration. These include the eigenvalues, the total variance explained, and the scree plots (Buyukozturk, 2002). The most widely used criterion is of eigenvalues and determining factors that have an eigenvalue greater than 1 (Ozdamar, 2016). In the present study, the researcher follows the criterion of the scree plot graphic in which the vertical axis shows the eigenvalues and the horizontal axis shows the corresponding factors. The factor in which there are rapid declines shows the appropriate numbers of important factors (Cokluk et al., 2014).
In factor analysis, the items which should be part of the final scale depend upon their factor loadings of each item. According to Buyukozturk (2016), the factor load value should be 0.45 or higher but in normal practice, the limit values can be as low as 0.30. In the present study, the factor loading was considered to be more than 0.40. There are different types of methods of rotation while conducting factor analysis, but the most widely used method is varimax. The reason for using varimax rotation was to bring out the factor load variances uppermost by arranging the high ones higher for each factor and the low ones lower (Tabachnick and Fidell, 2013). In this study, the researcher used the varimax rotation method.
It is suggested that the alpha coefficient, which was developed by Cronbach and is a criterion for internal consistency, should be used to determine the level of reliability of a Likert-type attitude scale. The higher value of the alpha coefficient confirms how consistent the items selected for the final scale are as well as it shows that they consist of the items necessary to measure the factors of the same characteristics (Tavsancil, 2014). Finally, multivariate analysis of variance was used to determine the significant difference between the attitude of the students towards biology at the secondary level both in the case of gender and locality.
Results
Factor Structure of Biology Attitude Scale (BAS)
It is suggested to test the appropriateness of the data for conducting factor analysis by using Kaiser-Mayer-Olkin (KMO) and Barlett Sphericity Test (Ugulu, 2011). In the case of principal component factor analysis, the acceptable value of the KMO test is 0.681. Table 2, shows the values of KMO and Barlett’s tests necessary for conducting factor analysis.
Table 2 The results of Kaiser-Meyer-Olkin and Barlett’s tests
| Kaiser-Mayer-Olkin (KMO) For Sample Adequacy | 0.880 | |
| Bartlett’s Test of Sphericity | Chi-Square (Approx.) | 3359.721 |
| df | 300 | |
| Sig. | 0.000 | |
| p 0.001. | ||
As can be seen from Table 2, KMO 0.88 0.70 indicated that the sample data are appropriate for conducting factor analysis (Buyukozturk, 2004; Hair et al., 2006). The Bartlett’s test showed that the correlation coefficients are not all zero (Table 2). In this study, the observed significance level was p 0.001. The Bartlett’s Test results of this study indicated that the chi-square was significant (; p 0.001). Thus, both assumptions necessary for factor analysis are satisfied.
The scree plot graph of the BAS in which the eigenvalues are compared to the numbers of the factors. In this study, the investigator followed the criterion of eigenvalues 1 to determine the number of factors. Figure 1 clearly shows that the decline in the high curve was detected after the sixth factor. According to Field (2005), one could say that the attitude scale in biology has the sixth different factor.
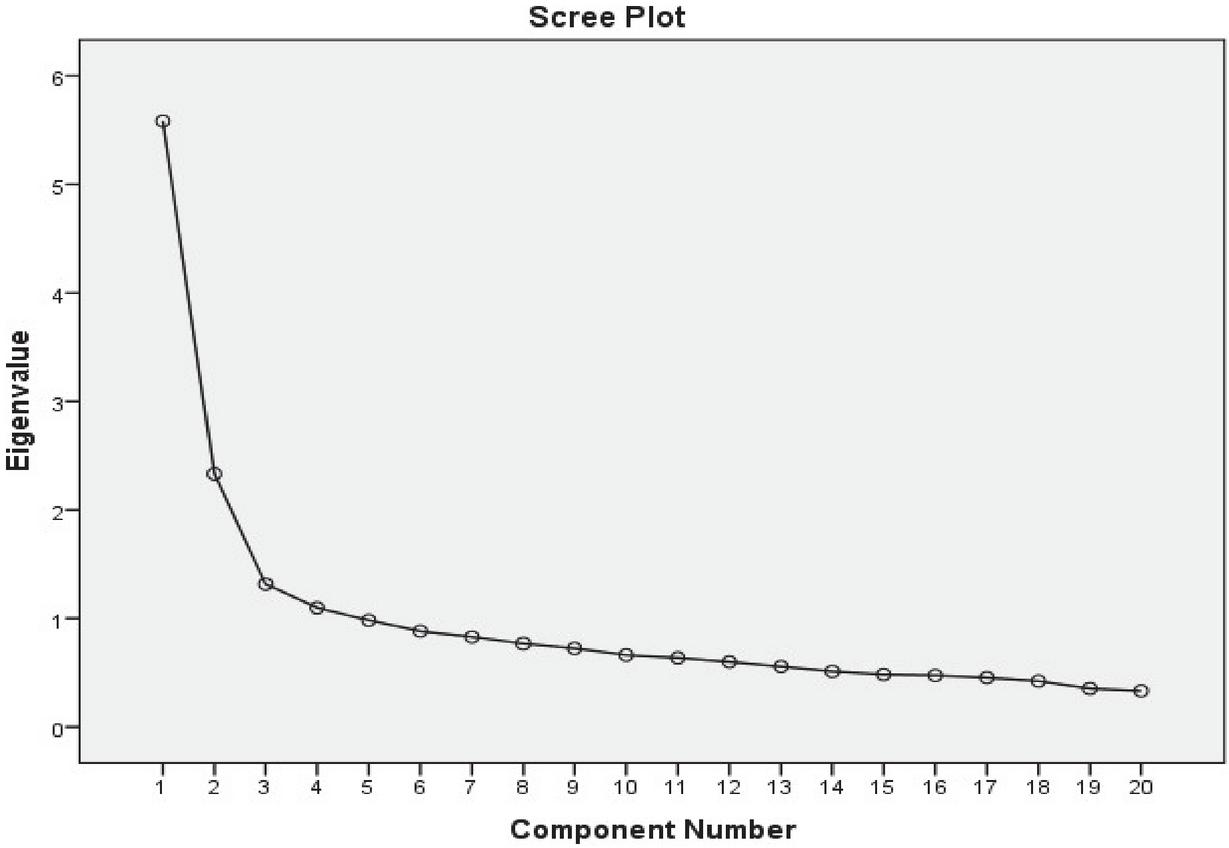
Figure 1 The Scree Plot Graph of Biology Attitude Scale (BAS).
Exploratory Factor Analysis
An exploratory factor analysis (EFA) was performed to observe the structure underlying the initial form of BAS with 25 items. A principal component analysis with Varimax Rotation was used to confirm the construct validity of BAS. EFA on the BAS extracted 6 different factors with eigenvalues exceeding 1.0. The results of the factor analysis, factor loadings and the variance explained were given in Table 3. These six factors explained 53.47% of the total variance of results. In general, three of six factors were represented by four items per each factor with loading more than 0.43. All items were carried because their factor loadings were more than 0.4 (Yavuz, 2005).
Table 3 Factor Analysis of Biology attitude Scale (BAS)
| S. No. | Items | F | F | F | F | F | F |
| Factor I (Attitude toward biology teacher) | |||||||
| 1 | Item04 | 0.794 | |||||
| 2 | Item02 | 0.773 | |||||
| 3 | Item11 | 0.753 | |||||
| 4 | Item23 | 0.641 | |||||
| 5 | Item15 | 0.705 | |||||
| 6 | Item06 | 0.435 | |||||
| Factor II (Attitude toward a career in biology) | |||||||
| 7 | Item19 | 0.815 | |||||
| 8 | Item03 | 0.799 | |||||
| 9 | Item01 | 0.662 | |||||
| 10 | Item09 | 0.628 | |||||
| 11 | Item21 | 0.568 | |||||
| Factor III (Attitude toward the importance of biology) | |||||||
| 12 | Item08 | 0.614 | |||||
| 13 | Item13 | 0.557 | |||||
| 14 | Item17 | 0.430 | |||||
| 15 | Item25 | 0.540 | |||||
| Factor IV (Attitude toward difficulties in biology) | |||||||
| 16 | Item02 | 0.543 | |||||
| 17 | Item24 | 0.668 | |||||
| 18 | Item05 | 0.489 | |||||
| 19 | Item20 | 0.509 | |||||
| Factor V (Attitude toward the methodology of biology) | |||||||
| 20 | Item22 | 0.733 | |||||
| 21 | Item10 | 0.582 | |||||
| 22 | Item16 | 0.420 | |||||
| 23 | Item18 | 0.412 | |||||
| Factor VI (Attitude toward the interest of biology) | |||||||
| 24 | Item 12 | 0.769 | |||||
| 25 | Item 07 | 0.444 | |||||
| Variance Explained (%) | 14.50 | 13.07 | 7.61 | 7.38 | 6.08 | 4.83 | |
| Total Variance Explained (%) | 53.47 | ||||||
As can be seen in Table 4, the first factor including six items that focus on “Teacher” explained 14.50% of the total variance and has factor loadings ranging from 0.412 to 0.794. The second factor including five items that focus on “Career” explained 13.07% of the total variance and has factor loadings ranging from 0.489 to 0.815. The third factor including four items that focus on “Importance” explained 7.61% of the total variance and has factor loadings ranging from 0.430 to 0.614. The fourth factor including four items that focus on “Difficulties” explained 7.38% of the total variance and has factor loadings ranging from 0.509 to 0.668. The fifth factor including four items that focus on “Methodology” explained 6.08% of the total variance and has factor loadings ranging from 0.420 to 0.733. The sixth factor including two items that focus on “Interest” explained 4.83% of the total variance and has factor loadings ranging from 0.444 to 0.769.
Table 4 The results of factor loading and variance of each factor
| Factor Loading | |||
| Factors | % of the Total Variance | From | To |
| F | 14.50 | 0.412 | 0.794 |
| F | 13.07 | 0.489 | 0.815 |
| F | 7.61 | 0.430 | 0.614 |
| F | 7.38 | 0.509 | 0.668 |
| F | 6.08 | 0.420 | 0.733 |
| F | 4.83 | 0.444 | 0.769 |
Confirmatory Factor Analysis (CFA)
The researcher performed Confirmatory Factor Analysis (CFA) using the statistical package analysis of moment structures (AMOS.21) to confirm the factor structure that emerged as a result of Exploratory Factor Analysis (EFA). To test the adequacy of CFA models, various fit indices were used. The multiple goodness-of-fit tests necessary for CFA were: Normed Fit Index (NFI); Comparative Fit Index (CFI); Tucker and Lewis’s Index of Fit (TLI); and Root Mean Square Error Approximation (RMSEA). NFI is a normed fit index that has defined a tendency to study fit index in a large sample. It ranges between 0 and 1. It works for analyzing the change in fit between the hypothesized model and the independent model (Byrne, 2010). The independence model compared with the hypothesized model assumes that the variables in the model are distinct. Similarly, CFI indicates the total co-variation in the model and ranges between 0 and 1. The model is considered a good fit for the data if the values of both NFI and CFI are equal or greater than 0.90. RMSEA is based on the analysis of residuals (Kelloway, 1998). The most probable value of the RMSEA index for a good model-data fir should be below 0.08 (Kline, 2011).
Initially, CFA was performed to determine the fit between the hypothesized model with 20 items obtained from EFA using SPSS version 23.0. The fitness of the model was checked by using four indexes like NFI, CFI, and RMSEA. RMSEA index indicated adequate fit value (RMSEA 0.063), but other indexes like CFI, NFI, and TLI did not results in an acceptable range (NFI 0.79, CFI 0.85, and TLI 0.83), resulting in a questionable fit of the model to the data. To determine the best fitting model for the given data, some modifications in specifications were made (See Table 5).
Table 5 Goodness-of-fit statistics for the five-factor CFA model
| Model Tested | df | CFI | NFI | TLI | RMSEA | |
| Model Performance | 661.672 | 220 | 0.85 | 0.798 | 0.832 | 0.063 |
| Criterion for Goodness-of-fit | – | – | 0.90 | 0.90 | 0.90 | 0.10 |
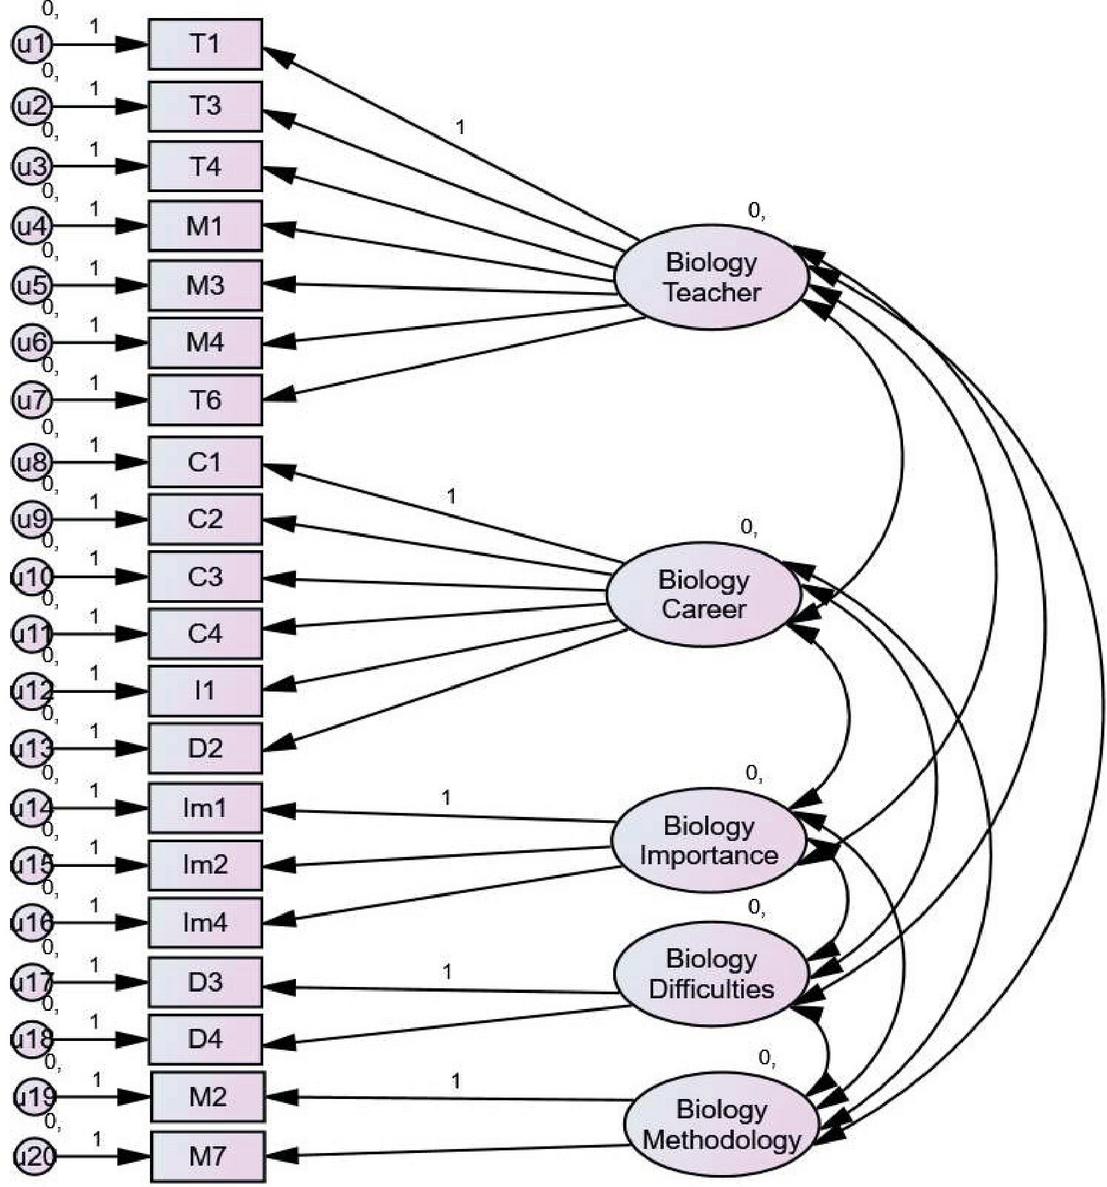
Figure 2 Standardized coefficients for the five-factors model for BAS based on CFA using AMOS 21.0. All the coefficients are significant at p 0.001. NFI 0.79, CFI 0.85, and TLI 0.83, RMSEA 0.063. F: Biology Teacher, F: Biology Career, F: Biology Importance, F: Biology Difficulties and, F: Biology Methodology.
After excluding two items of BAS, CFA with 18 items was re-performed to identify the model that indicates the best fit. The second CFA resulted in five factors that confirmed the structure, which indicates a good fit for the data. This second CFA revealed that five factors occurred and confirmed the structure, which indicates the good fit for the data with the fit indexes like, NFI 0.90, CFI 0.93, and TLI 0.91, and RMSEA 0.05. All the path coefficients were found significant at p 0.01 demonstrating a significant influence of each item to the connecting factor. It is illustrated in, Figure 3, that all five dimensions of BAS were allowed to correlate to each other.
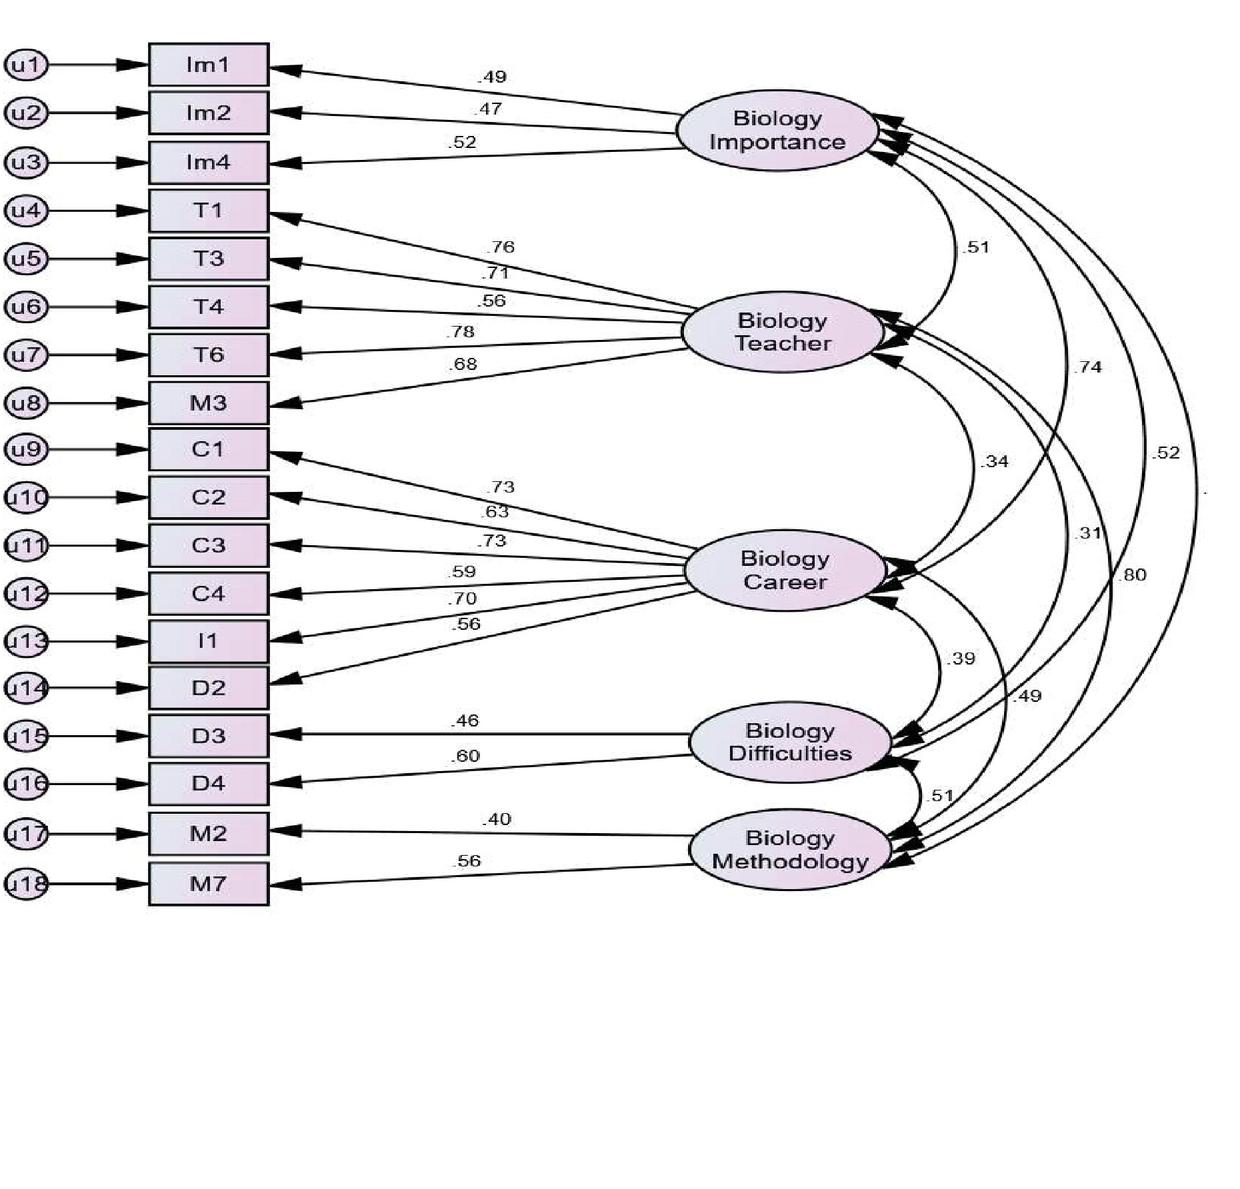
Figure 3 Standardized coefficients for the five-factors model for BAS based on CFA using AMOS 21.0. All the coefficients are significant at p 0.001. NFI 0.90, CFI 0.93, and TLI 0.91, RMSEA 0.05. F: Biology Teacher, F: Biology Career, F: Biology Importance, F: Biology Difficulties and, F: Biology Methodology.
Reliability Coefficient of BAS
In this study, to determine whether the items of BAS were consistent with each other or not, Cronbach’s alpha internal consistency coefficient was calculated for each dimension and the whole scale using SPSS 23.0 version (See Table 7). Further, the item-total correlation score of all items in each reliability analysis produced acceptable outcomes, which are more than 0.30 (Field, 2005; Erdogan et al., 2012).
Table 6 Goodness-of-fit statistics for the five-factor CFA model
| Model Tested | df | CFI | NFI | TLI | RMSEA | |
| Model Performance | 295.638 | 125 | 0.93 | 0.90 | 0.91 | 0.05 |
| Criterion for Goodness-of-fit | – | – | 0.90 | 0.90 | 0.90 | 0.10 |
Table 7 Reliability of sub-scales and scale after factor analysis
| Factors | Cronbach’s Alpha |
| F | 0.83 |
| F | 0.82 |
| F | 0.54 |
| F | 0.44 |
| F | 0.43 |
| Total Scale | 0.86 |
The Difference Between Groups in Attitudes Towards Biology
Summary of the descriptive analysis in Table 8 shows that females had higher mean scores than male students on five dimensions of a BAS.
Table 8 Summary of descriptive statistics of male and female students, simultaneously on five dimensions of biology attitude scale
| Gender | ||||
| Male | Female | |||
| Factors | Mean | S.D | Mean | S.D |
| Teacher | 26.09 | 5.86 | 27.04 | 5.27 |
| Career | 20.0 | 5.02 | 22.73 | 5.18 |
| Importance | 15.18 | 2.70 | 16.61 | 2.54 |
| Difficulties | 9.39 | 2.46 | 10.27 | 2.29 |
| Methodology | 11.03 | 2.29 | 11.21 | 1.96 |
Table 9 Multivariate analysis of variance for the difference between male and female students’ attitude toward biology
| Multivariate Results | |||
| Hypothesis df | F | Sig. | |
| Wilks’ Lambda | 5.0 | 11.62 | 0.000 |
Summary of the results in the above Table 9 containing F 11.62 and indicates that there is a significant difference between male and female students regarding attitude toward biology.
Table 10 Multivariate analysis of variance for the difference between male and female students five dimension of biology attitude scale
| Factors | Type II Sum of Square | df | Mean Square | F | Sig. |
| Teacher | 110.58 | 1 | 110.58 | 3.59 | 0.059 |
| Career | 918.32 | 1 | 918.32 | 35.09 | 0.000 |
| Importance | 252.80 | 1 | 252.80 | 36.88 | 0.000 |
| Difficulties | 94.53 | 1 | 94.53 | 16.83 | 0.000 |
| Methodology | 3.90 | 1 | 3.90 | 0.870 | 0.351 |
Table 10 shows the results of the multivariate analysis of variance (MANOVA) test of the difference between two groups of male and female students at each factor. There is a significant difference between two groups of male and female students in terms of factors like career, importance, and difficulties but there is no significant difference in the case of factors like teacher and methodology.
Table 11 Summary of descriptive statistics of public and private students, simultaneously on five dimensions of biology attitude scale
| Type of School | ||||
| Public | Private | |||
| Factors | Mean | S.D | Mean | S.D |
| Teacher | 28.20 | 5.05 | 24.19 | 5.43 |
| Career | 22.45 | 5.17 | 20.12 | 5.15 |
| Importance | 16.62 | 2.38 | 14.99 | 2.88 |
| Difficulties | 9.94 | 2.51 | 9.80 | 2.23 |
| Methodology | 11.57 | 1.99 | 10.46 | 2.12 |
Summary of the descriptive analysis in Table 11 shows that students in public schools had higher mean scores than students in private schools on five dimensions of the BAS.
Table 12 Multivariate analysis of variance for the difference between public and private students’ attitude toward biology
| Multivariate Results | |||
| Hypothesis df | F | Sig. | |
| Wilks’ Lambda | 5.0 | 19.72 | 0.000 |
Summary of the results in the above Table 12 containing F 19.72 and indicates that there is a significant difference between public and private students regarding attitude toward biology.
Table 13 Multivariate analysis of variance for the difference between public and private students five dimension of biology attitude scale
| Factors | Type II Sum of Square | df | Mean Square | F | Sig. |
| Teacher | 1916.46 | 1 | 1916.46 | 70.62 | 0.000 |
| Career | 647.30 | 1 | 647.30 | 24.23 | 0.000 |
| Importance | 318.01 | 1 | 318.01 | 47.30 | 0.000 |
| Difficulties | 2.292 | 1 | 2.292 | 0.395 | 0.530 |
| Methodology | 145.49 | 1 | 145.49 | 34.64 | 0.000 |
Table 13 shows the results of the multivariate analysis of variance (MANOVA) test of the difference between two groups of public and private students at each factor. There is a significant difference between two groups of public and private students in terms of factors like teacher, career, importance, and methodology but there is no significant difference in case of difficulties.
Discussion and Conclusion
The findings of this study showed that the BAS has good validity and reliability (coefficient alpha 0.86) among secondary school students in Islamabad. This corroborated with the result of Simpson and Oliver (1990), Atawater, Wiggins and Gardner (1995), Greenfield (1997), Spellman and Oliver (2001), and Liaghatdar, Soltani and Abedi (2011) which respectively have reliability coefficient alpha to be 0.88, 0.88, 0.92, 0.87 and 0.84 for scale measuring student’s attitude toward science.
The construct validity of BAS was examined using factor analysis with varimax rotation. The findings of the factor analysis revealed the six factors of the instrument like “Student’s attitude toward Biology Teacher”, “Student’s attitude toward a Career in Biology”, “Student’s attitude toward Importance of Biology”, “Student’s attitude toward Difficulties in Biology”, “Student’s attitude toward Methodology of Biology, and “Student’s attitude toward Interest in Biology”. In the literature, factor loading 0.30 is suggested for item loadings (Lang, Wong and Fraser 2005; Martin-Dunlop and Fraser 2007). However, in the present study, items that do not have a factor loading of 0.40 were excluded from the final scale. This result is consistent with the study conducted by Ugulu (2013), which suggested a more conservative cut off score (0.40) for retaining any items for the Traditional Knowledge Attitude Scale (TKAS). Six factors are explaining a total of 53.7% of the variance of the scale which is considered as sufficient variance explanation in social sciences. It is more than 35.8% explained variability in the case of the Persian form of attitude toward the science scale (Liaghatdar et al., 2011) and less than 62.89% explained variability in the case of TKAS (Ugulu, 2013). Overall, these findings support the factorial validity of the BAS.
The Confirmatory Factor Analysis (CFA) showed that all path coefficients were high and significant at p 0.01 demonstrating a meaningful influence of each item to the corresponding scale. Researcher conducted two confirmatory factor analyses; the five-factor model was found to indicate a good fit with satisfactory fit indices (NFI 0.90, CFI 0.93, and TLI 0.91 and RMSEA 0.05). CFA indicates evidence for the construct validity of BAS. Finally, the BAS was found to consist of five factors underlying 18 items measured on a 5-point Likert type scale. The first factor consisted of five items that focus on student’s attitudes toward Biology teachers. The second factor included six items that focus on a student’s career in biology. The third factor consisted of two items that focus on student’s difficulties in biology. The fourth factor included two items that focus on the methodology of biology and the last fifth factor included three items that focus on student’s importance of biology.
Cronbach’s alpha reliability coefficient for the five sub-scales was also determined. The results of the reliability for the corresponding scales ranged from 0.43 to 0.83. It is said that scales with a reliability coefficient more than the value of 0.60 are considered acceptable for research purposes (Nunnally, 1967). The reliability coefficient of BAS was found to be 0.83.
It is clear from the results of this study that gender plays its role in the attitude of students towards biology at the secondary level in Islamabad. Because the female students show a more positive attitude towards biology than the male students, which is not corroborated by the results concerning the Iranian secondary students (Soltani and Nasr, 2010) and the Greek secondary students (Mavrikaki et al., 2012). This conclusion from the present study is corroborated by the study by Jebson and Hena (2015), who found that gender has an effect on students’ attitudes towards science subjects but contradicts the sense that boys have a more positive attitude towards science subjects than girls. Although this finding is congruent with the result of Osborne and Collins (2000) and is not congruent with the results of Greenfield (1997) and Osborne et al. (2003). Similarly, the findings obtained using multivariate analysis of variance (MANOVA) showed that there is a significant difference between two groups of male and female students in terms of factors like career, importance, and difficulties but there is no significant difference in the case of factors like teacher and methodology.
The findings of this study show that there was a significant variation between the attitude of public and private students towards Biology, students in public schools have a more positive attitude than students in private schools. This result does not support by Hussaini et al. (2012) who found out that private school students have a more positive attitude towards Biology as compared to public school students. Similarly, the findings obtained using multivariate analysis of variance (MANOVA) showed that there is a significant difference between two groups of public and private students in terms of factors like teacher, career, importance, and methodology but there is no significant difference in the case of difficulties.
Previously, research studies used exploratory factor analysis to analyze the validity of the construction of the scale (Ahmad and Jamil, 2019; Yavas and Çagan, 2017). The present study used exploratory and confirmatory factor analysis to fill the gap in the literature because, after the exploratory factor analysis, confirmatory factor analysis is necessary to test whether the models estimate the theoretical constructs expected. Following the factor analysis procedure, six factors of the biological attitude scale (BAS) were identified. The results of the study show that the scale had a unidimensional construct. Also, an internal consistency reliability analysis was performed. Cronbach’s alpha was 0.86, which shows high internal consistency. Female students exhibited a positive attitude as compared to male students. Likewise, students in public schools showed a positive attitude toward students in private schools. It is recommended that BAS be a reliable and valid measurement tool that can be used to determine the attitude of high school students towards biology.
Recommendations
Based on the results of this study, it is recommended that biology teachers use teaching methodologies that guarantee a positive attitude of students towards biology at the secondary level. The nature of the content in biology is such that it contains concepts, sub-concepts, and links between the concepts. Therefore, it is the responsibility of curriculum designers to select and manage different concepts based on an individual’s needs and aspirations. It is encouraged that the study is replicated in other disciplines such as physics, chemistry, mathematics, etc. as well as at the college level.
References
Adesina, A. O., and Akinbobola, A. O. (2005). The attitude of students towards a part-time degree program of the faculty of education, Obafemi Awolowo University, Ile-Ife. Journal of Research of Education, 2(1), 1–4.
Adesoji, F. A. (2002). Modern strategies in the teaching of integrated science. Teaching strategies for Nigeria secondary school. Ibadan: Power House Press Publishers, 205–212.
Ahmad, S., and Jamil, S. (2019). Development and Validation of Biology Attitude Scale for Secondary School Students in Islamabad, Pakistan. Journal of Contemporary Teacher Education, 3(1), 13–29.
Akinbobola, A. O. (2009). Enhancing Students’ Attitude towards Nigerian Senior Secondary School Physics through the Use of Cooperative, Competitive, and Individualistic Learning Strategies. Australian Journal of Teacher Education, 34(1), 1–9.
Akindele, I. (2009). Increasing teacher capacity on the use of dissection and experimentation techniques for the effective conduct of biology practicals for senior school certificate Examination. STAN, Biology panel series, 79–87.
Anwer, M., Iqbal, H. M., and Harrison, C. (2012). Students’ attitude towards science: A case of Pakistan. Pakistan Journal of Social and Clinical Psychology, 9(2), 3–9.
Atik, A. D., Kayabaşi, Y., Yagci, E., and Erkoc, F. U. (2015). The secondary school student’s biology science and course attitude scale: analysis of reliability and validity. Mehmet Akif Ersoy University Journal of Education Faculty, 36, 1–18.
Atwater, M. M., Wiggins, J., and Gardner, C. M. (1995). A study of urban middle school students with high and low attitudes toward science. Journal of Research in Science Teaching, 32(6), 665–677.
Bennett, J. (2001). The development and use of an instrument to assess students’ attitude to the study of chemistry. International Journal of Science Education, 23(8), 833–845.
Bennett, J. (2003). Teaching and learning science. New York: Continuum.
Buyukozturk, S. (2002). Factor analysis: Basic concepts and use in scale development. Journal of Education Management in Theory and Practice, 8 (4), 470–483.
Buyukozturk, S. (2004). Handbook of data analysis for social sciences. Ankara: Pegema Publishing.
Buyukozturk, S., Kılıc Cakmak, E., Akgün, O. E., Karadeniz, S., and Demirel, F. (2009). Scientific Research Methods. Ankara: Pegem Akademi.
Buyukozturk, S. (2016). Manual of data analysis for social sciences. Ankara: Pegem Academy.
Byrne, B. M. (2010). Structural equation modeling with AMOS: basic concepts, applications, and programming (multivariate applications series). New York: Taylor & Francis Group, 396, 7384.
Cokluk, O., Şekercioglu, G., and Buyukozturk, S. (2014). Multivariate Statistics for Social Sciences SPSS and Lisle Practices. Ankara: Pegem Akademi.
Comrey, A. L., and Lee, H. B. (2013). The first course in factor analysis. Psychology Press.
Crawley, F. E., and Black, C. B. (1992). Causal modeling of secondary science students’ intentions to enroll in physics. Journal of research in Science Teaching, 29(6), 585–599.
Demirci, N. (2004). Students’ attitudes toward the introductory physics course. Hacettepe University Journal of Education, 26, 33–40.
Ekici, G., and Hevedanli, M. (2010). Examination of the attitudes of high school students towards biology course in terms of different variables. Journal of Turkish Science Education, 7(4), 97–109.
Erdogan, M., Ok, A., and Marcinkowski, T. J. (2012). Development and validation of children’s responsible environmental behavior scale. Environmental Education Research, 18(4), 507–540.
Field A (2005). Discovering statistics using SPSS. London: Sage.
Gardner, P. L. (1975). Attitude to science: A review. Studies in Science Education, 2, 1–41.
Greenfield, T. A. (1997). Gender-and grade-level differences in science interest and participation. Science Education, 81(3), 259–276.
Hair, J., Anderson, R.E., Tatham, R.L.& Black, W.C. (2006). Multivariate data analysis. (6th ed.), Prentice-Hall, Upper Saddle River: New Jersey.
Hancer, A. H., Uludag, N., and Yilmaz, A. (2007). The evaluation of the attitudes of science teacher candidates towards chemistry lesson. Hacettepe University Journal of Education, 32, 100–109.
Hogarty, K. Y., Hines, C. V., Kromrey, J. D., Ferron, J. M., and Mumford, K. R. (2005). The quality of factor solutions in exploratory factor analysis: The influence of sample size, communality, and overdetermination. Educational and Psychological Measurement, 65(2), 202–226.
Hussaini, I., Foong, L. M., and Kamar, Y. (2015). Attitudes of secondary school students towards biology as a school subject in Birnin kebbi Metropolis, Nigeria. International Journal of Research & Review, 2(10), 596–600.
Iqbal, H. M., Nageen, T., and Pell, A. W. (2008). Attitudes to school science held by primary children in Pakistan. Evaluation & Research in Education, 21(4), 269–302.
Jebson, S. R., and Hena, A. Z. (2015). Students’ attitude towards science subjects in senior secondary schools in Adamawa State, Nigeria. IMPACT: International Journal of Research in Applied, Natural and Social Sciences, 3(3), 117–124.
Jones, M. G., Howe, A., and Rua, M. J. (2000). Gender differences in students’ experiences, interests, and attitudes toward science and scientists. Science Education, 84(2), 180–192.
Kaiser, H. F. (1974). An index of factorial simplicity. Psychometrika, 39(1), 31–36.
Kan, A., and Akbaş, A. (2005). A study of developing an attitude scale towards chemistry. Mersin University Journal of the Faculty of Education, 1(2), 227–237.
Kaya, H. (2012). An Investigation into Upper Elementary Students’ Attitudes towards Science. European Journal of Physics Education, 3(2), 22–33.
Kaya, H., and Boyuk, U. (2011). Attitude towards Physics Lessons and Physical Experiments of the High School Students. European Journal of Physics Education, 2(1), 23–31.
Kelloway, E. K. (1998). Using LISREL for structural equation modeling: A researcher’s guide. Sage.
Khan, G. N., and Ali, A. (2012). Higher secondary school students’ attitude toward chemistry. Asian Social Science, 8(6), 165.
Kind, P., Jones, K., and Barmby, P. (2007). Developing attitudes toward science measures. International Journal of Science Education, 29(7), 871–893.
Kline RB (2011). Principles and practices of structural equating modeling. New York, NY: The Guilford Press.
Koballa Jr, T. R. (1988). Attitude and related concepts in science education. Science Education, 72(2), 115–126.
Koçakoglu, M., and Turkmen, L. (2010). Developing a biology attitude scale. Journal of Kırşehir Education Faculty, 11(2), 229–245.
Krogh, L. B., and Thomsen, P. V. (2005). Studying students’ attitudes towards science from a cultural perspective but with a quantitative methodology: Border crossing into the physics classroom. International Journal of Science Education, 27(3), 281–302.
Kurnaz, M. A., and Yigit, N. (2010). Physics attitude scale: development, validity, and reliability. Necatibey Faculty of Education Electronic Journal of Science and Mathematics Education, 4(2), 32–49.
Lang, Q. C., Wong, A. F., and Fraser, B. J. (2005). Teacher-student interaction and gifted students’ attitudes toward chemistry in laboratory classrooms in Singapore. Journal of Classroom Interaction, 40(1), 18–28.
Liaghatdar, M. J., Soltani, A., and Abedi, A. (2011). A Validity Study of Attitudes toward Science Scale among Iranian Secondary School Students. International Education Studies, 4(4), 36–46.
Martin-Dunlop, C., and Fraser, B. J. (2008). Learning environment and attitudes associated with an innovative science course designed for prospective elementary teachers. International Journal of Science and Mathematics Education, 6(1), 163–190.
Mavrikaki, E., Koumparou, H., Kyriakoudi, M., Papacharalampous, I., and Trimandili, M. (2012). Greek Secondary School Students’ Views about Biology. International Journal of Environmental and Science Education, 7(2), 217–232.
Nuhoglu, H. (2008). Development of an attitude scale for primary science and technology lessons. Elementary Education Online, 7(3), 627–639.
Nunnally J (1967). Psychometric theory. New York: McGraw Hill.
O’Connell, S. (2000). Introduction to Problem-Solving Strategies for the Elementary Mathematics Classroom. N.H. Heinemann.
Okwo, F. A. Tartiyus (2004). Effect of position of the diagram and Cognitive Style on Biology Achievement of Pre-National Diploma students. Journal of the Science Teachers Association of Nigeria, 39(1), 2.
Oliver, J. S., and Simpson, R. D. (1988). Influences of attitude toward science, achievement motivation, and science self-concept on achievement in science: A longitudinal study. Science Education, 72(2), 143–155.
Osborne, J., and Collins, S. (2000). Pupils’& parents’ views of the school science curriculum. London: Kings College.
Osborne, J., Simon, S., and Collins, S. (2003). Attitudes towards science: A review of the literature and its implications. International journal of science Education, 25(9), 1049–1079.
Ozdamar, K. (2016). Scale and Test Development Structural Equation Modeling. Ankara: Nisan Publishing.
Ozyurek, A., and Eryılmaz, A. (2001). Factors Affecting Students Attitudes Towards Physics. Education and Science, 26(120), 21–28.
Pehlivan, H., and Koseoglu, P. (2010). The reliability and validity study of the attitude scale for a biology course. Procedia-Social and Behavioral Sciences, 2(2), 2185–2188.
Pell, T., and Jarvis, T. (2001). Developing attitude to science scales for use with children of ages from five to eleven years. International Journal of Science Education, 23(8), 847–862.
Prokop, P., Tuncer, G., and Chuda, J. (2007). Slovakian students’ attitudes towards biology. Eurasia Journal of Mathematics, Science & Technology Education, 3(4), 287–295.
Reid, N. (2006). Thoughts on attitude measurement. Research in Science & Technological Education, 24(1), 3–27.
Reid, N., and Skryabina, E. A. (2002). Attitudes towards physics. Research in Science & Technological Education, 20(1), 67–81.
Salta, K., and Tzougraki, C. (2004). Attitudes toward chemistry among 11th-grade students in high schools in Greece. Science Education, 88(4), 535–547.
Secer, I. (2015). Psychological Test Development and Adaptation Process. Ankara: Anı Publishing.
Şencan, H. (2005). Reliability and validity in social and behavioral measurements. Ankara: Seçkin Publishing.
Şenturk, E., and Ozdemir, O. F. (2014). The effect of science centers on students’ attitudes towards science. International Journal of Science Education, Part B, 4(1), 1–24.
Shah, Z. A., and Mahmood, N. (2011). Developing a scale to measure attitude towards science learning among school students. Bulletin of Education and Research, 33(1), 71–81.
Simpson, R. D., and Steve Oliver, J. (1990). A summary of major influences on attitude toward and achievement in science among adolescent students. Science Education, 74(1), 1–18.
Soltani, A., and Nasr, A. (2010). Attitude towards Biology and its Effects on Student’s Achievement. Paper presented at the 2nd Paris International Conference on Education, Economy, and Society – 2010.
Spellman, J. E., and Oliver, J. S. (2001). The Relationship between Attitude toward Science with Enrollment in a Block Schedule.
Tabachnick, B. G., and Fidell, L. S. (2013). Using multivariate statistics: International edition. Pearson 2012.
Tavşancıl, E. (2014). Measuring Attitudes and Data Analysis with SPSS. Ankara: Nobel.
Tekbiyik, A., and Akdeniz, A. R. (2010). A contemporary physics attitude scale for secondary school students: development, validity, and reliability. Journal of Turkish Science Education, 7(4), 134–144.
Ugulu, I. (2011). The impact of recycling education on the knowledge, attitudes, and behaviors of secondary school students. Ph.D. diss., Dokuz Eylul University, Turkey.
Ugulu, I. (2013). Confirmatory factor analysis for testing validity and reliability of traditional knowledge scale to measure university students’ attitudes. Educational Research and Reviews, 8(16), 1399.
Usak, M., Erdogan, M., Prokop, P., and Ozel, M. (2009). High school and university students’ knowledge and attitudes regarding biotechnology. Biochemistry and Molecular Biology Education, 37(2), 123–130.
Yara, P. O. (2009). Students’ attitude towards mathematics and academic achievement in some selected secondary schools in Southwestern Nigeria. European Journal of Scientific Research, 36(3), 336–341.
Yavas, P. U., and Çagan, S. (2017). Development of an Attitude Scale towards High School Physics Lessons. Journal of Education and Training Studies, 5(1), 56–66.
Yavuz, S. (2005). Developing a Technology Attitude Scale for Pre-Service Chemistry Teachers. Turkish Online Journal of Educational Technology-TOJET, 4(1), 17–25.
Yousuf, A., and Bhutta, S. (2012). Secondary school students’“ attitude towards environmental issues in Karachi Pakistan. Journal of Educational and Social Research, 2(10), 154–165.
Biographies

Shahzad Ahmad, is an educational Specialist with more than 15 years of diversified experience in the field of Education, especially in Teacher Education. He is currently working as an Assistant Professor (Mathematics) at Federal College of Education, H-9, Islamabad which is a post graduate teacher training institute catering the needs of both Pre-service and In-service teacher’s education and training. He has done his Ph.D. from Allama Iqbal Open University, H-8, Islamabad, Pakistan. His area of interest includes Assessment and Evaluation, Pedagogy, Curriculum Development and Research and Data Analysis. He is also a member of National Curriculum Council (NCC). He is member of Core committee regarding Single National Curriculum (SNC) for Mathematics.

Naveed Sultana, currently working as an Associate Professor in one of the most prominent distance learning institution, Allama Iqbal Open University, H-8, Islamabad. She has supervised numbers of post graduates in their research thesis both at M.Phil. and Ph.D. level. Her area of interest is Curriculum and Science Education. She is an author of various international publications and has presented at various forums as well.

Sadia Jamil, currently working as subject specialist in the Federal College of Education, H-9, Islamabad. She is doing her M.Phil. in Science Education and teaching Biological Sciences at post graduate level. Her area of interest includes Psychology, Human Development and Educational Research.
Journal of Reliability and Statistical Studies, Vol. 14, Issue 1 (2021), 285–310.
doi: 10.13052/jrss0974-8024.14114
© 2021 River Publishers