Stochastic Analysis of a Three-Unit Non-Identical Repairable System with Simultaneous Working of Cold Standby Units
S. Kadyan1, S. C. Malik1,* and Gitanjali2
1Department of Statistics, M. D. University, Rohtak, India
2Department of Applied Sciences, M.S. Institute of Technology, Delhi, India
E-mail: swtykadyan@gmail.com; sc_malik@rediffmail.com; drgitanjali@msit.in
*Corresponding Author
Received 14 August 2020; Accepted 24 November 2020; Publication 05 January 2021
Abstract
Here, stochastic analysis of a repairable system of three units has been carried out by taking one unit in operation (called main unit) and two identical units (called duplicate units) in cold standby. The switch device is used to convert the standby units into operative mode. A single server is hired to handle repair activities of the units who visits the system instantly whenever needed. The repair done by the server is perfect and thus the repaired unit follows the same lifetime distribution as the original. The constant failure rates are considered for both main and the duplicate units while their repair time distributions are taken as arbitrary. Some important reliability measures including mean sojourn times (MST), transition probabilities (TP), mean time to system failure (MTSF), availability, expected number of repairs for both kinds of units separately, expected number of visits by the server and busy period analysis of the server due to repair are determined using semi-Markov process (SMP) and regenerative point technique (RPT). The arbitrary values of the parameters are considered to examine the behaviour of some significant reliability measures through graphs. The possible application of the system model can be visualized in a power supply system of a house where a set of solar panels are kept in spare for their simultaneously working when main power supply is discontinued.
Keywords: Repairable system, non-identical units, simultaneous working of cold standby units, stochastic analysis.
1 Introduction
With the growing use of digitalization, new technological systems have been emerged with complex configuration and high features. And, therefore, the newly developed devices have taken place to perform singularly the task of old ones. Some of these new devices are easy to afford while some are non-affordable. It is also observed that with the introduction of new technologies and passage of time, the devices get cheaper. However, there are many devices which are costly to use such as transformer and MRI machines but have the ability to perform hard tasks. On the other hand, most of the system models have been developed by taking identical units as redundancies. But it is not always possible to keep space consuming and high cost units (machines) in standby. In such circumstances we can think of some dissimilar units that will work on failure of the main unit. Also, in some situations there are redundancies which one would like to work with even when main unit is repaired because of their qualities like environment friendliness, cheap handling cost etc. One such situation can be visualised as a house in which main power supply is through transformer and has a system of two solar panels as well. Whenever there is a disruption in the main supply, the power supply to the house may be provided from solar panels and vice versa.
The situation can be viewed as follows:

Here we have one main unit i.e. transformer and two duplicate units as the set of solar panels. If transformer fails then both the solar panels work simultaneously as single solar panel cannot meet the requirements of the house and if one of the solar panels fails when the transformer is already failed then the power supply of the house shall be completely down. Many other researchers have also considered the concept of non-identical units. Malik et al. [2010] worked with a system of two non-identical parallel units with inspection of duplicate unit and priority to main unit for repair. Salah and EL-Sherbeny [2012] worked on a two non-identical units parallel system with different causes of failure i.e. critical human error and non-critical human error Deswal and Malik [2015] studied reliability measures of a system consisting of two non-identical units with priority subject to weather conditions. Malik and Rathee [2016] assumed maximum operation and repair times of the system. Kumar et al. [2019] analysed a system with two non-identical warm standby units in different environments.
There has been a lot of work on systems with one main unit and one dissimilar unit added in parallel including Kumar & Sirohi [2015] and Singh & Poonia [2019]. There are some studies conducted on systems with three or more units including El-Damcese and Temraz [2012], Lado and Singh [2019], Singh et al. [2020], Gehlot et al. [2020] but in these studies all the units taken are identical. Here it is noticed that a system with one main unit and more than one identical units will be useful if there is a situation where similar standby unit cannot be afforded and dissimilar standby unit is not efficient enough to replace the failed main unit such a system is also analysed by Kadyan et al. [2020] but they prioritised the main unit for operation which is not always necessary as discussed in the example where a person may wish to operate with solar panels although transformer is good as solar panels are economic.
2 System Description and Notations
Here, a repairable system of three units is being analysed. There is one main unit and two duplicate units. The main unit is more efficient and dissimilar to duplicate units. Duplicate units are similar to each other and work simultaneously on failure of main unit with the help of a perfect and instantaneous switch device. There is single server who can be made available immediately to repair both types of units but with different repair rates. Repair distributions are assumed to be arbitrary while failure rates of both types of units are assumed constant. Repair rate and failure rate of duplicate units are different from those of main unit. The system fails whenever the main unit fails along with at least one of the duplicate units.
States of the system are defined as:
S: An operative state where the main unit is operating while the duplicate units are in cold standby.
S: An operative state where both of the duplicate units are operating simultaneously and main unit is failed and under repair.
S: A failed state where one of the duplicate units is failed, waiting for repair as the server is busy in repairing the main unit while the other is waiting for operation and the main unit is under repair from the last state.
S: An operative state where both the duplicate units are operating simultaneously with the main repaired unit in cold standby.
S: An operative state where main unit is operating and one of the duplicate units is under repair while the other is in cold standby.
S: A failed state where one of the cold standby units is under repair from the last state, the other is waiting for operation and the main unit is waiting for repair as the server is busy in repairing one of the duplicate units.
Notations
| The rate at which main/duplicate unit fails | |
| MO/DO | The main unit/duplicate units are operative |
| DCs | The duplicate unit is in cold standby |
| MFUr/MFWr | The failed main unit is under repair/waiting for repair |
| DFUr/DFWr | The failed duplicate unit is under repair/waiting for repair |
| MFUR/DFUR | The failed main unit/duplicate unit is being repaired continuously from last state |
| DWo | The duplicate unit is waiting for operation |
| G(t)/g(t) | cdf/pdf of time taken in repair of the main unit |
| G(t)/g(t) | cdf/pdf of time taken in repair of duplicate unit |
| Q(t),q(t) | cdf/pdf of passage time from regenerative state S to a regenerative state or to a failed state S without visiting to any other regenerative state in time (0,t] |
| Q(t),q(t) | pdf and cdf of first passage time from regenerative state i to a regenerative state j or to a failed state j visiting state k,r once in (0,t]. |
| M(t) | Probability of system up initially in state S set of regenerative states, is up at time t without visiting to any other regenerative sate |
| W(t) | Probability of server is busy in the state S up to time t without making any transition to any other regenerative state or returning to the same via one or more non- regenerative states |
| m | Contribution to mean sojourn time in regenerative state S and non-regenerative state if occurs before transition to some other regenerative state S |
| The mean time spent in state S represented by | |
| denotes the sojourn time in state i | |
| Symbol for Laplace-Stieltjes convolution/Laplace convolution | |
| */** | Symbol for Laplace transformation/ Laplace-Stieltjes transformation [5] |
The state transition diagram for the system can be visualised as:

3 TP and MST
Using simple probabilistic laws the expressions for transition probabilities in steady state are as follows:
, , , , , , , , ,
It can be clearly seen that
and,
The mean sojourn times () in i regenerative state are given as:
.
4 Reliability and MTSF
Let (t) be the cdf of the first passage time from regenerative state i to a failed state. Regarding the failed state as absorbing state, we have the following recursive relations for (t) [5]:
Taking LST of these recursive relations and solving for , we get:
The reliability of this system can be easily obtained by making use Inverse Laplace transform of i.e.
and
where and
5 Steady State Availability
Let A(t) be the probability that the system is in up-state at instant ‘t’ given that the system entered regenerative state S at t = 0. The recurrent relations for A(t) are given as [5]:
where M, M. and M, M.
Taking Laplace transform of the above recursive relations and solving for A*(s). The availability in steady state is given by:
where N and
6 Expected Number of Repairs
(a) To Repair Main Unit
Let MN(t) be the expected number of repairs of the main unit by the server in (0,t] given that the system entered the regenerative state S at t = 0. The recurrent relations for MN(t) are given as [5]:
Taking LST of above relations and solving for MN**(s), the expected number of repairs per unit time by the server are given as:
where and D is already defined.
(b) To Repair Duplicate Unit
Let DN(t) be the expected number of repairs of the duplicate unit by the server in (0,t] given that the system entered the regenerative state S at . The recursive relations for DN(t) are given as [5]:
Taking LST of these recursive relations and solving for DN**(s), the expected number of repairs per unit time by the server are given as:
where N and D is already defined.
7 Expected Number of Visits by the Server
Let N(t) be the expected number of visits by the server in (0,t] given that the system entered the regenerative state S at t = 0. The recurrent relations for N(t) are given as [5]:
Taking LST of these recursive relations and solving for EN**(s), the expected number of visits per unit time by the server are given as:
8 Busy Period Analysis for the Server due to Repair
Let B(t) be the probability that the server is busy in repair at an instant t given that the system entered the regenerative state S at . The recursive relations for B(t) are given as [5]:
where . and .
Taking Laplace transform of above relations and solving for B*(s). The time for which server is busy due to repair is given by:
where (0)and D is already defined.
9 Profit Analysis
The profit obtained to the system model in steady state can be obtained as:
P RA – CMN–CDN–CN, where
P Profit of the system model
R Revenue per unit up time of the system
C Cost per unit time repair of main unit
C Cost per unit time repair of duplicate unit
C Cost per visit of the server
10 Numerical and Graphical Representations of Different Reliability Measures
To study the graphs of the model, repair rates of both kind of units are taken to be negative exponential i.e. g (t) = , g (t) = and some numerical values are given to the failure rates and other parameters. Numerical and graphical representations of MTSF for some particular values are given below:
Table 1 Effect of repair rate of main unit on MTSF
| Repair Rate | MTSF | |||
| , | , | , | , | |
| , | , | , | , | |
| 2 | 95342.37645 | 104045.8994 | 36307.98403 | 49081.13984 |
| 2.1 | 99044.32882 | 108474.7433 | 37368.49315 | 51210.04673 |
| 2.2 | 102670.0309 | 112843.3719 | 38388.29175 | 53314.22764 |
| 2.3 | 106221.8145 | 117153.0047 | 39369.67985 | 55394.11085 |
| 2.4 | 109701.9173 | 121404.829 | 40314.78743 | 57450.11481 |
| 2.5 | 113112.4875 | 125600 | 41225.58984 | 59482.6484 |
| 2.6 | 116455.5885 | 129739.6426 | 42103.92157 | 61492.11124 |
| 2.7 | 119733.2027 | 133824.8521 | 42951.48862 | 63478.89391 |
| 2.8 | 122947.2357 | 137856.695 | 43769.87952 | 65443.37823 |
| 2.9 | 126099.5197 | 141836.2103 | 44560.5753 | 67385.9375 |
It is evident from Table 1 that MTSF increases with the increase of repair rate of main unit. When value of is increased to 0.005 from 0.002 there is a steep decline in MTSF and so in the case of when it is increased to 0.01 from 0.005 while there is a huge increase in MTSF with increase in repair rate of duplicate units. Graphically it is easier to view these effects:
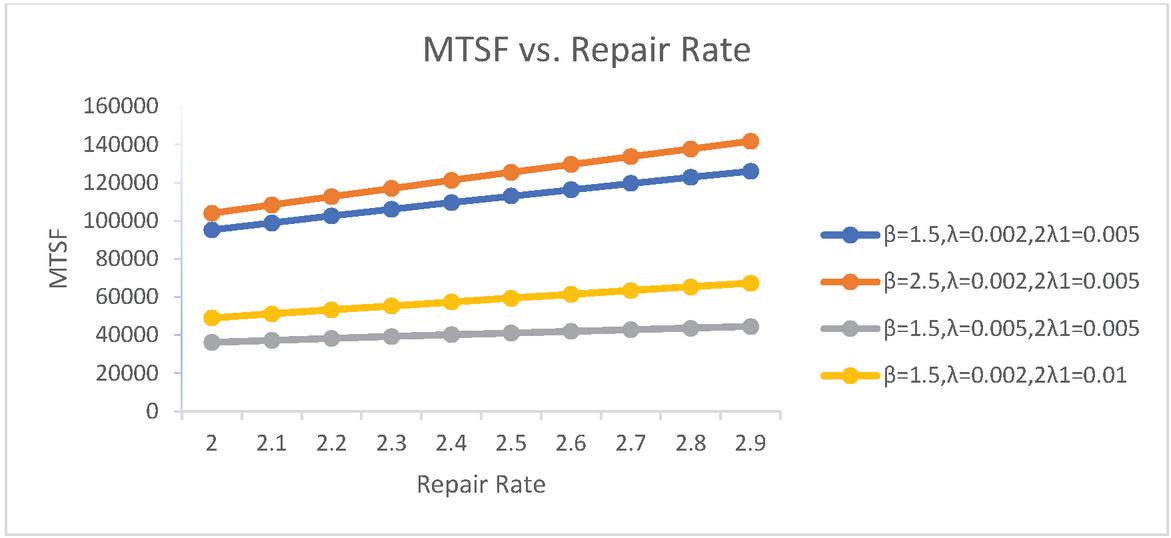
Figure 1 MTSF vs Repair Rate of Main Unit ().
Numerical and graphical representations of availability for some particular values are given below:
Table 2 Effect of repair rate of main unit on availability
| Repair Rate | Availability | |||
| , | , | , | , | |
| , | , | , | , | |
| 2 | 0.999994375 | 0.999995321 | 0.999984326 | 0.999989385 |
| 2.1 | 0.999994759 | 0.999995706 | 0.999985095 | 0.999990218 |
| 2.2 | 0.999995093 | 0.999996039 | 0.999985762 | 0.999990941 |
| 2.3 | 0.999995384 | 0.99999633 | 0.999986343 | 0.999991571 |
| 2.4 | 0.999995639 | 0.999996586 | 0.999986854 | 0.999992125 |
| 2.5 | 0.999995864 | 0.999996811 | 0.999987305 | 0.999992614 |
| 2.6 | 0.999996064 | 0.999997011 | 0.999987705 | 0.999993048 |
| 2.7 | 0.999996243 | 0.999997189 | 0.999988062 | 0.999993435 |
| 2.8 | 0.999996402 | 0.999997349 | 0.999988381 | 0.999993781 |
| 2.9 | 0.999996546 | 0.999997492 | 0.999988667 | 0.999994092 |
After studying these numerical values closely, it is found that availability increases with the increase in repair rate of main unit. In column 1of the above Table 2, when repair rate of main unit is 2.0 then availability is 0.999994375 and it keeps on increasing up to 0.999996546 as the repair rate of the main unit reaches to 2.9. Also, it can be seen in the column 2 of the same table that when repair rate of duplicate unit is increased to 2.5 from 1.5(i.e. in 1st column) then there is a slight increase in the availability too. From column 3, it is concluded that when failure rate of main unit is increased to 0.005 from 0.002 then there is an adverse effect on the availability of the system. From column 4, it is seen that there is an adverse effect on system availability when failure rate of duplicate unit is increased to 0.01 from 0.005 but the effect is less adverse than that of main unit.
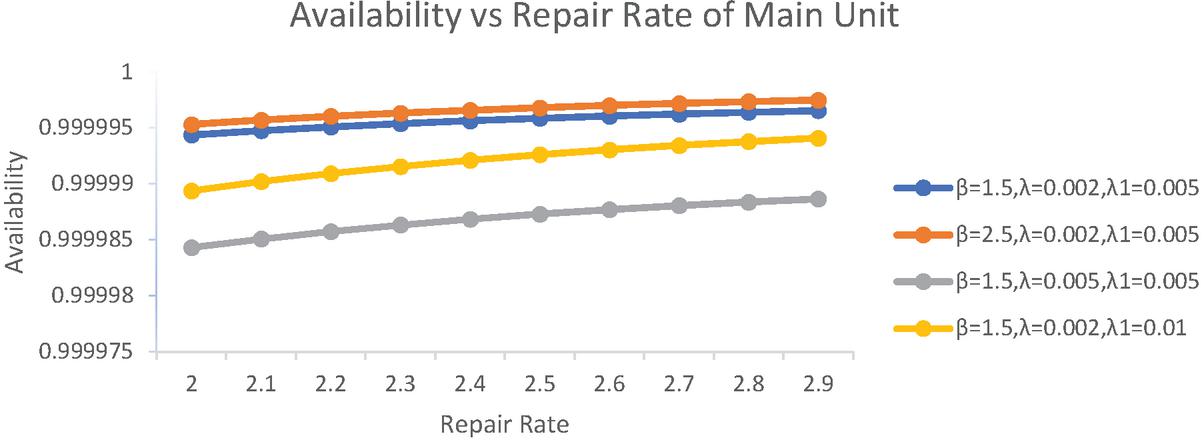
Figure 2 Availability vs repair rate of main unit ().
Numerical and graphical representations of profit for some particular values of parameters and failure rates are given below:
Table 3 Effect of repair rate of main unit on profit
| Repair Rate | Profit | |||
| , | , | , | , | |
| , | , | , | , | |
| 2 | 14996.25 | 14996.27 | 14992.45 | 14995.86 |
| 2.1 | 14996.26 | 14996.28 | 14992.46 | 14995.87 |
| 2.2 | 14996.27 | 14996.28 | 14992.47 | 14995.88 |
| 2.3 | 14996.27 | 14996.28 | 14992.48 | 14995.89 |
| 2.4 | 14996.27 | 14996.29 | 14992.48 | 14995.89 |
| 2.5 | 14996.28 | 14996.29 | 14992.49 | 14995.90 |
| 2.6 | 14996.28 | 14996.29 | 14992.50 | 14995.91 |
| 2.7 | 14996.28 | 14996.30 | 14992.50 | 14995.91 |
| 2.8 | 14996.29 | 14996.30 | 14992.51 | 14995.92 |
| 2.9 | 14996.29 | 14996.30 | 14992.51 | 14995.92 |

Figure 3 Profit vs repair rate of main unit.
It is clear from the above Table 3 that there is increase in the profit as the repair rate of main unit is increased from 2 to 2.9. Also, from column 2 it is found that when repair rate of duplicate unit is increased from 1.5 to 2.5 then there is a slight increase in the profit. From column 3, when failure rate of main unit is increased to 0.005 from 0.002 then profit of the system falls. From column 4, when failure rate of duplicate unit is increased to 0.01 from 0.005 then profit is less but better than that of when failure rate of main unit was increased. Graphically it is easier to view these effects:
11 Conclusion
The study concerns to the evaluation of some important reliability measures of a three-unit repairable system with one main unit and two cold standby units which are non-identical to the main unit. First, the results of reliability measures are obtained in general terms with arbitrary distributions. The graphical and numerical studies are performed for a particular case , by taking some particular values of parameters. It is found that there is an increase in the MTSF, availability and profit as the repair rate of main unit and duplicate units are increased. However, increase in the values of these measures is less than that of main unit. Also, there is decrease in the MTSF, system availability and profit when failure rate of either of the units (i.e. main unit and duplicate units) is decreased. The system is found to perform worst for all the reliability measures when failure rate of main unit is increased. Hence, the study reveals that a repairable system of three units in which two identical units are in cold standby can be made more reliable and profitable to use by taking a less prone failure the main unit. The future research direction can be the development of system reliability models with three units and different repair policies such as arrival time of the server, maximum repair time to the main unit and priority in repair disciplines.
References
[1] Deswal S. and Malik S. C. [2015]: Reliability measures of a system of two non-identical units with priority subject to weather conditions, Journal of Reliability and Statistical Studies, Vol. 8(1), pp. 181–190.
[2] El-Damcese and Temraz [2012]: Analysis for a parallel repairable system with different failure modes, Journal of Reliability and Statistical Studies, Vol. 5(1), pp. 95–106.
[3] Gahlot, M., Singh, V.V., Ayagi, H.I. and Abdullahi I. [2020]: Stochastic analysis of a two units’ complex repairable system with switch and human failure using copula approach. Life Cycle Reliab Saf Eng Vol. 9, pp. 1–11.
[4] Lado, Abdul and Singh V. V.[2019]. Cost assessment of complex repairable system consisting two subsystems in series configuration using Gumbel Hougaard family copula. International Journal of Quality & Reliability Management, Vol. 36(10), pp. 1683–1698.
[5] Kadyan S., Barak, M.S. and Gitanjali [2020]: Stochastic Analysis of a Non-Identical Repairable System of Three Units with Priority for Operation and Simultaneous Working of Cold Standby Units, International Journal of Statistics and Reliability Engineering, Vol. 7(2), pp. 269–274.
[6] Kumar A., Pawar D. and Malik S.C. [2019]: Profit analysis of a warm standby non-identical unit system with single server performing in normal/abnormal environment, Life Cycle Reliability and Safety Engineering Vol. 8, pp. 219–226.
[7] Kumar, P and Sirohi, A. [2015]. Profit analysis of a two-unit cold standby system with delayed repair of partially failed unit and better utilization of units. International Journal of Computer Applications. Vol. 117(1), pp. 41–46.
[8] Malik S.C., Bhardwaj R. K. and Grewal A. S. [2010]: Probabilistic analysis of a system of two non-identical parallel units with priority to repair subject to inspection, Journal of Reliability and Statistical Studies, Vol. 3(1), pp. 1–11.
[9] Malik, S.C. and Rathee R. [2016]: Reliability modelling of a parallel system with maximum operation and repair times.International Journal of Operational Research, Vol. 25(1), pp. 131–142.
[10] Salah and EL-Sherbeny [2012]: Stochastic analysis of a two non-identical unit parallel system with different types of failures subject to preventive maintenance and repairs, Mathematical Problems in Engineering, Vol. 2013, 10 pages.
[11] Singh V.V. and Poonia P.K. [2019]: Probabilistic Assessment of Two-Unit Parallel System with Correlated Lifetime under Inspection Using Regenerative Point Technique, International Journal of Reliability, Risk& Safety, Theory and applications Vol. 2(1), pp. 5–18, 2019.
[12] Singh, V.V., Poonia, P.K. and Adbullahi, A.H. [2020]: Performance analysis of a complex repairable system with two subsystems in series configuration with an imperfect switch, J. Math. Comput. Sci., Vol. 10 (2), pp. 359–383.
Biographies

S. Kadyan is a Ph.D. student at M.D. University Rohtak (India) since 2019. Her Ph.D. work centres on Reliability Modelling. She has attended good number of conferences and presented her research work.

S. C. Malik is presently working as Professor & Head, Department of Statistics, M.D. University, Rohtak (Haryana). His field of research specialization are Reliability Theory, Sampling and Applied Statistics. He has a long research and teaching experience in subject of Statistics. He has supervised 40 Ph.D. students in the fields of reliability theory, sampling theory and applied statistics. Dr. Malik has been invited by various academic institutions to deliver talks and to present research papers at the conferences/ seminars/symposiums/workshops held in India and abroad including USA, UK, Portugal, Singapore, Germany, Hong-Kong, France, Spain, Netherland, Belgium, Austria, Italy, Japan, Switzerland and Nepal. He is reviewer of various journals specifically for the journals in the areas of Reliability, Operations Research and Statistics. Prof. Malik has been a member/life member of various academic/professional bodies. He is a founder President of Indian Association for Reliability and Statistics (IARS) and also Chief Editor of the UGC listed journal IJSRE being published by IARS.

Gitanjali received her Ph.D. degree in the subject Statistics from M.D. University Rohtak (India). Presently she is working as Assistant Professor in Department of Applied Sciences, MSIT, New Delhi. She has published good number of research papers in the field of Reliability theory and Modelling.
Journal of Reliability and Statistical Studies, Vol. 13_2-4, 385–400.
doi: 10.13052/jrss0974-8024.13249
© 2020 River Publishers