Memory Type Ratio and Product Estimators in Stratified Sampling
Irfan Aslam1, Muhammad Noor-ul-Amin2,*,Uzma Yasmeen3 and Muhammad Hanif1
1National College of Business Administration and Economics, Lahore, Pakistan
2COMSATS University Islamabad-Lahore Campus, Pakistan
3University of Lahore, Pakistan
E-mail: nooramin.stats@gmail.com; nooramin.stats@gmail.com; nooramin.stats@gmail.com
*Corresponding Author
16 December 2019; Accepted 05 April 2020; Publication 7 October 2020
Abstract
The exponential weighted moving average (EWMA) statistic is utilized the past information along with the present to enhance the efficiency of the estimators of the population parameters. In this study, the EWMA statistic is used to estimate the population mean with auxiliary information. The memory type ratio and product estimators are proposed under stratified sampling (StS). Mean square errors (MSE) expressions and relative efficiencies of the proposed estimators are derived. An extensive simulation study is conducted to evaluate the performance of the proposed estimators. An empirical study is presented based on real-life data that supports the findings of the simulation study.
Keywords: Stratified sampling, memory type, EWMA, ratio estimator, product estimator
1 Introduction
Estimation of the parameters for the heterogeneous population has remained a keen interest for survey statistician. In this context, the use of auxiliary information is considered incredibly supportive for the estimation procedure. If auxiliary information is linearly positive correlated with the study variable, the ratio estimator is employed. The ratio estimator for population mean using stratified sampling (StS) suggested by (Cochran, 1977) as
| (1) |
and if the relationship of the auxiliary variable is linearly negative with the variable of interest then it is healthier to use product estimator. Robson (1957) used such auxiliary information for the population mean estimation and is given by
| (2) |
where is the StS mean of study variable y, is the StS mean of auxiliary variable x and is the known population mean of auxiliary variable.
The MSEs of (1) and (2) are as follows
| (3) | ||
| (4) |
where , is the population ratio of means, nh is the sample size of stratum is the population variance of h stratum of study variable, is the population variance of auxiliary variable of h stratum, is the population covariance between auxiliary variables and study variable of h stratum and are the means of h stratum of y and x.
Many authors improved the precision of ratio and product estimators given in (1–2) by modifying them in different scenarios. For example, (Kadilar and Cingi, 2003) gave the stratified version of (Sisodia and Dwivedi, 1981; Upadhyaya and Singh, 1999), similarly (Kadilar and Cingi, 2005) extended the version of (Prasad, 1989) from simple random sampling (SRS) to StS, (Koyuncu and Kadilar, 2009) adopted the general family of estimators of (Khoshnevisan, et al., 2007; Searls, 1964) to StS, (Yasmeen, Noor-ul-Amin, and Hanif, 2015) gave a generalized exponential estimator for population mean using transformed auxiliary variable, (Malik and Singh, 2017) suggested exponential-type estimators with two auxiliary variables in StS, (Kumar, Trehan, and Joorel, 2018) gave the population mean estimate using two auxiliary variables by considering the impact of meansurment error and in the presence of non-response, (Noor-ul-Amin, Asghar, Sanaullah, and Shehzad, 2018) proposed a robust estimator using redescending M-estimator using auxiliary information. (Raza, Noor-ul-Amin, and Hanif, 2019) proposed a regression in ratio estimator in the existence of outliers using redescending M-Esimator, (Saini and Kumar, 2019) gave the transformed version of StS and stratified ranked set sampling to estimate the mean of the population.
Aforementioned studies of estimators are only useful for the surveys which are cross-sectional in nature. Therefore, the competence of the usual ratio and product estimators may be affected for surveys, in which collected information is based on time scaled, see for example (Noor-ul-Amin, 2019). To overcome this situation (Noor-ul-Amin, 2019) proposed population mean ratio and product estimators using SRS for time series data, namely memory type ratio and product estimators. (Noor-ul-Amin, 2019) suggested memory type estimators are efficient only in the case when under study population is homogenous. The problem arises for the case where under study population is heterogeneous. i.e. under study population is divided into different strata, in which each stratum is relatively heterogeneous with other strata and homogenous within itself. To overcome this problem, in this article we are suggesting the new memory type estimators for population mean that is heterogeneous in nature. A brief discussion about the memory type estimator is provided in the next section.
2 Memory Type Estimator
The EWMA statistic was first used by the (Roberts, 1959) for the purpose to make use of past information and current information simultaneously to enhance the efficiency of the estimators and is given below
| (5) |
where is the sample mean at time t, is the weight parameter/smoothing constant of observations. Its value ranges from . As moves from 0 to 1 current information gains more weight and at the same time past information goes down its weight. For , the statistic provided in (5) becomes usual sample mean. Where Zt-1 indicate the past observations of the statistic. The initial value (Z0) of Zt-1 is the expected mean. Expected mean value along with variance of (5) is given as
where, and are the mean and variance of y, the study variable. As the variance of (5) is given as
| (6) |
3 Proposed Memory Type StS Estimators
This section include proposed memory type ratio and product estimators. Suppose that the study variable is denoted by y and the auxiliary variable is denoted by x. The EWMA statistic is utilized to propose memory type estimators as given in (5). For easiness, we are once more bringing up the EWMA memroty base statistic for study variable (y) as provided in (5), represented by Zst such that
| (7) |
and EWMA statistic for auxiliary variable (x) represented by Qst such that
| (8) |
where and representes the means of sample data under StS scheme at time t. The proposed memory type EWMA ratio and product estimators under StS design as
| (9) |
and
| (10) |
to obtain the MSE expression for proposed ratio estimator, we define the following notations such as
| (11) |
Further we have,
| (12) |
where
and
To derive the MSE expression put value of Zst and Qst from (11) into (9) and then simplifying by Taylor series approximation, we have
further simplifying and ignoring the higher order terms, the approximate expression is obtained as
the approximate MSE expression is given by
| (13) | ||
| (14) |
after simplification, we have
| (15) |
In similar manner, the approximate MSE expression for the proposed memory type product estimator is specified by
| (16) |
4 Simulation Study
To evaluate the performance of the proposed memory type estimator an extensive simulation study is carried out of the proposed ratio and product estimators. The presented MSEs are based on 50,000 replicates for various StS. The MSE is computed for each StS scheme as
| (17) |
where . The relative efficiencies (REs) are obtained as
| (18) |
where and μd is the mean of d.
The MSE values are presented in Tables 1 and 2 the results regarding the REs are given in Tables 3 and 4. The results of MSEs and REs are acquired for different choices of correlation coefficients, i.e. 0.05, 0.25, 0.50, 0.75, 0.95. To see the impact of smoothing constant, we have used the various values of , i.e. 0.05, 0.10, 0.25, 0.50, 0.75, 1.0.
Table 1 MSEs of usual and proposed memory type ratio estimators
| n | ||||||||
| 0.05 | 10 | 0.1443 | 0.0038 | 0.0076 | 0.0205 | 0.0480 | 0.0860 | 0.1450 |
| 20 | 0.0720 | 0.0018 | 0.0038 | 0.0102 | 0.0230 | 0.0430 | 0.0720 | |
| 30 | 0.0483 | 0.0012 | 0.0025 | 0.0069 | 0.0160 | 0.0290 | 0.0480 | |
| 50 | 0.0290 | 0.0007 | 0.0015 | 0.0040 | 0.0090 | 0.0170 | 0.0290 | |
| 200 | 0.0072 | 0.0002 | 0.0003 | 0.0010 | 0.0020 | 0.0040 | 0.0070 | |
| 500 | 0.0029 | 0.0001 | 0.0001 | 0.0004 | 0.0000 | 0.0010 | 0.0020 | |
| 0.25 | 10 | 0.1150 | 0.0038 | 0.0061 | 0.0164 | 0.0380 | 0.0690 | 0.1150 |
| 20 | 0.0518 | 0.0015 | 0.0030 | 0.0081 | 0.0190 | 0.0340 | 0.0580 | |
| 30 | 0.0390 | 0.0010 | 0.0020 | 0.0054 | 0.0120 | 0.0230 | 0.0380 | |
| 50 | 0.0232 | 0.0006 | 0.0012 | 0.0033 | 0.0070 | 0.0130 | 0.0230 | |
| 200 | 0.0057 | 0.0001 | 0.0003 | 0.0008 | 0.0010 | 0.0030 | 0.0050 | |
| 500 | 0.0023 | 0.0001 | 0.0001 | 0.0003 | 0.0000 | 0.0010 | 0.0020 | |
| 0.50 | 10 | 0.0799 | 0.0021 | 0.0041 | 0.1150 | 0.0260 | 0.0480 | 0.0800 |
| 20 | 0.0402 | 0.0010 | 0.0020 | 0.0037 | 0.0130 | 0.0240 | 0.0400 | |
| 30 | 0.0269 | 0.0007 | 0.0014 | 0.0038 | 0.0080 | 0.6300 | 0.0270 | |
| 50 | 0.0162 | 0.0004 | 0.0008 | 0.0023 | 0.0050 | 0.6180 | 0.0160 | |
| 200 | 0.0040 | 0.0004 | 0.0002 | 0.0005 | 0.0010 | 0.6210 | 0.0040 | |
| 500 | 0.0016 | 0.0001 | 0.0002 | 0.0002 | 0.0000 | 0.6230 | 0.0010 | |
| 0.75 | 10 | 0.0447 | 0.0010 | 0.0023 | 0.0064 | 0.0140 | 0.0260 | 0.0450 |
| 20 | 0.0223 | 0.0005 | 0.0012 | 0.0032 | 0.0070 | 0.0130 | 0.0220 | |
| 30 | 0.0149 | 0.0003 | 0.0007 | 0.0021 | 0.0040 | 0.0080 | 0.0140 | |
| 50 | 0.0090 | 0.0002 | 0.0004 | 0.0012 | 0.0020 | 0.0050 | 0.0090 | |
| 200 | 0.0022 | 0.0001 | 0.0001 | 0.0003 | 0.0000 | 0.0010 | 0.0020 | |
| 500 | 0.0008 | 0.0000 | 0.0000 | 0.0001 | 0.0000 | 0.0000 | 0.0000 | |
| 0.95 | 10 | 0.0163 | 0.0004 | 0.0000 | 0.0020 | 0.0060 | 0.0090 | 0.0160 |
| 20 | 0.0082 | 0.0002 | 0.0000 | 0.0011 | 0.0020 | 0.0040 | 0.0080 | |
| 30 | 0.0054 | 0.0001 | 0.0000 | 0.0000 | 0.0010 | 0.0030 | 0.0050 | |
| 50 | 0.0032 | 0.0000 | 0.0000 | 0.0000 | 0.0010 | 0.0010 | 0.0030 | |
| 200 | 0.0008 | 0.0000 | 0.0000 | 0.0000 | 0.0000 | 0.0000 | 0.0000 | |
| 500 | 0.0003 | 0.000 | 0.0000 | 0.0000 | 0.0000 | 0.0000 | 0.0000 | |
Table 2 MSEs of usual and proposed memory type product estimators
| n | ||||||||
| 0.05 | 10 | 0.1463 | 0.0038 | 0.0078 | 0.0214 | 0.0480 | 0.0875 | 0.1451 |
| 20 | 0.0724 | 0.0018 | 0.0037 | 0.0102 | 0.0244 | 0.0434 | 0.0721 | |
| 30 | 0.0480 | 0.0013 | 0.0025 | 0.0069 | 0.0161 | 0.0292 | 0.0481 | |
| 50 | 0.0291 | 0.0007 | 0.0015 | 0.0041 | 0.0096 | 0.0172 | 0.0288 | |
| 200 | 0.0072 | 0.0002 | 0.0004 | 0.0010 | 0.0024 | 0.0044 | 0.0073 | |
| 500 | 0.0029 | 0.0001 | 0.0002 | 0.0004 | 0.0010 | 0.0018 | 0.0029 | |
| 0.25 | 10 | 0.1162 | 0.0030 | 0.0063 | 0.0165 | 0.0385 | 0.0699 | 0.1164 |
| 20 | 0.0578 | 0.0015 | 0.0030 | 0.0083 | 0.0195 | 0.0348 | 0.0578 | |
| 30 | 0.0386 | 0.0010 | 0.0020 | 0.0056 | 0.0132 | 0.0234 | 0.0389 | |
| 50 | 0.0232 | 0.0006 | 0.0012 | 0.0034 | 0.0079 | 0.0139 | 0.0236 | |
| 200 | 0.0059 | 0.0001 | 0.0003 | 0.0008 | 0.0020 | 0.0035 | 0.0059 | |
| 500 | 0.0023 | 0.0001 | 0.0001 | 0.0003 | 0.0008 | 0.0014 | 0.0023 | |
| 0.50 | 10 | 0.0805 | 0.0020 | 0.0042 | 0.0116 | 0.0268 | 0.0479 | 0.0802 |
| 20 | 0.0406 | 0.0010 | 0.0021 | 0.0058 | 0.0135 | 0.0241 | 0.0402 | |
| 30 | 0.0271 | 0.0007 | 0.0014 | 0.0038 | 0.0089 | 0.0161 | 0.0267 | |
| 50 | 0.0161 | 0.0004 | 0.0008 | 0.0024 | 0.0054 | 0.0096 | 0.0159 | |
| 200 | 0.0040 | 0.0001 | 0.0002 | 0.0006 | 0.0013 | 0.0024 | 0.0040 | |
| 500 | 0.0016 | 0.0000 | 0.0001 | 0.0002 | 0.0006 | 0.0010 | 0.0016 | |
| 0.75 | 10 | 0.0447 | 0.0011 | 0.0023 | 0.0064 | 0.0150 | 0.0268 | 0.0446 |
| 20 | 0.0223 | 0.0006 | 0.0012 | 0.0032 | 0.0075 | 0.0135 | 0.0224 | |
| 30 | 0.0149 | 0.0004 | 0.0008 | 0.0021 | 0.0050 | 0.0090 | 0.0149 | |
| 50 | 0.0089 | 0.0002 | 0.0005 | 0.0013 | 0.0030 | 0.0054 | 0.0090 | |
| 200 | 0.0022 | 0.0001 | 0.0001 | 0.0003 | 0.0008 | 0.0014 | 0.0023 | |
| 500 | 0.0009 | 0.0000 | 0.0000 | 0.0001 | 0.0003 | 0.0005 | 0.0009 | |
| 0.95 | 10 | 0.0163 | 0.0004 | 0.0009 | 0.0024 | 0.0054 | 0.0097 | 0.0162 |
| 20 | 0.0081 | 0.0002 | 0.0004 | 0.0011 | 0.0027 | 0.0049 | 0.0082 | |
| 30 | 0.0055 | 0.0001 | 0.0003 | 0.0008 | 0.0018 | 0.0033 | 0.0055 | |
| 50 | 0.0033 | 0.0001 | 0.0002 | 0.0005 | 0.0011 | 0.0020 | 0.0032 | |
| 200 | 0.0008 | 0.0000 | 0.0000 | 0.0001 | 0.0003 | 0.0005 | 0.0008 | |
| 500 | 0.0003 | 0.0000 | 0.0000 | 0.0000 | 0.0001 | 0.0002 | 0.0003 | |
Table 3 REs of usual and proposed memory type ratio estimator
| n | ||||||||
| 0.05 | 10 | 0.3470 | 13.1600 | 6.5410 | 2.4133 | 1.0390 | 0.5800 | 0.3440 |
| 20 | 0.3462 | 13.4110 | 6.4000 | 2.4360 | 1.0480 | 0.5740 | 0.3430 | |
| 30 | 0.3466 | 13.9360 | 6.4460 | 2.3870 | 1.0520 | 0.5730 | 0.3480 | |
| 50 | 0.3441 | 13.5930 | 6.5780 | 2.4350 | 1.0470 | 0.5760 | 0.3420 | |
| 200 | 0.3421 | 12.6590 | 6.9070 | 2.3780 | 1.0370 | 0.5720 | 0.3430 | |
| 500 | 0.3460 | 13.8380 | 6.2940 | 2.4480 | 1.0250 | 0.5730 | 0.3450 | |
| 0.25 | 10 | 0.4510 | 16.2200 | 8.2400 | 3.0200 | 1.2900 | 0.7110 | 0.4302 |
| 20 | 0.4210 | 16.4000 | 8.1000 | 3.0240 | 1.3000 | 0.7200 | 0.4307 | |
| 30 | 0.4320 | 17.1800 | 8.2500 | 3.0700 | 1.2900 | 0.7040 | 0.4341 | |
| 50 | 0.4280 | 16.6300 | 7.9500 | 2.9600 | 1.2800 | 0.7210 | 0.4295 | |
| 200 | 0.4260 | 17.1400 | 8.1300 | 2.9800 | 1.2980 | 0.7220 | 0.4349 | |
| 500 | 0.4290 | 16.5500 | 8.3300 | 3.0500 | 1.2990 | 0.7160 | 0.4300 | |
| 0.50 | 10 | 0.6240 | 24.0040 | 12.1400 | 4.3200 | 1.8640 | 1.0230 | 0.6254 |
| 20 | 0.6290 | 24.3800 | 11.9200 | 4.4000 | 1.8560 | 1.0300 | 0.6095 | |
| 30 | 0.6170 | 23.4230 | 11.7900 | 4.3500 | 1.8640 | 1.0480 | 0.6137 | |
| 50 | 0.6120 | 24.0060 | 11.7000 | 4.3400 | 1.8540 | 1.0360 | 0.6161 | |
| 200 | 0.6220 | 23.5100 | 12.1600 | 4.3000 | 1.8500 | 1.0290 | 0.6180 | |
| 500 | 0.6040 | 23.6230 | 11.7100 | 4.3500 | 1.8240 | 1.0450 | 0.6241 | |
| 0.75 | 10 | 1.1295 | 44.4650 | 21.1800 | 7.8350 | 3.3840 | 1.8410 | 1.0994 |
| 20 | 1.1145 | 43.7736 | 20.9190 | 7.7290 | 3.3160 | 1.8380 | 1.1188 | |
| 30 | 1.1155 | 43.6897 | 21.7500 | 7.7910 | 3.3500 | 1.8620 | 1.1122 | |
| 50 | 1.1065 | 41.7361 | 21.7100 | 7.8130 | 3.3980 | 1.8800 | 1.1163 | |
| 200 | 1.1138 | 43.3487 | 21.1900 | 7.7320 | 3.3520 | 1.8360 | 1.1128 | |
| 500 | 1.1158 | 41.6332 | 21.2200 | 7.9120 | 3.3240 | 1.8410 | 1.1128 | |
| 0.95 | 10 | 3.0200 | 121.7600 | 60.1400 | 21.9500 | 9.1960 | 5.0700 | 3.0408 |
| 20 | 3.0000 | 112.9100 | 58.7000 | 21.6300 | 9.2520 | 5.1000 | 3.0946 | |
| 30 | 3.0300 | 118.6000 | 58.7000 | 21.4100 | 9.2980 | 5.1330 | 3.0989 | |
| 50 | 3.0600 | 118.6500 | 58.9900 | 21.3900 | 9.2130 | 5.0990 | 3.0420 | |
| 200 | 3.0400 | 119.9000 | 59.1700 | 21.1600 | 9.2000 | 5.1330 | 3.1346 | |
| 500 | 3.0754 | 115.8383 | 57.2356 | 21.7014 | 9.3282 | 5.1587 | 3.0780 | |
Table 4 REs of usual and proposed memory type product estimators
| n | ||||||||
| 0.05 | 10 | 0.3435 | 13.2232 | 6.3732 | 2.3632 | 1.0376 | 0.5735 | 0.3475 |
| 20 | 0.3431 | 13.4697 | 6.6597 | 2.4502 | 1.0190 | 0.5766 | 0.3445 | |
| 30 | 0.3465 | 12.9030 | 6.6374 | 2.4120 | 1.0319 | 0.5692 | 0.3486 | |
| 50 | 0.3421 | 14.0460 | 6.6663 | 2.4332 | 1.0398 | 0.5766 | 0.3468 | |
| 200 | 0.3467 | 12.9845 | 6.3458 | 2.3874 | 1.0229 | 0.5724 | 0.3428 | |
| 500 | 0.3471 | 13.9675 | 6.5946 | 2.3853 | 1.0336 | 0.5680 | 0.3434 | |
| 0.25 | 10 | 0.4267 | 16.6829 | 7.8544 | 3.0119 | 1.2879 | 0.7180 | 0.4324 |
| 20 | 0.4304 | 17.0404 | 8.3323 | 3.0080 | 1.2796 | 0.7088 | 0.4323 | |
| 30 | 0.4297 | 17.3095 | 8.3542 | 2.9640 | 1.2614 | 0.7158 | 0.4267 | |
| 50 | 0.4320 | 17.2784 | 8.3305 | 2.9379 | 1.2636 | 0.7196 | 0.4204 | |
| 200 | 0.4266 | 17.0044 | 8.0705 | 3.0803 | 1.2883 | 0.7135 | 0.4257 | |
| 500 | 0.4242 | 16.1858 | 8.2002 | 3.0031 | 1.2761 | 0.7175 | 0.4289 | |
| 0.50 | 10 | 0.6160 | 24.9066 | 11.9546 | 4.3494 | 1.8636 | 1.0393 | 0.6226 |
| 20 | 0.6171 | 24.0858 | 11.8185 | 4.3106 | 1.8408 | 1.0238 | 0.6286 | |
| 30 | 0.6086 | 23.8897 | 11.6560 | 4.3591 | 1.8535 | 1.0375 | 0.6152 | |
| 50 | 0.6173 | 23.8366 | 11.9841 | 4.1903 | 1.8678 | 1.0473 | 0.6250 | |
| 200 | 0.6222 | 24.1115 | 11.6746 | 4.2693 | 1.8669 | 1.0369 | 0.6201 | |
| 500 | 0.6194 | 23.8225 | 11.8118 | 4.2322 | 1.8262 | 1.0329 | 0.6253 | |
| 0.75 | 10 | 1.1033 | 43.4641 | 21.5880 | 7.8199 | 3.3253 | 1.8607 | 1.1189 |
| 20 | 1.1227 | 44.0298 | 21.2748 | 7.6801 | 3.3052 | 1.8562 | 1.1184 | |
| 30 | 1.1313 | 41.4012 | 20.7627 | 7.8146 | 3.3316 | 1.8628 | 1.1158 | |
| 50 | 1.1226 | 45.8385 | 20.6880 | 7.7081 | 3.3333 | 1.8787 | 1.1199 | |
| 200 | 1.1090 | 42.5829 | 20.2710 | 7.8833 | 3.3342 | 1.8392 | 1.0847 | |
| 500 | 1.1102 | 42.9247 | 20.9144 | 7.7987 | 3.3018 | 1.8213 | 1.1157 | |
| 0.95 | 10 | 3.0487 | 117.4114 | 56.8925 | 20.9934 | 9.1926 | 5.1134 | 3.0829 |
| 20 | 3.0113 | 123.1020 | 57.1116 | 21.9927 | 9.2291 | 5.1361 | 3.0418 | |
| 30 | 3.0592 | 112.4043 | 59.9413 | 21.2540 | 9.2102 | 5.1279 | 3.0765 | |
| 50 | 3.0416 | 118.3387 | 59.6482 | 21.6707 | 9.3233 | 5.1562 | 3.0720 | |
| 200 | 3.0854 | 121.3365 | 59.5081 | 20.9629 | 9.0135 | 5.0850 | 3.0435 | |
| 500 | 3.0123 | 113.8820 | 58.8907 | 21.4038 | 9.1840 | 5.1075 | 3.0562 | |
The following are steps that have been used to compute the MSEs and REs of the proposed EWMA type ratio and product estimators under stratified sampling:
(i) A population of size N 10,000 is breeded from the bivariate normal distribution and divided into two strata as, half of the size is generated with parameters for stratum 1 and remaining half with parameters for stratum 2.
(ii) Units from each stratum are selected to make sample sizes as n=10, 20, 30, 50, 200 and 500 using SRS.
(iii) Compute the EWMA statistic given in (7–8) with a different choice of smoothing constant.
(iv) Compute the ratio and product estimators given in (9–10).
(v) Repeat the steps (i) to (iv) 50,000 times.
(vi) The simulated MSE of proposed estimators are computed using the formula (17) and results are produced in Tables 1–2.
(vii) REs of each sample size for proposed estimators are obtained by using equation (18) and are reported in Tables 3–4.
5 Main Findings
The calculated results of MSEs and REs for the proposed scheme are presented in Tables 1–4. The comparative study in terms of MSEs and REs of proposed memory type ratio estimator based on stratified sampling scheme are given in Tables 1 and 3. The comparisons of the proposed memory type product estimator based on stratified sampling scheme are presented in Tables 2 and 4. Imperative findings of the proposed estimators are:
(i) We can observe from Table 1 that MSEs of the suggested EWMA ratio estimator for population mean is smaller as compared with the usual StS estimator for all values of . This shows the performance of proposed EWMA ratio estimator than usual StS. Similar results are observed for the proposed memory type product estimator which can be observed in Table 2.
(ii) The REs of the proposed ratio estimator are shown in Tables 3 and 4. In Table 3 the REs are higher than the usual StS estimator. This proves that the efficiency of the proposed ratio estimator is good with respect to the usual stratified sample estimator. Similar results are observed from the proposed product estimator which is given in Table 4.
(iii) As ρxy i.e. coefficient of correlation increases from zero to 0.95, we observed the decrease in the values of MSEs with the increase of relative efficiency for the suggested estimator. As we ρxy decreases from zero to 0.95, the relative efficiency of the proposed product EWMA estimator improved, this fact can be see from Table 4. This conclude that the use of auxiliary information has positive impact of the estimator in term of efficiency.
(iv) Fixing and ρxy, increases the sample size i.e. n 10, 20, 30, 50, 100, 200, 500 causes to reduced the MSEs with increase of sample size.
(v) Smoothing constant is used to utilize the past information and current information. The impact of in term of efficiency can be viewed from Tables 3 and 4. Moreover, means only the current information is utilized and no previous information is going to use. Then in this situation memory type proposed estimators will depend only on current information to estimate the population mean just like usual ratio and product estimators. Hence, for the proposed StS EWMA estimator and usual StS estimator will be equally good. On the other hand, as value of decreased this causes the increased in the efficiency of proposed EWMA ratio and product estimator, which can also be see from Tables 3 and 4.
6 Mathematical Comparison
In real life application proposed EWMA type ratio and product estimators are preferable to use as compared with usual StS ratio estimator; if it is provide evidence that proposed estimator has lesser MSE. This purpose can be achieved by obtaining the mathematical condition. Consequently, the proposed EWMA type ratio estimator in StS considered to be more efficient than usual ratio estimator in StS if the following condition hold:
| (19) |
This shows the efficiency of proposed EWMA type estimator over usual ratio estimator for all values of . As we have previously pointed out in Section 1 for EWMA statistic that range from 0 to 1. So, the proposed EWMA ratio estimator will always more efficient than usual StS ratio estimator for all values of . Further, the execution of both proposed and usual StS estimator will be identical for . Simulation study presented in Section 4 also support this fact.
Similarly, proposed product estimator considered to be more efficient as compared with comparative product estimator if
7 Application
In this section, to demonstrate the relevance of proposed estimators a real life example is presented.
The time scaled data of wheat consisting of 28 years from 1981–82 to 2008–09 is taken from Agriculture Census Wing, Pakistan Bureau of Statistics, Government of Pakistan. The study variable y is production (in “000” Tonnes) and area (in “000” Hectares) is taken as auxiliary variable x. Data consisting of four provinces of Pakistan, theses provinces are used as strata. The linear correlation between production and area is found to be 0.9723 and . From Table 5 it is clear that the proposed estimator is performing better as compared to the usual ratio estimator given in (1). MSE of the proposed ratio estimator is found to be 13011.83 which is lesser than the MSE of corresponding usual ratio estimator which is 346098.80. The relative efficiency of the proposed estimator is 2091.393 and usual ratio estimator is 78.6274 showing that the proposed estimator outclass the available usual ratio estimator. Figure 1 represents the performance of the proposed estimator with the usual ratio estimator. From this figure, we can observe that the proposed estimator is close to the population mean in the case of stratified sample and has less variation as compared to the usual ratio estimator. So, from Table 5 and Figure 1 we can conclude that the proposed memory type estimator performing better than the available usual ratio estimator.
Table 5 Calculations of usual and proposed memory type estimator
| Ratio Mean Estimator |
||||||
| Stratified Mean | EWMA Stratified Mean | Usual | Proposed | |||
| Crop Year | Zst | Qst | ||||
| 1981–82 | 3038.08 | 1807.98 | 4085.48 | 1984.25 | 3367.19 | 4125.80 |
| 1982–83 | 4132.63 | 1972.70 | 4090.19 | 1983.09 | 4197.85 | 4132.97 |
| 1983–84 | 3753.00 | 1918.88 | 4056.47 | 1976.67 | 3919.17 | 4112.21 |
| 1984–85 | 4960.00 | 2162.35 | 4146.82 | 1995.24 | 4596.4 | 4164.69 |
| 1985–86 | 3832.55 | 2010.63 | 4115.40 | 1996.78 | 3819.61 | 4129.94 |
| 1986–87 | 3355.53 | 1903.15 | 4039.41 | 1987.42 | 3533.05 | 4072.78 |
| 1987–88 | 4888.15 | 2099.08 | 4124.28 | 1998.58 | 4666.36 | 4135.12 |
| 1988–89 | 4886.05 | 2056.53 | 4200.46 | 2004.38 | 4760.86 | 4199.33 |
| 1989–90 | 5081.33 | 2101.03 | 4288.55 | 2014.04 | 4846.27 | 4266.81 |
| 1990–91 | 5723.68 | 2146.10 | 4432.06 | 2027.25 | 5344.25 | 4380.87 |
| 1991–92 | 4315.23 | 2051.73 | 4420.38 | 2029.69 | 4214.50 | 4364.06 |
| 1992–93 | 5205.00 | 2138.78 | 4498.84 | 2040.60 | 4876.60 | 4417.78 |
| 1993–94 | 4078.03 | 2014.55 | 4456.76 | 2038.00 | 4056.33 | 4382.05 |
| 1994–95 | 5208.33 | 2192.85 | 4531.91 | 2053.48 | 4759.39 | 4422.34 |
| 1995–96 | 4950.85 | 2096.98 | 4573.81 | 2057.83 | 4730.95 | 4453.79 |
| 1996–97 | 4948.10 | 2133.78 | 4611.24 | 2065.43 | 4646.77 | 4473.73 |
| 1997–98 | 3047.43 | 1861.85 | 4454.86 | 2045.07 | 3279.82 | 4365.03 |
| 1998–99 | 3152.80 | 1959.15 | 4324.65 | 2036.48 | 3224.71 | 4255.33 |
| 1999–00 | 2987.70 | 1802.98 | 4190.96 | 2013.13 | 3320.54 | 4171.61 |
| 2000–01 | 4813.60 | 2108.45 | 4253.22 | 2022.66 | 4574.76 | 4213.64 |
| 2001–02 | 3585.30 | 1957.58 | 4186.43 | 2016.15 | 3670.02 | 4160.85 |
| 2002–03 | 4929.28 | 2126.70 | 4260.71 | 2027.21 | 4644.50 | 4211.59 |
| 2003–04 | 4821.08 | 2067.63 | 4316.75 | 2031.25 | 4672.33 | 4258.49 |
| 2004–05 | 3764.63 | 1958.33 | 4261.54 | 2023.96 | 3852.11 | 4219.17 |
| 2005–06 | 4408.13 | 1989.58 | 4276.20 | 2020.52 | 4439.72 | 4240.89 |
| 2006–07 | 4711.35 | 2010.63 | 4319.71 | 2019.53 | 4695.44 | 4286.14 |
| 2007–08 | 3314.23 | 1832.63 | 4219.16 | 2000.84 | 3623.85 | 4225.48 |
| 2008–09 | 3692.00 | 1930.75 | 4166.45 | 1993.83 | 3831.75 | 4187.35 |
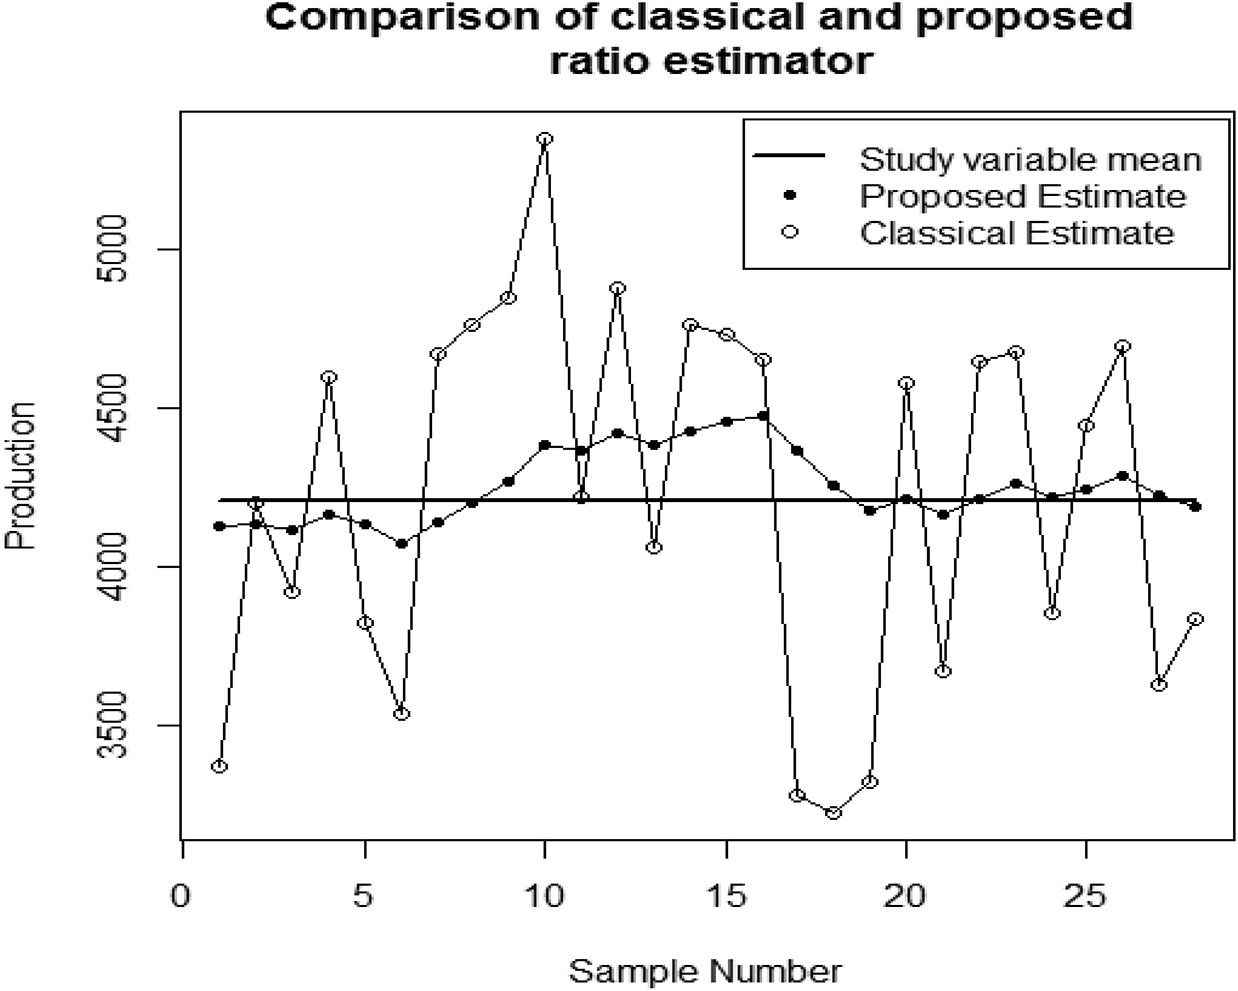
Figure 1 Comparison of proposed with usual ratio estimator for production of wheat.
8 Concluding Remarks
When we conduct time scaled surveys, it is important to use the available information as well as the current information through the sample. To deal with this issue (Noor-ul-Amin, 2019) advised product and ratio estimators using EWMA statistic for the surveys based on time under simple random sampling. In the current study, we made an attempt to improve the estimator of (Noor-ul-Amin, 2019) by using stratified sampling scheme. Therefore, we proposed product and ratio estimator using the EWMA statistic for StS. We examine that the proposed estimator by conducting an extensive simulation study and the results are given in Tables 1–4. From the simulation study and real life application, we observed that the proposed estimators are showing better results than the usual ratio and product estimators. Hence, we can conclude that the proposed memory type estimators under stratified sampling are more efficient than the usual ratio and product estimators.
References
[1] Cochran, W. G. (1977). Sampling Techniques, 3rd ed. New York, N.Y. (USA) Wiley.
[2] Kadilar, C. and Cingi, H. (2003). Ratio Estimators in Stratified Random Sampling, Biometrical Journal, 45(2), pp. 218–225.
[3] Kadilar, C., and Cingi, H. (2005). A new ratio estimator in stratified random sampling, Communications in Statistics – Theory and Methods, 34(3), pp. 597–602.
[4] Khoshnevisan, M., Singh, R., Chauhan, P., Sawan, N. and Smarandache, F. (2007). A general family of estimators for estmating population mean using known value of some population parameter(s), Far East Journal of Theoretical Statistics, 22(2), pp. 1–4.
[5] Koyuncu, N. and Kadilar, C. (2009). Ratio and product estimators in stratified random sampling, Journal of Statistical Planning and Inference, 139(8), pp. 2552–2558.
[6] Kumar, S., Trehan, M., and Joorel, J. P. S. (2018). A simulation study: estimation of population mean using two auxiliary variables in stratified random sampling, Journal of Statistical Computation and Simulation, 88(18), pp. 3694–3707.
[7] Malik, S. and Singh, R. (2017). A new estimator for population mean using two auxiliary variables in stratified random sampling, Journal of Information and Optimization Sciences, 38(8), pp. 1243–1252.
[8] Noor-ul-Amin, M. (2019). Memory type estimators of population mean using exponentially weighted moving averages for time scaled surveys, Communications in Statistics – Theory and Methods, pp. 1–12. https://doi.org/10.1080/03610926.2019.1670850
[9] Noor-ul-Amin, M., Asghar, S. U. D., Sanaullah, A. and Shehzad, M. A. (2018). Redescending M-Estimator for Robust Regression, Journal of Reliability and Statistical Studies, 11(2), pp. 69–80.
[10] Prasad, B. (1989). Some improved ratio type estimators of population mean and ratio in finite population sample surveys, Communications in Statistics – Theory and Methods, 18(1), pp. 379–392.
[11] Raza, A., Noor-ul-Amin, M. and Hanif, M. (2019). Regression-in-ratio estimators in the redescending M-estimator, Journal of Reliability and Statistical Studies, 12(2), pp. 1–10.
[12] Roberts, S. W. (1959). Control chart tests based on geometric moving averages, Technometrics, 1(3), pp. 239–250.
[13] Robson, D. S. (1957). Applications of multivariate polykays to the theory of unbiased ratio-type estimation, Journal of the American Statistical Association, 52(280), pp. 511–522.
[14] Saini, M. and Kumar, A. (2019). Ratio estimators using stratified random sampling and stratified ranked set sampling, Life Cycle Reliability and Safety Engineering, 8(1), pp. 85–89.
[15] Searls, D. T. (1964). The utilization of a known coefficient of variation in the estimation procedure, Journal of the American Statistical Association, 59(308), pp. 1225–1226.
[16] Sisodia, B. V. S. and Dwivedi, V. K. (1981). A modified ratio estimator using coefficient of variation of auxiliary variable, Journal of Indian Society of Agricultural Statistics, 33, pp. 13–18.
[17] Upadhyaya, L. N. and Singh, H. P. (1999). Use of transformed auxiliary variable in estimating the finite population mean, Biometrical Journal, 41(5), pp. 627–636.
[18] Yasmeen, U., Noor-ul-Amin, M. and Hanif, M. (2015). Generalized exponential estimators of finite population mean using transformed auxiliary variables. International Journal of Applied and Computational Mathematics, 1(4), pp. 589–598.
Biographies

Irfan Aslam is a Ph.D. student at the National College of Business Administration & Economics (NCBA&E), Lahore, Pakistan. He did his M.Phil from Govt. College University, Lahore and earned his M.Sc. degree from the University of the Punjab, Lahore. He is currently working as an Assistant professor of Statistics at Govt. Islamia College, Railway Road, Lahore. His research interests include sampling techniques and multivariate data analysis.

Muhammad Noor-ul-Amin received his Ph.D. degree from NCBA&E, Lahore, Pakistan. He has working experience in various universities for teaching and research that includes the Virtual University of Pakistan, University of Sargodha, Pakistan, and the University of Burgundy, France. He is currently working as an Assistant professor at COMSATS University Islamabad-Lahore Campus. His research interests include sampling techniques and control charting techniques. He is an HEC approved supervisor.

Uzma Yasmeen is a Ph.D. from the National College of Business Administration & Economics, Lahore, Pakistan. She has worked at the University of Waterloo and COMSATS University Islamabad. Currently, she is working as an Assistant professor at the University of Lahore, Lahore Campus. Her research interest is sampling methods.

Muhammad Hanif completed his Master’s degree from New South Wales University, Australia in Multistage Cluster Sampling. He completed his Ph.D. in Statistics from the University of Punjab, Lahore, Pakistan. He has more than 40 years of research experience. He is an author of more than 200 research papers and 10 books. He has served as a Professor in various parts of the world i.e. Australia, Libya, Saudi Arabia, and Pakistan. He is presently a Professor of Statistics and Vice-Rector (Research) at NCBA & E, Lahore, Pakistan.
Journal of Reliability and Statistical Studies, Vol. 13_1, 1–20.
doi: 10.13052/jrss0974-8024.1311
© 2020 River Publishers