Improved Hybrid Exponentially Weighted Moving Average Control Chart using Auxiliary Information
Sadia Tariq1, Muhammad Noor-ul-Amin2, Muhammad Hanif1 and Chi-Hyuck Jun3
1Department of Statistics, National College of Business Administration & Economics, Pakistan
2Department of Statistics, COMSATS University Islamabad-Lahore Campus, Pakistan
3Department of Industrial and Management Engineering, POSTECH, Pohang 790-784, Republic of Korea
E-mail: nooramin.stats@gmail.com
Corresponding Author
Abstract
Statistical process control is an important tool for maintaining the quality of a production process. Several control charts are available to monitor changes in process parameters. In this study, a control chart for the process mean is proposed. For this purpose, an auxiliary variable is used in the form of a regression estimator under the configuration of the hybrid exponentially weighted moving average (HEWMA) control chart. The proposed chart is evaluated by conducting a simulation study. The results showed that the proposed chart is sensitive with respect to the HEWMA chart. A real-life application is also presented to demonstrate the performance of the proposed control chart.
Keywords: ARL, auxiliary variable, process control
Mathematics Subject Classification: 62P30
1 Introduction
An important statistical tool for monitoring processes is the control chart. In the industry, product quality can be improved by removing the special cause of variation. A process is said to be statistically controlled if the cause of the change is due to natural or common causes. Montgomery & Runger (2007) showed that statistical process control (SPC) addresses specific causes of variability. Control charts are divided into two categories. One is a memory-less control chart like Shewhart control charts, and the other includes EWMA chart and CUSUM chart.
Control chart performance is evaluated based on average run length (ARL). The main goal when creating a new control chart is to detect changes as soon as possible. (Haq, 2013) proposed a new chart called the hybrid exponentially weighted moving average (HEWMA) chart. The author used two EWMA statistics to improve the sensitivity of the control chart. Auxiliary information can play an important role in improving the sensitivity of control charts. (Abbas, Riaz, & Does, 2014), Riaz, (2008) andNoor-ul-Amin, Khan, & Sanaullah (2019) used auxiliary information in control charts.
Several authors have proposed ratio and regression estimators that incorporate auxiliary information ((see Yasmeen, Noor-ul-Amin, & Hanif (2019) and Noor-ul-Amin and Hanif (2012). The main purpose of this study is to improve the control chart by using HEWMA statistic and auxiliary variable. To do this, we propose a control chart called MxHEWMA control chart using a regression estimator.
2 Proposed MHEWMA Control Chart
We suppose that is a supporting variable correlated with the variable of interest say and that the correlation between and is denoted by . This is assumed that where denotes the bivariate normal distribution. The auxiliary variable is incorporated in the form of regression estimator, i.e.
| (1) |
where, For statistic the mean and variance are given by
| (2) |
By using (1), the plotting statistic for the proposed control chart is defined as
| (3) |
here,
| (4) |
where two smoothing constants are and such that 1. The respective expected value, variance, and control limits of HEWMA control chart are given by
| (5) |
and
| (6) |
| (7) |
The L is a control constant, which is determined that of the HEWMA control chart will reach the pre-described level. Here, ARL is fixed at 500. The HEWMA statistic using the auxiliary information is called HEWMA. We define as the shift in the process mean.
The ARLs are calculated through the simulations by using the following steps:
i. A random sample of size one is selected from a bivariate normal distribution having the specified parameters, that is, and is computed.
ii. Setting up the upper and lower limits for the different combinations of L and , where is fixed as 0.1 (for detail see Shabbir & Awan (2016)).
iii. For comparison purposes with other control charts we fixed , the control coefficient L has been determined to set in-control ARL by simulations, the decision of L relies upon n and .
iv. We assume the value of the population correlation coefficient to be known in advance.
vi. Follow the steps (1)–(2), the number of subgroups before the first point plotted beyond the limits is recorded as run length.
vii. The process is repeated 100,000 times to obtain the ARL and the standard deviation of the run length (SDRL).
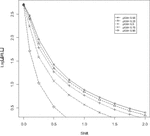
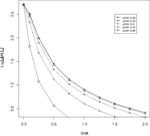
The basic discoveries about HEWMA control chart from Tables A1–A5 are discussed below:
I Auxiliary information improves the sensitivity of the proposed control chart. As it can be seen from Tables A1–A5, a decrease in ARL is observed with an increase in the value of the correlation coefficient. We observed that the efficiency of the proposed chart is almost equal to the HEWMA chart for small value of
II In all the tables, the proposed control chart ARL is fair (unbiased). In other words, ARL has never decreased from ARL for any value of .
III It is observed in Tables 1–2 and in Figures A1–A3 (listed in the Appendix) that the proposed control chart has gained the efficiency as compared to the HEWMA chart and (exponentially weighted moving average using auxiliary variable) even for a small value of correlation coefficient.
3 Comparison
This section presents the comparisons between the proposed HEWMA chart and the HEWMA control chart and the control chart. The comparative results of the HEWMA chart with the HEWMA are presented in Table 1 in the form of ARLs. Table 1 showed that the proposed chart is efficient than HEWMA chart to detect changes in process mean. From the results of the ARLs, it is clear that the proposed chart is more efficient for weak, moderate, and high correlation values. The same results are observed in Table 2 in comparison with control chart.
Table 1 Comparison of ARL of HEWMA chart with Haq (2013) when and
| 0.1 | 0.25 | 0.5 | |||||||
| 0.25 | 0.5 | 0.25 | 0.5 | 0.25 | 0.5 | ||||
| Haq | Proposed | Haq | Proposed | Haq | proposed | ||||
| 0 | 500.2 | 493.2 | 496.0 | 504.6 | 508.3 | 509.3 | 502.4 | 508.5 | 508.5 |
| 0.1 | 286.7 | 305.6 | 275.3 | 304.4 | 268.9 | 244.8 | 310.4 | 314.9 | 218.3 |
| 0.25 | 86.2 | 95.8 | 78.4 | 96.2 | 75.7 | 61.2 | 100.8 | 94.7 | 78.2 |
| 0.5 | 28.0 | 26.2 | 21.5 | 28.8 | 22.2 | 18.5 | 28.5 | 26.4 | 21.3 |
| 0.75 | 16.1 | 12.6 | 10.4 | 14.9 | 11.3 | 9.4 | 14.2 | 12.6 | 10.2 |
| 1 | 11.2 | 7.6 | 6.3 | 10.04 | 6.9 | 5.8 | 9.0 | 7.6 | 6.2 |
| 1.25 | 8.7 | 5.2 | 4.3 | 7.4 | 4.7 | 4.0 | 6.5 | 5.2 | 4.3 |
| 1.5 | 7.1 | 3.9 | 3.2 | 6.0 | 3.5 | 2.8 | 5.0 | 3.8 | 3.2 |
| 1.75 | 6.1 | 3.0 | 2.5 | 5.04 | 2.7 | 2.2 | 4.1 | 3.0 | 2.5 |
| 2 | 5.3 | 2.4 | 2.1 | 4.3 | 2.1 | 1.8 | 3.5 | 2.4 | 2.1 |
Table 2 Comparison of ARL of HEWMA chart with Riaz (2008)
| 0.1 | 0.25 | 0.5 | |||||||
| 0.25 | 0.5 | 0.25 | 0.5 | 0.25 | 0.5 | ||||
| Riaz | Proposed | Riaz | Proposed | Riaz | proposed | ||||
| 0 | 499.1 | 493.2 | 496.0 | 499.8 | 508.3 | 509.3 | 500.7 | 508.5 | 508.5 |
| 0.1 | 290.3 | 305.6 | 275.3 | 364.0 | 268.9 | 244.8 | 423.5 | 314.9 | 218.3 |
| 0.25 | 80.6 | 95.8 | 78.4 | 135.7 | 75.7 | 61.2 | 216.0 | 94.7 | 78.2 |
| 0.5 | 22.0 | 26.2 | 21.5 | 34.5 | 22.2 | 18.5 | 65.3 | 26.4 | 21.3 |
| 0.75 | 10.5 | 12.6 | 10.4 | 14.1 | 11.3 | 9.4 | 24.7 | 12.6 | 10.2 |
| 1 | 6.4 | 7.6 | 6.3 | 7.80 | 6.9 | 5.8 | 11.9 | 7.6 | 6.2 |
| 1.25 | 4.4 | 5.2 | 4.3 | 5.1 | 4.7 | 4.0 | 6.8 | 5.2 | 4.3 |
| 1.5 | 3.3 | 3.9 | 3.2 | 3.7 | 3.5 | 2.8 | 4.5 | 3.8 | 3.2 |
| 1.75 | 2.5 | 3.0 | 2.5 | 2.9 | 2.7 | 2.2 | 3.5 | 3.0 | 2.5 |
| 2 | 2.1 | 2.4 | 2.1 | 2.3 | 2.1 | 1.8 | 2.5 | 2.4 | 2.1 |
4 Real-life Application
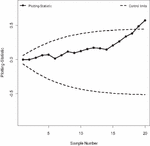
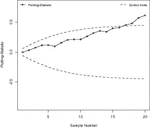
An example of the proposed control chart is presented. The proposed control chart is functional for the industry if they collect quantifiable data. The actual data from Shabbir and Awan (2016) are taken here. The qualitative characteristics are the net weight of the cooking oil, including the tin, indicated by . The weight of the empty tin is considered an auxiliary variable (W). The variables, . and are normally distributed so that and . The . and data and the corresponding HEWMA statistics of each subgroup are shown in Table 3 using and, . The control limits of HEWMA and MHEWMA are presented in Table 3 of the data set indicated. The graphical representation is shown in Figures 1–2.
Table 3 and Figure 1 described that HEWMA is not able to efficiently detect changes in the process average as it appears in the HEWMA control chart.
Table 3 Results from cooking oil data for and
| S.N | X | Wt | Mx | Mx Et | MxHEt | Lcl-MxHEt | Ucl-MxHEt | Ucl-HEt | Lcl-HEt | HEt |
| 1 | 4.89 | 22.6 | 0.000 | 0.000 | 0.000 | -0.058 | 0.058 | 0.067 | -0.067 | 0 |
| 2 | 4.889 | 22.5 | 0.610 | 0.305 | 0.031 | -0.112 | 0.112 | 0.129 | -0.129 | -0.002 |
| 3 | 4.9 | 22.6 | 0.578 | 0.442 | 0.072 | -0.163 | 0.163 | 0.189 | -0.188 | 0.0248 |
| 4 | 4.899 | 22.6 | 0.520 | 0.481 | 0.113 | -0.209 | 0.209 | 0.242 | -0.242 | 0.062 |
| 5 | 4.888 | 22.6 | -0.116 | 0.183 | 0.120 | -0.250 | 0.250 | 0.289 | -0.289 | 0.069 |
| 6 | 4.871 | 22.5 | -0.430 | -0.124 | 0.095 | -0.285 | 0.285 | 0.330 | -0.329 | 0.015 |
| 7 | 4.916 | 22.6 | 1.503 | 0.690 | 0.155 | -0.314 | 0.314 | 0.364 | -0.363 | 0.064 |
| 8 | 4.901 | 22.6 | 0.636 | 0.663 | 0.205 | -0.339 | 0.339 | 0.393 | -0.392 | 0.115 |
| 9 | 4.877 | 22.5 | -0.084 | 0.290 | 0.214 | -0.360 | 0.360 | 0.417 | -0.416 | 0.095 |
| 10 | 4.904 | 22.7 | 0.141 | 0.215 | 0.214 | -0.377 | 0.377 | 0.437 | -0.436 | 0.121 |
| 11 | 4.899 | 22.5 | 1.188 | 0.702 | 0.263 | -0.391 | 0.391 | 0.453 | -0.453 | 0.153 |
| 12 | 4.894 | 22.5 | 0.899 | 0.800 | 0.317 | -0.403 | 0.403 | 0.467 | -0.467 | 0.171 |
| 13 | 4.888 | 22.5 | 0.552 | 0.676 | 0.353 | -0.413 | 0.413 | 0.478 | -0.478 | 0.165 |
| 14 | 4.886 | 22.6 | -0.231 | 0.223 | 0.340 | -0.421 | 0.421 | 0.488 | -0.487 | 0.143 |
| 15 | 4.917 | 22.6 | 1.561 | 0.892 | 0.395 | -0.427 | 0.427 | 0.495 | -0.495 | 0.203 |
| 16 | 4.905 | 22.7 | 0.199 | 0.545 | 0.410 | -0.433 | 0.433 | 0.501 | -0.501 | 0.264 |
| 17 | 4.91 | 22.6 | 1.156 | 0.851 | 0.454 | -0.437 | 0.437 | 0.506 | -0.506 | 0.336 |
| 18 | 4.9 | 22.6 | 0.578 | 0.714 | 0.480 | -0.441 | 0.441 | 0.511 | -0.510 | 0.380 |
| 19 | 4.926 | 22.6 | 2.081 | 1.398 | 0.572 | -0.444 | 0.444 | 0.514 | -0.513 | 0.525 |
| 20 | 4.912 | 22.7 | 0.604 | 1.001 | 0.615 | -0.446 | 0.446 | 0.517 | -0.516 | 0.572 |
bold indicates out-of-control signal
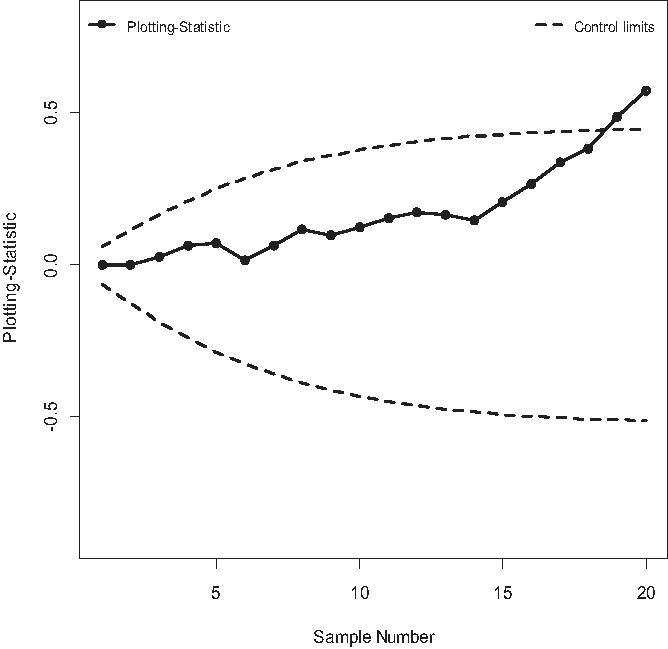
Figure 1 HEWMA control chart with

Figure 2 HEWMA control chart with
5 Conclusion
In this study, MHEWMA control chart is presented using auxiliary information in the form of a regression estimator to monitor the process mean. The proposed MHEWMA control chart is becoming more sensitive when the correlation between the study variable and the auxiliary variable increases. It is observed from the results that the out-of-control ARLs and SDRLs are smaller for the proposed control chart as compared to the considered charts. The proposed control is superior in identifying minor/moderate variations in the process average. Therefore, professionals are advised to use the MHEWMA control chart. The study can be extended using different sampling methods, such as ranked set sampling. Furthermore, the effect of measurement error can also be studied.
Appendix
The ARLs and SDRLs in Tables A1–A5 are calculated for three values of , i.e. 0.25,0.5,0.75 and taking . The values of control constant with different values of are given by
| 0.25 | 0.5 | 0.75 | |
| L | 2.548 | 2.675 | 2.76 |
Table A1 ARLS for the proposed chart with AND
| ARLs | SDRLs | ARLs | SDRLs | ARLs | SDRLs | |
| 0 | 511.2 | 525.4 | 517.7 | 521.2 | 506.8 | 513.7 |
| 0.1 | 298.9 | 303.1 | 316.7 | 318.6 | 323.3 | 321.0 |
| 0.25 | 92.6 | 85.5 | 99.5 | 94.1 | 99.6 | 92.3 |
| 0.5 | 26.4 | 21.0 | 27.9 | 22.4 | 28.2 | 22.8 |
| 0.75 | 12.6 | 8.8 | 13.2 | 9.1 | 13.3 | 9.4 |
| 1 | 7.6 | 4.9 | 7.9 | 5.0 | 8.1 | 5.1 |
| 1.25 | 5.3 | 3.3 | 5.4 | 3.3 | 5.5 | 3.3 |
| 1.5 | 3.8 | 2.3 | 4.0 | 2.3 | 4.08 | 2.3 |
| 1.75 | 3.0 | 1.7 | 3.1 | 1.7 | 3.2 | 1.7 |
| 2 | 2.4 | 1.4 | 2.5 | 1.4 | 2.6 | 1.366 |
Table A2 ARLS for the proposed chart with AND
| ARLs | SDRLs | ARLs | SDRLs | ARLs | SDRLs | |
| 0 | 508.3 | 532.0 | 508.5 | 507.4 | 505.4 | 508.6 |
| 0.1 | 268.9 | 274.6 | 314.9 | 311.0 | 320.5 | 307.9 |
| 0.25 | 75.7 | 68.9 | 94.7 | 89.7 | 98.4 | 92.2 |
| 0.5 | 22.2 | 16.8 | 26.4 | 20.6 | 26.8 | 21.3 |
| 0.75 | 11.3 | 8.0 | 12.6 | 8.6 | 12.7 | 8.9 |
| 1 | 6.9 | 4.7 | 7.6 | 4.8 | 7.67 | 4.8 |
| 1.25 | 4.7 | 3.1 | 5.2 | 3.1 | 5.26 | 3.1 |
| 1.5 | 3.5 | 2.2 | 3.8 | 2.2 | 3.9 | 2.2 |
| 1.75 | 2.7 | 1.7 | 3.0 | 1.6 | 3.0 | 1.6 |
| 2 | 2.1 | 1.3 | 2.4 | 1.3 | 2.5 | 1.3 |
Table A3 ARLS for the proposed chart with AND
| ARLs | SDRLs | ARLs | SDRLs | ARLs | SDRLs | |
| 0 | 509.3 | 524.4 | 508.5 | 517.4 | 502.7 | 501.5 |
| 0.1 | 244.8 | 251.1 | 258.3 | 278.3 | 280.5 | 279.4 |
| 0.25 | 61.2 | 54.9 | 78.2 | 73.2 | 79.2 | 73.3 |
| 0.5 | 18.5 | 13.8 | 21.3 | 16.3 | 21.4 | 16.2 |
| 0.75 | 9.4 | 6.5 | 10.2 | 6.7 | 10.4 | 6.9 |
| 1 | 5.8 | 3.9 | 6.2 | 3.8 | 6.3 | 3.9 |
| 1.25 | 4.0 | 2.6 | 4.3 | 2.5 | 4.4 | 2.5 |
| 1.5 | 2.8 | 1.8 | 3.2 | 1.8 | 3.27 | 1.8 |
| 1.75 | 2.2 | 1.3 | 2.5 | 1.3 | 2.6 | 1.3 |
| 2 | 1.8 | 1.0 | 2.0 | 1.0 | 2.0 | 1.0 |
Table A4 ARLS for the proposed chart with AND
| ARLs | SDRLs | ARLs | SDRLs | ARLs | SDRLs | |
| 0 | 509.6 | 519.0 | 506.3 | 514.1 | 499.2 | 501.1 |
| 0.1 | 174.5 | 172.6 | 209.3 | 201.9 | 213.0 | 211.9 |
| 0.25 | 38.5 | 31.9 | 47.2 | 41.7 | 48.2 | 42.0 |
| 0.5 | 11.7 | 8.2 | 13.0 | 9.0 | 13.3 | 9.2 |
| 0.75 | 5.9 | 4.0 | 6.4 | 4.0 | 6.5 | 4.0 |
| 1 | 3.6 | 2.4 | 3.9 | 2.2 | 4.0 | 2.3 |
| 1.25 | 2.5 | 1.5 | 2.8 | 1.5 | 2.84 | 1.5 |
| 1.5 | 1.8 | 1.0 | 2.1 | 1.1 | 2.16 | 1.0 |
| 1.75 | 1.5 | 0.7 | 1.7 | 0.8 | 1.7 | 0.8 |
| 2 | 1.3 | 0.5 | 1.4 | 0.6 | 1.4 | 0.6 |
Table A5 ARLS for the proposed chart with AND
| ARLs | SDRLs | ARLs | SDRLs | ARLs | SDRLs | |
| 0 | 495.0 | 501.8 | 506.2 | 518.0 | 498.6 | 513.7 |
| 0.1 | 51.9 | 45.8 | 65.6 | 5.3 | 66.1 | 60.6 |
| 0.25 | 10.7 | 7.3 | 11.7 | 7.9 | 11.9 | 8.1 |
| 0.5 | 3.3 | 2.1 | 3.6 | 2.0 | 3.67 | 2.0 |
| 0.75 | 1.7 | 0.9 | 1.9 | 0.9 | 1.93 | 0.9 |
| 1 | 1.2 | 0.4 | 1.34 | 0.5 | 1.38 | 0.5 |
| 1.25 | 1.0 | 0.2 | 1.0 | 0.2 | 1.1 | 0.3 |
| 1.5 | 1.0 | 0.08 | 1.0 | 0.13 | 1.0 | 0.1 |
| 1.75 | 1.0 | 0.02 | 1.0 | 0.03 | 1.0 | 0.04 |
| 2 | 1.0 | 0 | 1.0 | 0.01 | 1.0 | 0.01 |
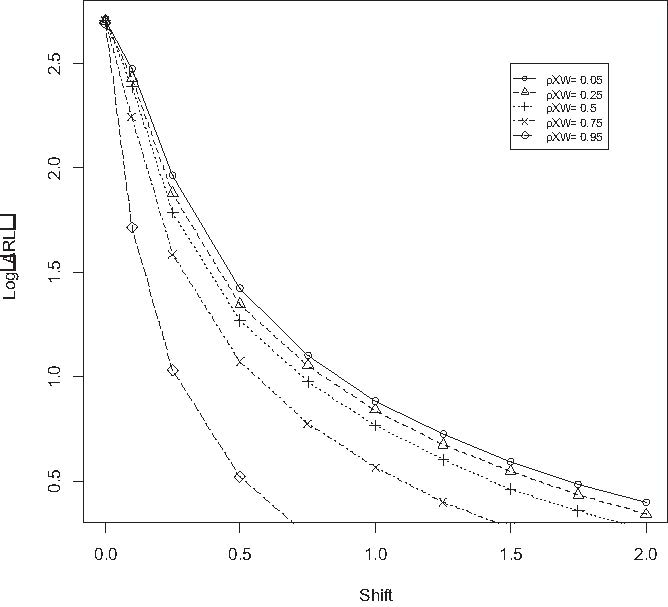
Figure A1 ARLs for various values of at

Figure A2 ARLs for various values of at

Figure A3 ARLs for various values of at
References
Abbas, N., Riaz, M., and Does, R. J. M. M. (2014). An EWMA-type control chart for monitoring the process mean using auxiliary information, Communications in Statistics-Theory and Methods, 43(16), pp. 3485–3498.
Haq, A. (2013). A new hybrid exponentially weighted moving average control chart for monitoring process mean, Quality and Reliability Engineering International, 29(7), pp. 1015–1025.
Montgomery, D. C., and Runger, G. C. (2007). Applied Statistics And Probability for Engineers, (With CD), John Wiley & Sons.
Noor-ul-Amin, M., and Hanif, M. (2012). Some exponential estimators in survey sampling, Pakistan Journal of Statistics, 28(3), pp. 367–374.
Noor-ul-Amin, M., Khan, S., and Sanaullah, A. (2019). HEWMA control chart using auxiliary information,Iranian Journal of Science and Technology, Transactions A: Science, 43(3), pp. 891–903.
Riaz, M. (2008). Monitoring process mean level using auxiliary information,Statistica Neerlandica, 62(4), pp. 458–481.
Shabbir, J., and Awan, W. H. (2016). An efficient Shewhart-type control chart to monitor moderate size shifts in the process mean in phase II, Quality and Reliability Engineering International, 32(5), pp. 1597–1619.
Yasmeen, U., Noor-ul-Amin, M., and Hanif, M. (2019). Exponential estimators of finite population variance using transformed auxiliary variables, Proceedings of the National Academy of Sciences, India Section A: Physical Sciences, 89(1), pp. 185–191.
Biographies

Sadia Tariq earned her Ph.D. student at the National College of Business Administration & Economics (NCBA&E), Lahore, Pakistan. She is currently working as an Assistant professor of Statistics at Minhaj University, Lahore. His research interests include control charting.

Muhammad Noor-ul-Amin received his Ph.D. degree from NCBA&E, Lahore, Pakistan. He has working experience in various universities for teaching and research that includes the Virtual University of Pakistan, University of Sargodha, Pakistan, and the University of Burgundy, France. He is currently working as an Assistant professor at COMSATS University Islamabad-Lahore Campus. His research interests include sampling techniques and control charting techniques. He is an HEC approved supervisor.

Muhammad Hanif completed his Master’s degree from New South Wales University, Australia in Multistage Cluster Sampling. He completed his Ph.D. in Statistics from the University of Punjab, Lahore, Pakistan. He has more than 40 years of research experience. He is an author of more than 200 research papers and 10 books. He has served as a Professor in various parts of the world i.e. Australia, Libya, Saudi Arabia, and Pakistan. He is presently a Professor of Statistics and Vice-Rector (Research) at NCBA&E, Lahore, Pakistan.

Chi-Hyuck Jun was born in Seoul, Korea in 1954. He received a BS (1977) in mineral and petroleum engineering from Seoul National University, an MS(1979) in industrial engineering from KAIST, and a PhD (1986) in operations research from the University of California, Berkeley. Since 1987, he has been with the department of industrial and management engineering, POSTECH; and he is now a professor and the department head. He is interested in reliability and quality analysis and data mining techniques. He is a member of IEEE, INFORMS, and ASQ.
Journal of Reliability and Statistical Studies, Vol. 13_1, 113–126.
doi: 10.13052/jrss0974-8024.1316
© 2020 River Publishers