Linear Consecutive-k-out-of-n: G System Reliability Analysis
Garima Chopra1,* and Mangey Ram2, 3
1Department of Mathematics, University Institute of Engineering & Technology, Maharshi Dayanand University, Rohtak, Haryana, India
2Department of Mathematics, Computer Science & Engineering, Graphic Era Deemed to be University, Dehradun, Uttarakhand, India
3Institute of Advanced Manufacturing Technologies, Peter the Great St. Petersburg Polytechnic University, Saint Petersburg 195251, Russia
E-mail: garima.chopra@gmail.com
*Corresponding Author
Received 31 August 2022; Accepted 26 January 2023; Publication 10 February 2023
Abstract
The concerned study pertains to the development of a new stochastic model for the reliability analysis of linear consecutive-k-out-of-n: G system, where . In the developed model, system may collapse as a result of common cause failure or hardware failure in its units. The system has exponentially distributed failure rates, and in case of breakdown, it is repaired with the copula method. The developed model has been examined through supplementary variable technique (SVT) along with Laplace transform. The current paper has specifically studied consecutive-(n-1)-out-of-n: G system. The performance of such system having ten components is explored and its various reliability measures have been obtained and discussed with the help of graphs. The originality of this work lies in incorporating common cause failure in conjunction with copula repair in the reliability modeling of consecutive systems through the SVT. The study confirms that an increase in failure rates and the number of components of the concerned system decreases mean time to failure (MTTF). The profit of linear consecutive-9-out-of-10: G system is examined with the help of a numerical example.
Keywords: Consecutive-k-out-of-n: G system, SVT, common cause failure, copula, reliability measures.
1 Introduction
The reliability of deployed systems and manufactured goods in factories is of profound importance, as it directly affects the consumer’s choice and the organization’s business. The users’ and environmental safety are two serious issues closely linked to system reliability. Any breach in critical systems like nuclear power plant systems, aircraft systems, chemical manufacturing plant systems, medical devices, and weapon systems may be menacing and lead to massive loss. In their study, Kumar et al. (2018) listed some catastrophic accidents that occurred during 2006–2016. They have also mentioned the reasons for accidents, along with levels of their severity and losses in terms of life and property.
Hence, it has become quintessential to have safe systems capable of producing efficient and long-running quality products. The ever-increasing and necessary use of emerging technologies such as robotics, nanotechnology, 3D printing, artificial intelligence, etc., strongly impact today’s manufacturing process. In modern industries, highly intricate systems are being employed for advanced manufacturing. Effective system design, proper maintenance, and repair schemes ensure system reliability and company profitability.
SVT was first used by Cox (1955) in investigating the non-markovian system. Several researchers have applied this method for evaluating metrics like availability, reliability, and MTTF. In this technique, the non-markovian process is changed to markovian by adding some supplementary variables as elapsed repair time. As far as the system structure is concerned, most critical systems are based on k-out-of-n redundancy. A k-out-of-n: G/F system is in a working/failed state provided its not less than k units among n are working/failed. If and n, a k-out-of-n: G system reduces to parallel and series systems, respectively.
Linton and Saw (1974), Gupta and Goyal (1992), Singh and Dayal (1991), Mishra and Jain (2013), Wu et al. (2014), Ram and Kumar (2014, 2015), Singh and Poonia (2022), Poonia (2022) and Singh et al. (2022) have used SVT to develop stochastic models to evaluate the reliability of k-out-of-n: G/F systems. These studies have addressed various situations, such as different types of failures (common cause, human, partial, catastrophic), repairs and maintenance strategies. Linton and Saw (1974) applied the SVT approach to k-out-of-n: F systems (; ) and evaluated Laplace transform of the time to system failure distributions. Gupta and Goyal (1992) studied the profit function of the k-out-of-n trichotomous system by assuming failure and repair times to be exponentially and general distributed, respectively. Singh and Dayal (1991) investigated the effect of common cause failure, critical human errors, and r repair facilities on the performance of 1-out-of-n: G system. Mishra and Jain (2013) considered imperfect repair, shut-off rule, and arbitrary distributed failure and repair time in their model and analyzed a system consisting of a major unit (k-out-of-n: F) and a minor unit. Wu et al. (2014) incorporated the concept of a single vacation into their study. Ram and Kumar (2014) inspected the reliability measures of the complex series system comprising of sub-unit A (2-out-of-3: F) and sub-unit B in the presence of human failure. Ram and Kumar (2015) also investigated a hybrid system involving 1-out-of-2: G subsystem with flawless reworking strategy. Goyal et al. (2017) examined sensitivity of the reliability metrics of a complicated system possessing of three subsystems linked in series for k-out-of-n redundancy.
A literature survey reveals that the consecutive-k-out-of-n systems have drawn the attention of many researchers. Linear consecutive-k-out-of-n: G/F systems have linearly arranged n units, and these systems are in a working/ failed state, provided that not less than its k consecutive units among n are working/failed. These systems have wide uses in telecommunication systems, oil pipeline systems, water supply systems, the series-parallel systems in the electrical circuit designs, parking system as well as in the spacecraft relay stations.
Kontoleon (1980) determined the reliability of an r-successive-out-of-n: F system. A tropological formula was derived by Kossow and Preuss (1989) to assess reliability concerning linear as well as circular consecutive-k-out-of-n: F systems, wherein units had different reliabilities. Zhang and Wang (1996) specifically studied these systems for . Zhang and Lam (1998) derived the state transition probabilities of the consecutive-k-out-of-n: G system, where using generalized transition probability. They assumed that the working as well as repair times are exponentially distributed and obtained expressions for system reliability and MTTF. Cheng and Zhang (2001) extended this work to study consecutive-k-out-of-n: F system by considering key component, whose repair has been given the highest priority. They evaluated state transition probabilities and important reliability measures using a generalized transition probability definition. Krishnan and Somasundaram (2011) assessed the performance metrics of consecutive-k-out-of-n: G system having sensor and r repair persons. They used the Laplace transform and concluded that a use of sensor improves the system performance. Yuan and Cui (2013) inspected reliability indexes of the consecutive-k-out-of-n: F system attended by r repair persons who are allowed to take multiple vacations. The authors specifically investigated the performance of consecutive-3-out-of-8: F system handled by a single repairman who can take many rests through the Runge-Kutta method. Zhou et al. (2020) focused on the optimization problem for a consecutive-2-out-of-n: G system. Through minimizing expected costs rates, authors have obtained ideal number of components as well as ideal replacement time. Kuo et al. (1990), Zhang et al. (2000), Yam et al. (2003), Guan and Wu (2006), Özbey and Gökdere (2021), Gökdere and Tony (2022), Wu et al. (2022) and Wang et al. (2022) also investigated consecutive-k-out-of-n: F/G systems in their studies.
Many researchers, including Ram and Singh (2010), Rawal et al. (2015), Chopra and Ram (2019), Yusuf et al. (2021), Rawal et al. (2022), and Sanusi et al. (2022) have applied the copula approach in their models. Poonia (2021) studied the performance of a multi-state computer network system incorporating copula modeling. Recently, Singh et al. (2022) used copula in the stochastic modeling of complex repairable k-out-of-n: G system with controllers. Copula repair, employed in many reliability models, has emerged as an effective approach for better performance of the systems. However, this approach has not yet been applied in the study of reliability of linear consecutive-k-out-of-n: F/G systems.
Common cause failure occurs when multiple system components stop working due to a single shared cause. These failures are relevant in the study of redundant systems, as their excessive presence impedes the benefits of redundant configured systems. The current study has been carried out to develop a stochastic model concerning linear consecutive-k-out-of-n: G system for via SVT, wherein all n units are independent, and their failure times are distributed exponentially. A specific case of consecutive-(n-1)-out-of-n: G system has been worked out, considering common cause failure and copula repair. Gumbel-Hougaard copula is used to model two types of repair rates between failed and good states. The contribution of this work lies in the fact that no such reliability model has been worked out earlier by incorporating common cause failure and copula repair for the considered redundant system using the SVT technique.
2 Notations, Model Description and Assumptions
All notations employed in this model are described as follows:
| t/s | Time/Laplace transform variable |
| Symbol for Laplace Transform | |
| Each unit/Common cause failure rate | |
| Number of cases in state , where | |
| Degradation rate from the state to | |
| Degradation rate from the state to , where | |
| Failure rate from the state to | |
| Failure rate from the state to , where | |
| Each unit Repair rate | |
| Repair rate for the state , for | |
| Joint Pdf as per Gumbel-Hougaard copula for repair rate of the state , and | |
| Probability that at any time system is in state and | |
| Probability that at any moment system is in the failed state and elapsed repair time is , where | |
| Laplace Transform of , for | |
| Laplace transform of , where and | |
| Expected system profit in the interval |
The developed reliability model for linear consecutive-k-out-of-n: G system ( has total states, among which the number of good, degraded, and failed states are 1, and respectively. These states are explained in Table 1 and shown in the transition state diagram in Figure 1. In state (, number of consecutively functioning units in the system is less than k, and hence the system is in a failed state.
Referring to states, ), as discussed by Krishnan and Somasundaram (2011), there are cases, which are given by:
where, and stands for the greatest integer .
Table 1 Various states of the system
| Good state as all n units are functioning | |
| ) | Degraded working state as l ) units are non-operational, but at least k consecutive units are operational |
| ( | Failed state as l ( units are non-operational and the number of consecutively functioning units is less than k |
| Failed state owing to common cause failure |
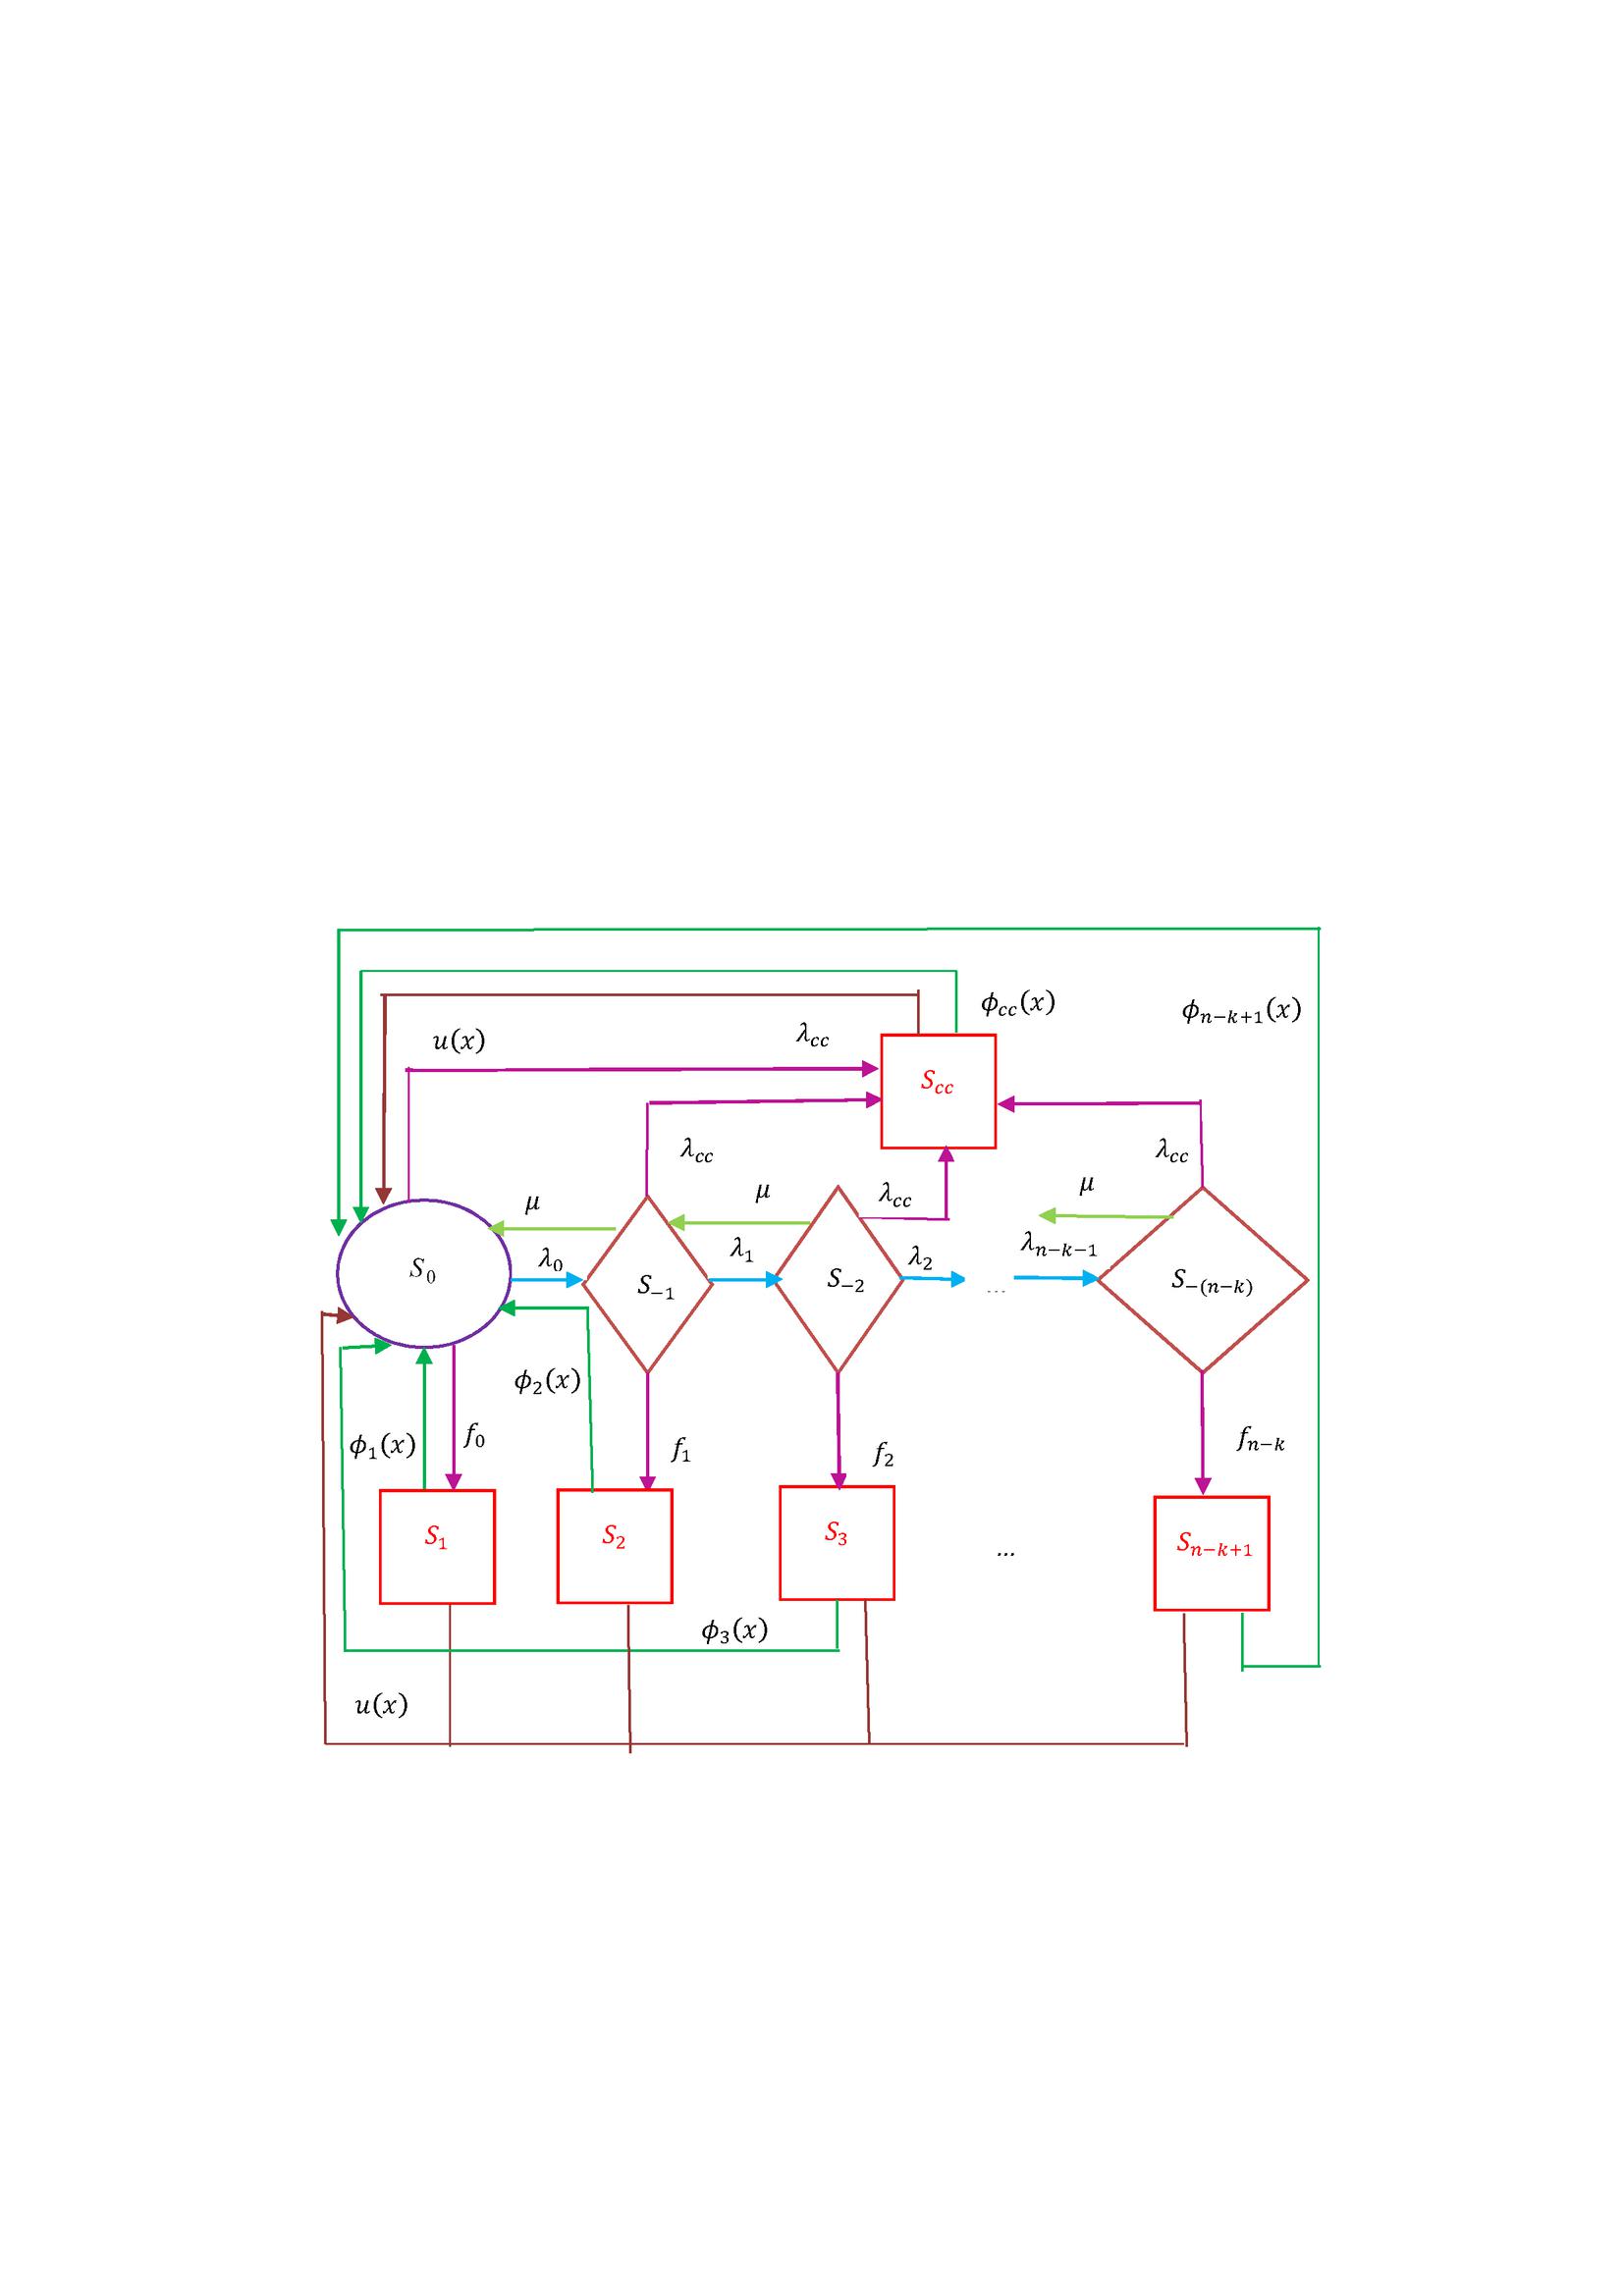
Figure 1 Transition state diagram for linear consecutive-k-out-of-n: G system.
Further, the degradation rate, ) is expressed as
For , we have .
The rate of failure of the system, ) when units are failed is:
For we have .
The postulations for developing the model are stated as under:
1. The system gets collapses if the consecutive working units in the system are less than k.
2. Common cause failure also led to system breakdown.
3. All failures in the system are independent and follow exponential distribution.
4. The rate of repair of each unit is constant and follows exponential distribution.
5. In case of complete failure, the system is repaired by copula method. Gumbel-Hougaard copula is employed to manage two types of repair rates between failed and good states.
6. A repair facility is always available with the system.
7. The repaired system is the same as the new one.
3 Mathematical Analysis of the Model
The mathematical model for linearly ordered consecutive-k-out-of-n: G system with involves following differential equations.
| (1) | |
| (2) |
For all, , we have
| (3) |
Corresponding to collapsed states, ( and , we have
| (4) |
and
| (5) |
Initially, system is in a proper working condition means its state is good, hence
and
The current system is subjected to the following boundary conditions
and
Taking Laplace transform of Equation (2), we get
Similarly, from Equation (3), we obtain
| (6) |
Solving Equation (4), we have
and
| (7) |
Using Equation (6) in Equation (7), , we get,
The Laplace transform of Equation (5) gives
4 Specific Case of Linear Consecutive-(n-1)-out-of-n: G System
The model of consecutive-(n-1)-out-of-n: G system, as shown in the transition state diagram in Figure 2, has five states. All the assumptions in this model are the same as discussed in Section 2.
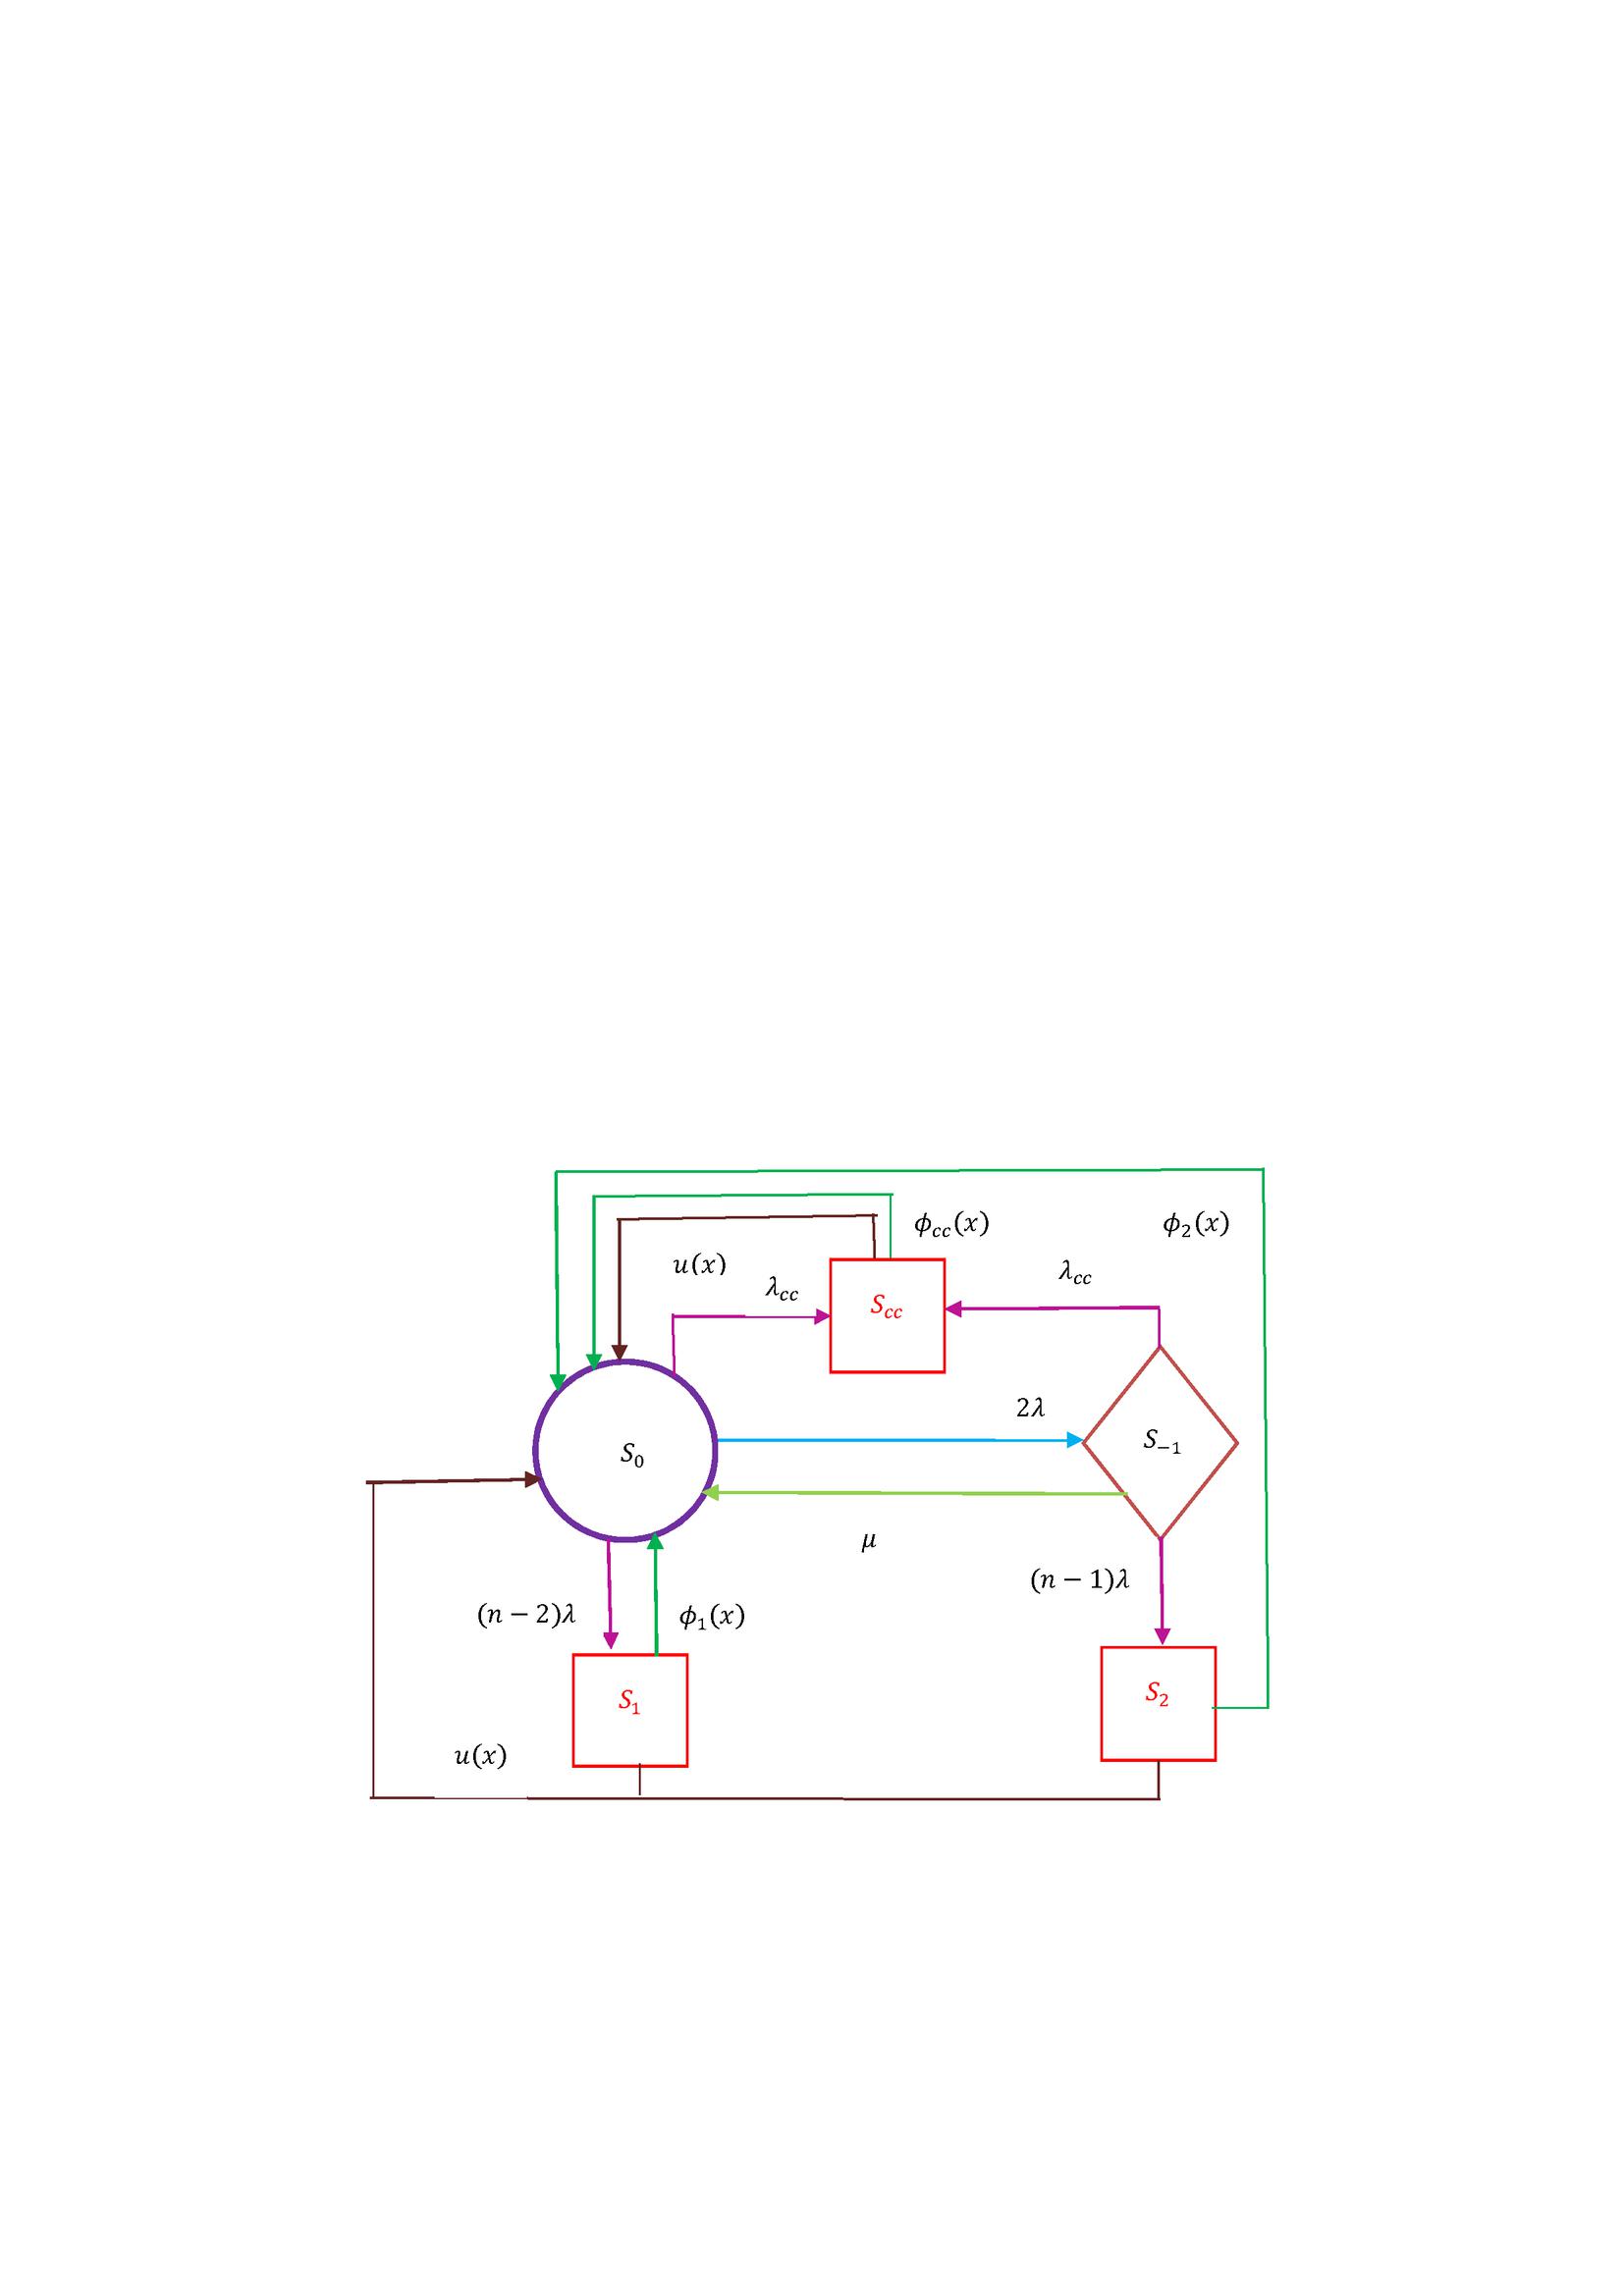
Figure 2 Transition state diagram for consecutive-(n-1)-out-of-n: G system.
For this special case, Equation (1) reduces to
There are two cases in the state and degradation rate, from state to is . The failures rates for states and are and , respectively. Thus, Equation (2) reduces to
| (8) |
Corresponding to the failed states, , and , we have
| (9) | |
| (10) |
and
| (11) |
The initial, as well as the boundary conditions to govern the system are given as under:
and
Solving Equations (8)–(11), we get
| (12) | ||
| (13) | ||
and
where,
The Laplace transform of the probability of the system being in upstate is given by –
| (15) |
In numerical calculation, for and we have assumed , and consequently, we get, . Further, considering and using Equations (12)–(15), the obtained expression for is as under-
| (16) |
where,
For failure rates, and , we have attained the following expressions for the availability as well as reliability of the linear consecutive-9-out-of-10: G system-
| (17) |
and
| (18) |
The above-mentioned Equation (4) has been obtained using Equation (16) and the inverse Laplace Transform tool. The Equation (4) has been attained by the inverse Laplace transform of Equation (15), wherein all repair rates are assumed to be zero and it is the system reliability. The limiting behaviour of (Equation (16)), with nil repair rates as s tends to zero results in Equation (19) of system MTTF.
| (19) |
The primary objective of any industry is to earn a reasonable profit with time. Reliable systems are less prone to failure, so their operation involves less repair cost. Thus, the system earned profit can be improved by boosting its reliability. The system expected profit is evaluated with the help of the below-mentioned formula:
where, and are revenue and service cost per unit time, respectively.
Using the above basic formula, corresponding to parameters , and revenue cost as 1, the under mentioned expression is obtained for the expected profit of consecutive-9-out-of-10: G system:
5 Result and Discussion
The availability of the linear consecutive-9-out-of-10: G system given in Table 2 initially declines sharply, and after a certain moment (, it attains a constant value of 0.6575314333. The reliability of the system also reduces with the lapse of time.
Table 2 Availability and reliability of system
| Time | Availability | Reliability |
| 0 | 1.0000000000 | 1.0000000000 |
| 1 | 0.6632423026 | 0.2418124236 |
| 2 | 0.6576239566 | 0.0567251348 |
| 3 | 0.6575327793 | 0.0130264573 |
| 4 | 0.6575314440 | 0.0029450861 |
| 5 | 0.6575314328 | 0.0006580167 |
| 6 | 0.6575314332 | 0.0001456781 |
| 7 | 0.6575314332 | 0.0000320188 |
| 8 | 0.6575314333 | 0.0000069967 |
| 9 | 0.6575314333 | 0.0000015217 |
| 10 | 0.6575314333 | 0.0000003297 |
The early decrease in reliability is steep, whereas, after , it decreases gradually. Due to corrective maintenance, at any moment t system availability consistently exceeds its reliability. These two metrics have been investigated in depth by varying rate of common cause failure and the number of components.
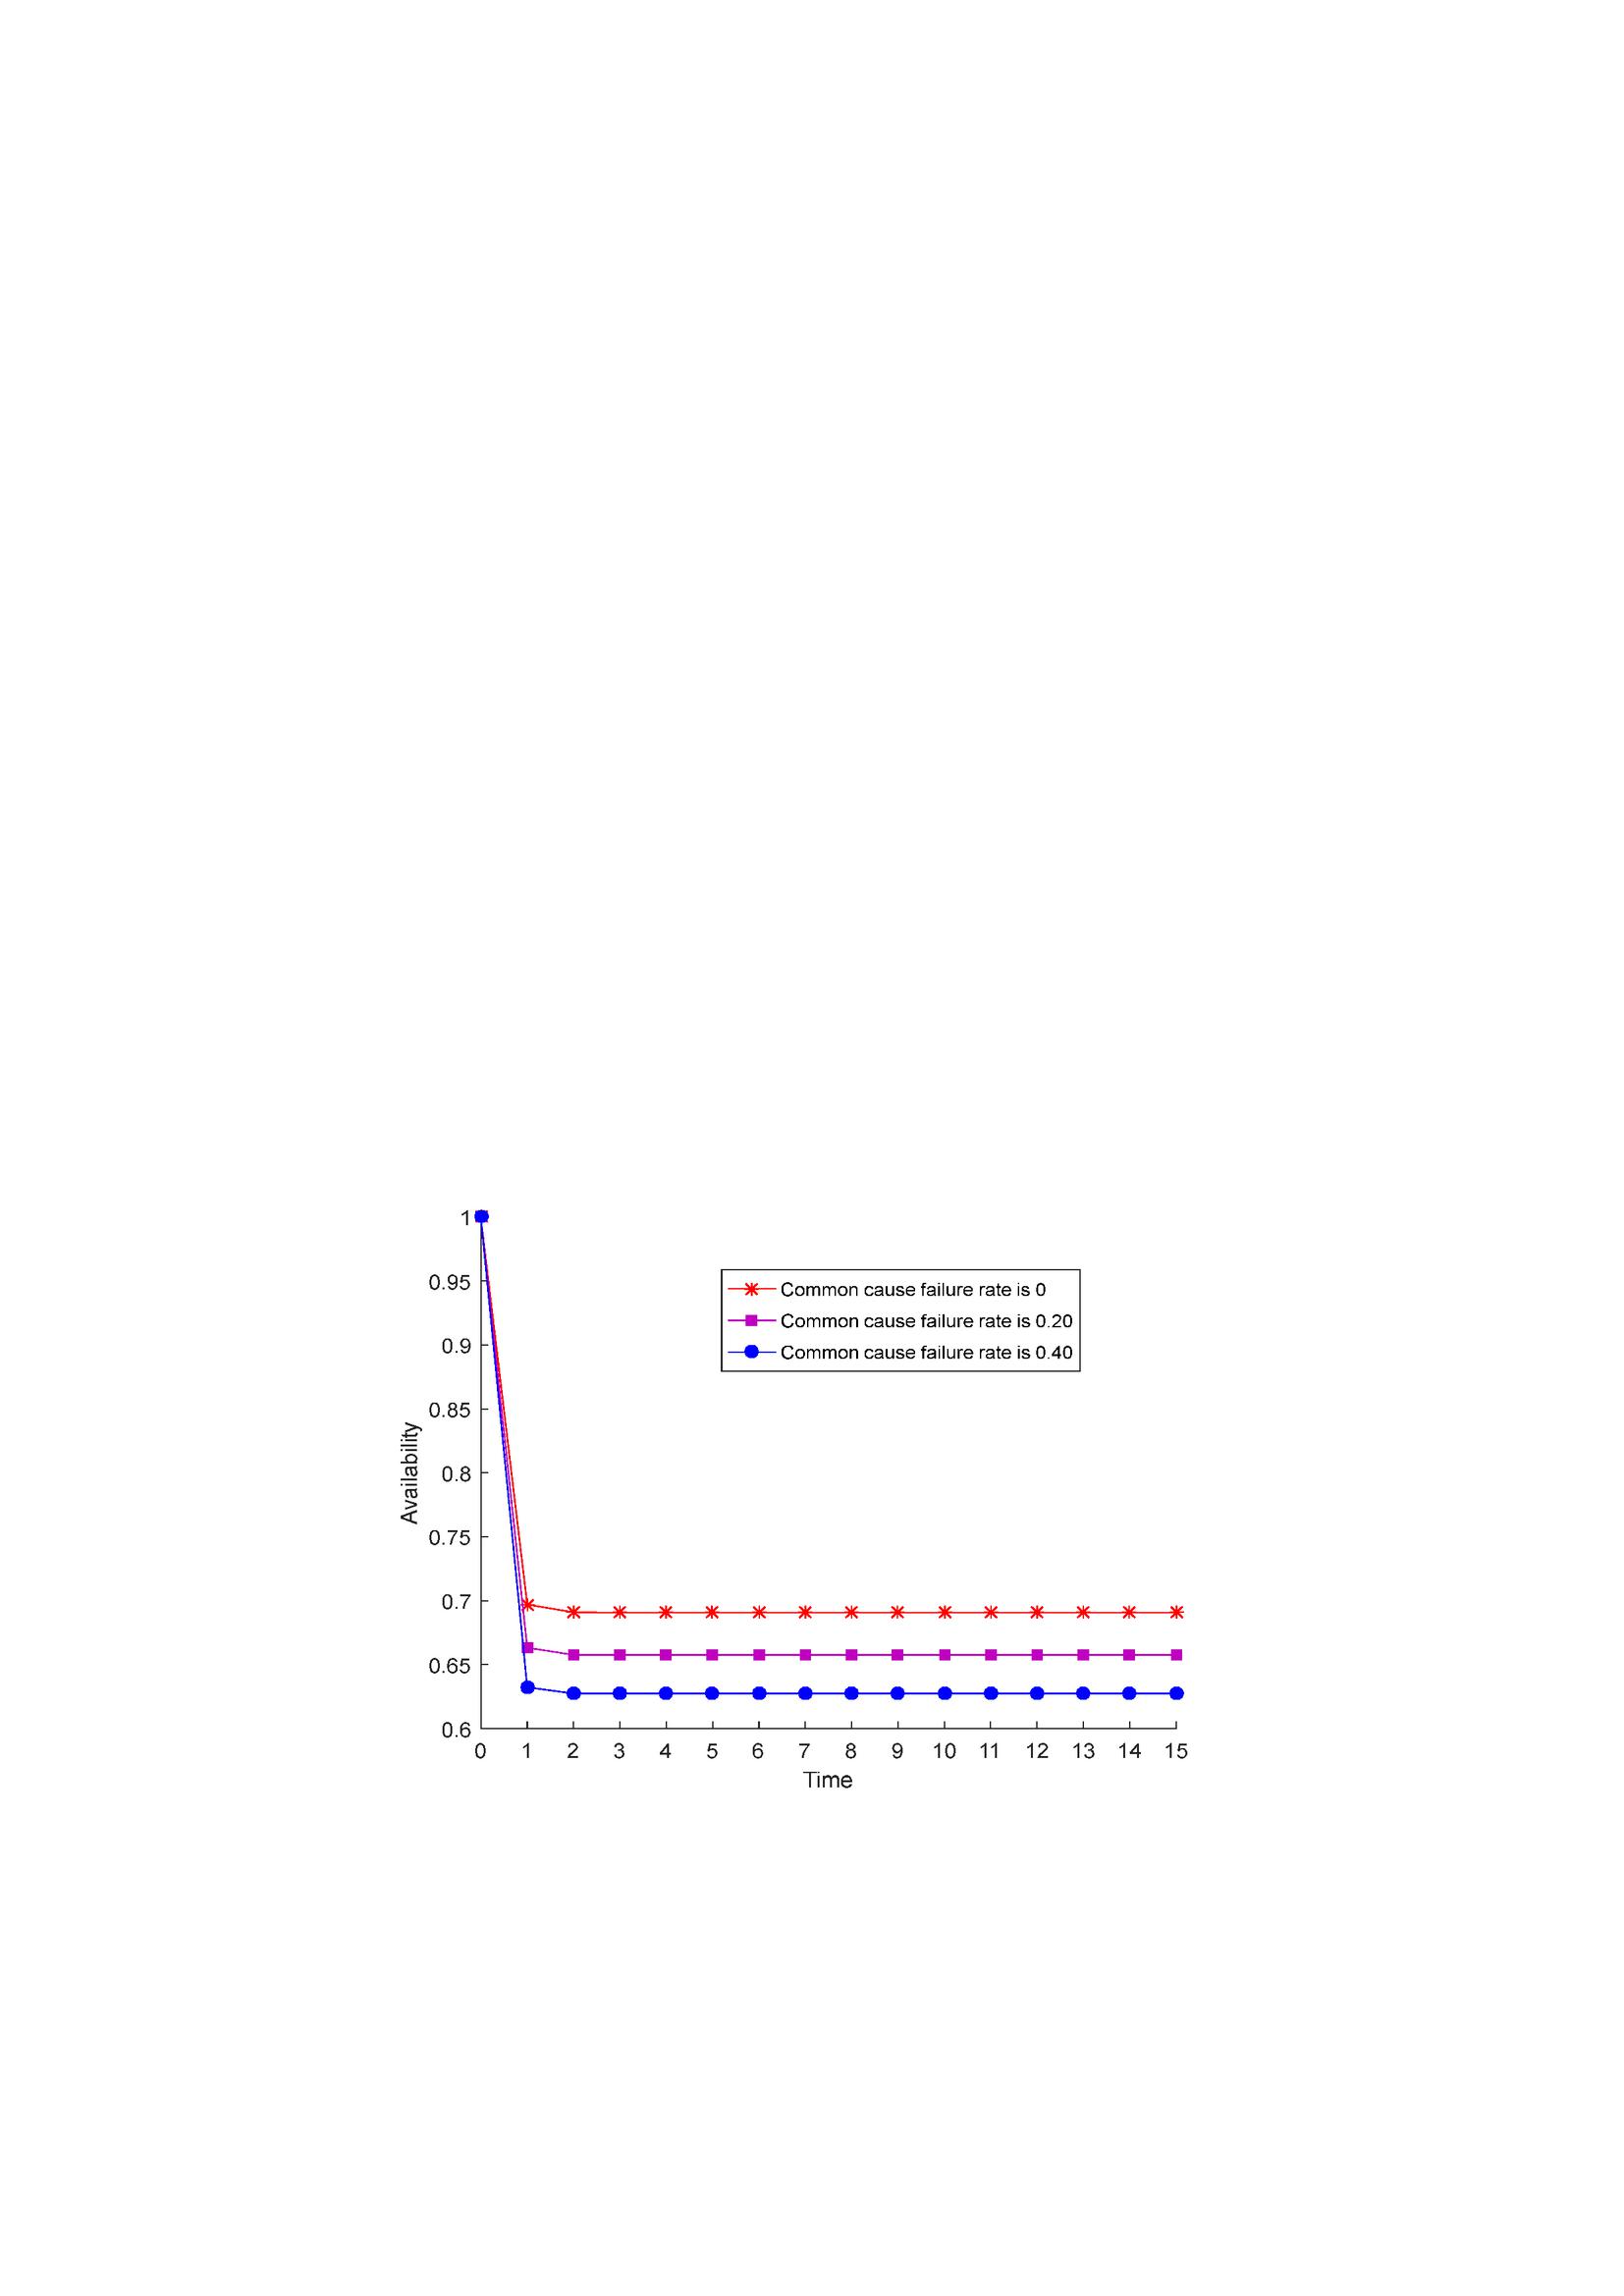
Figure 3 Influence of common cause failure on system availability.
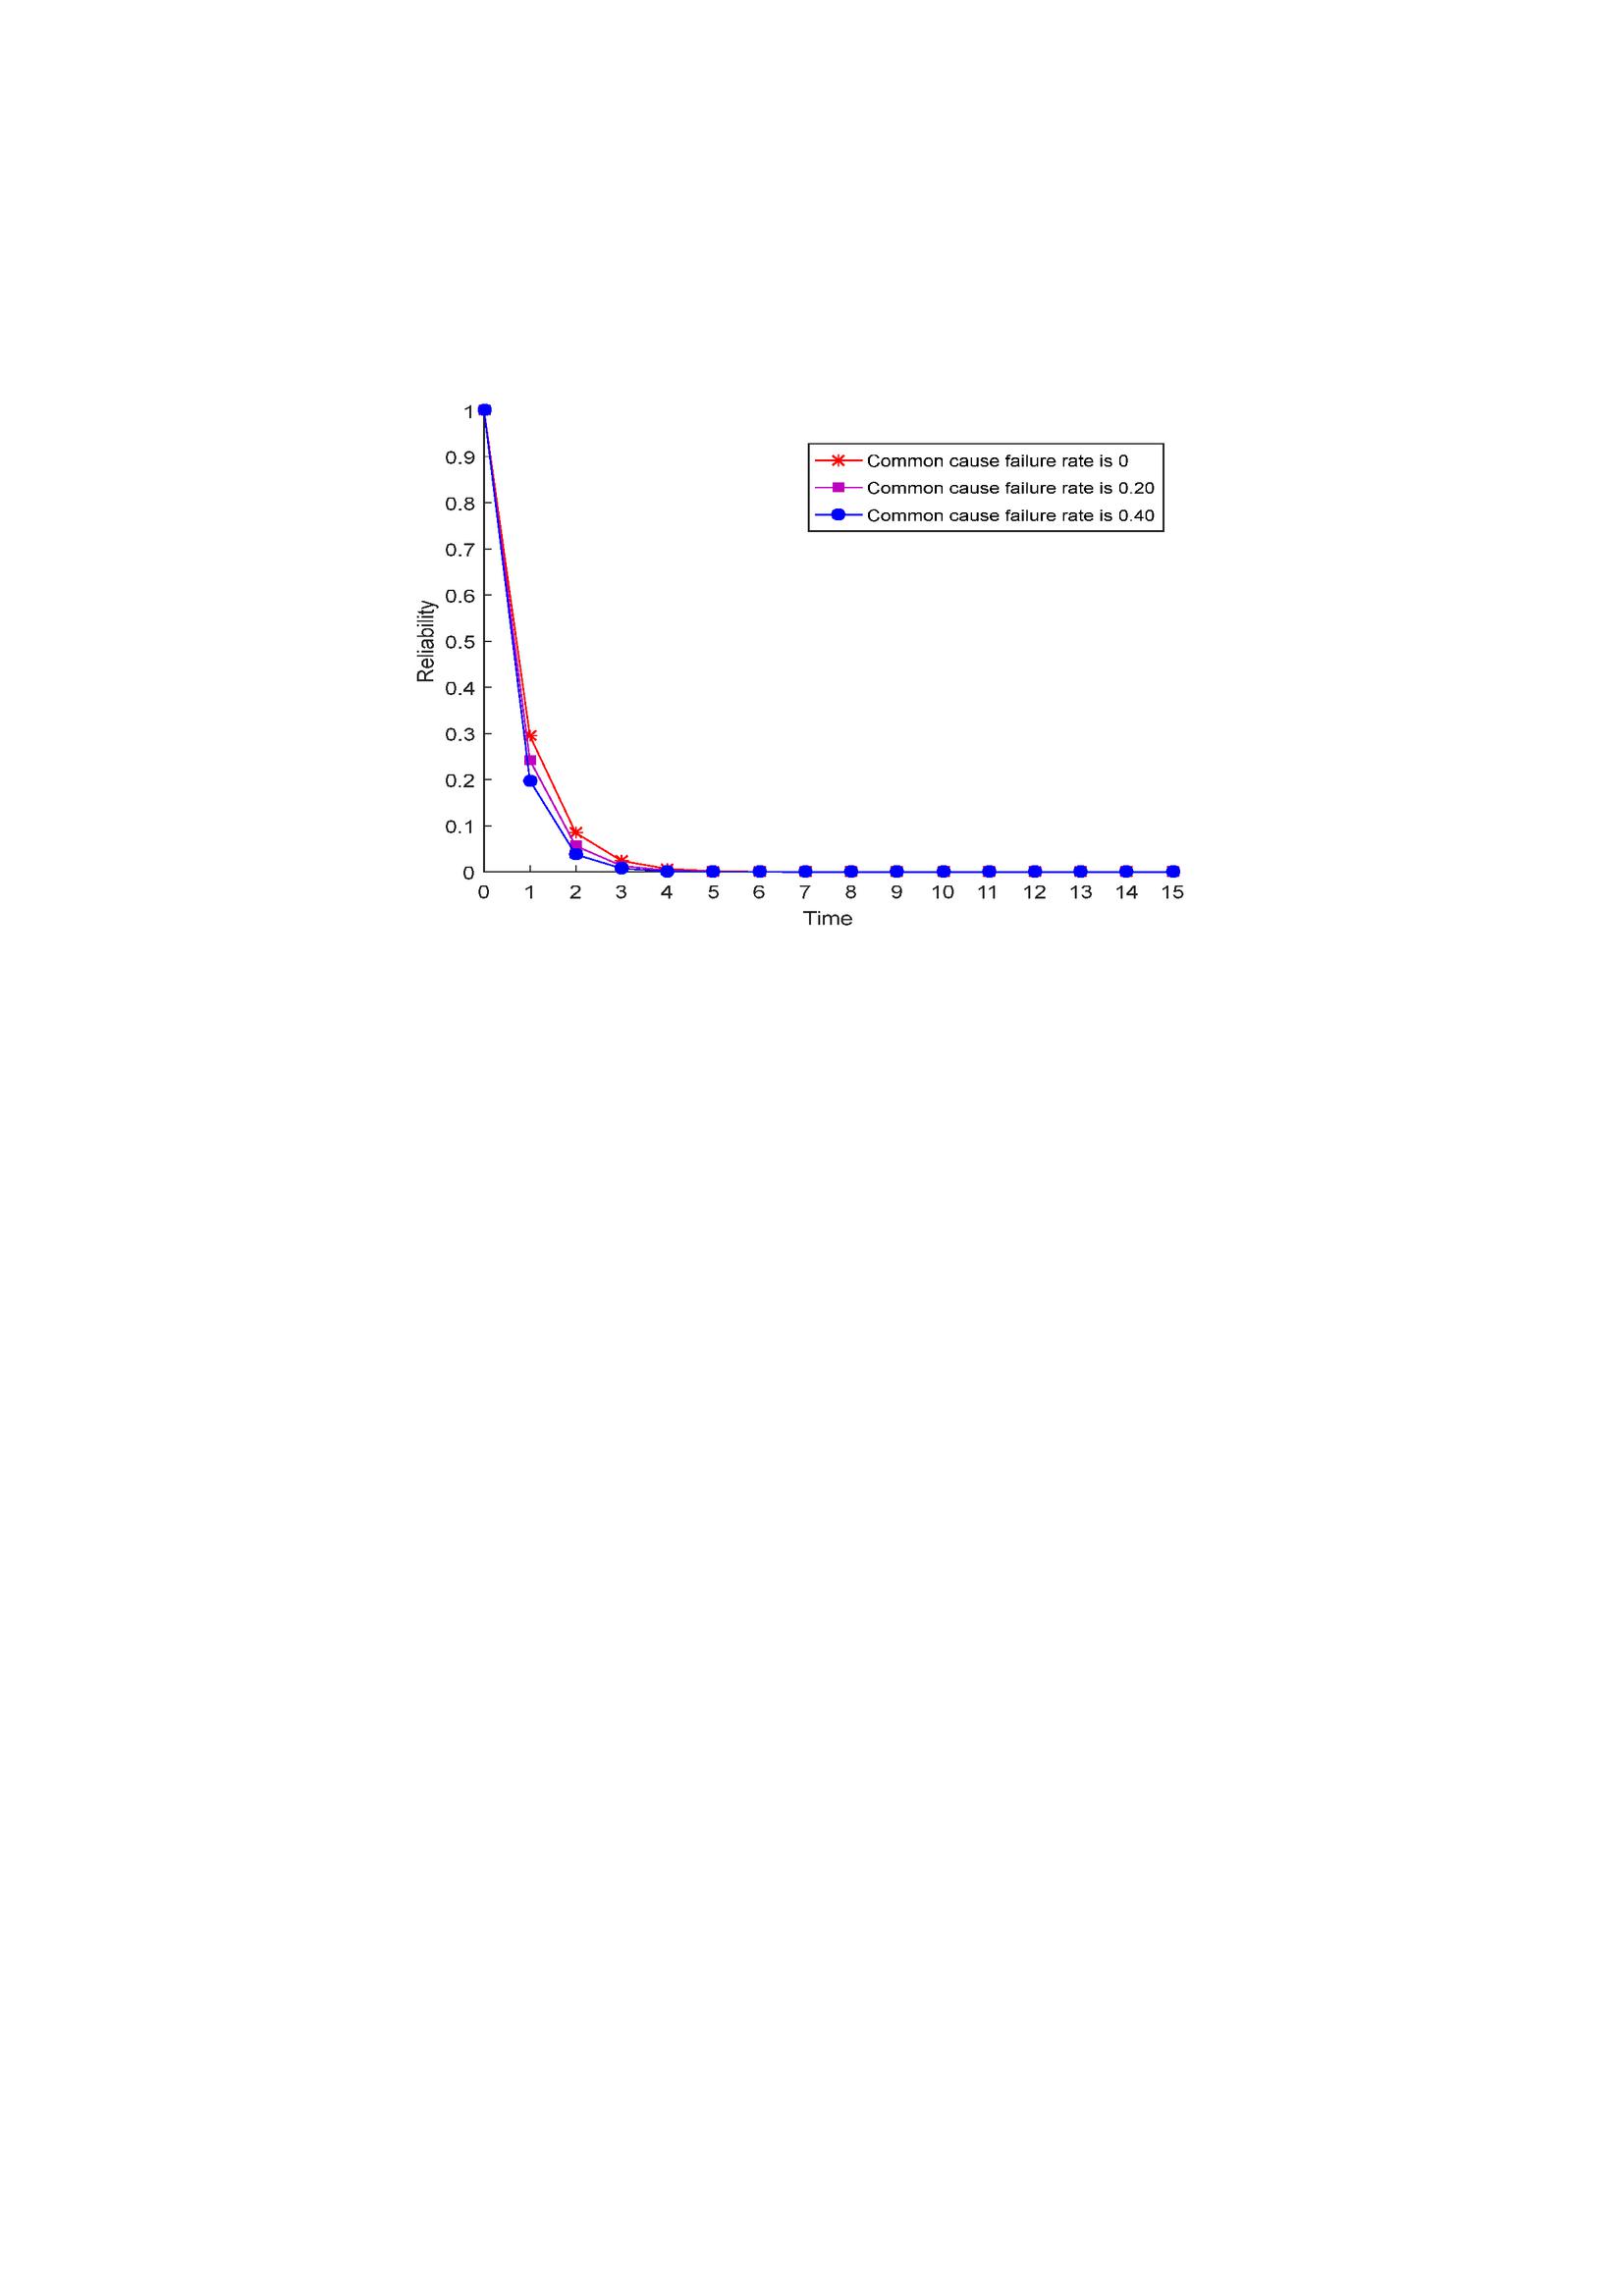
Figure 4 Influence of common cause failure on system reliability.
Figures 3 and 4 reveal that at any instant, t and for , both the availability as well as reliability attained the highest levels concerning linear consecutive-9-out-of-10: G system. These figures further depict that the increased common cause failure has led to reduced system availability and reliability.
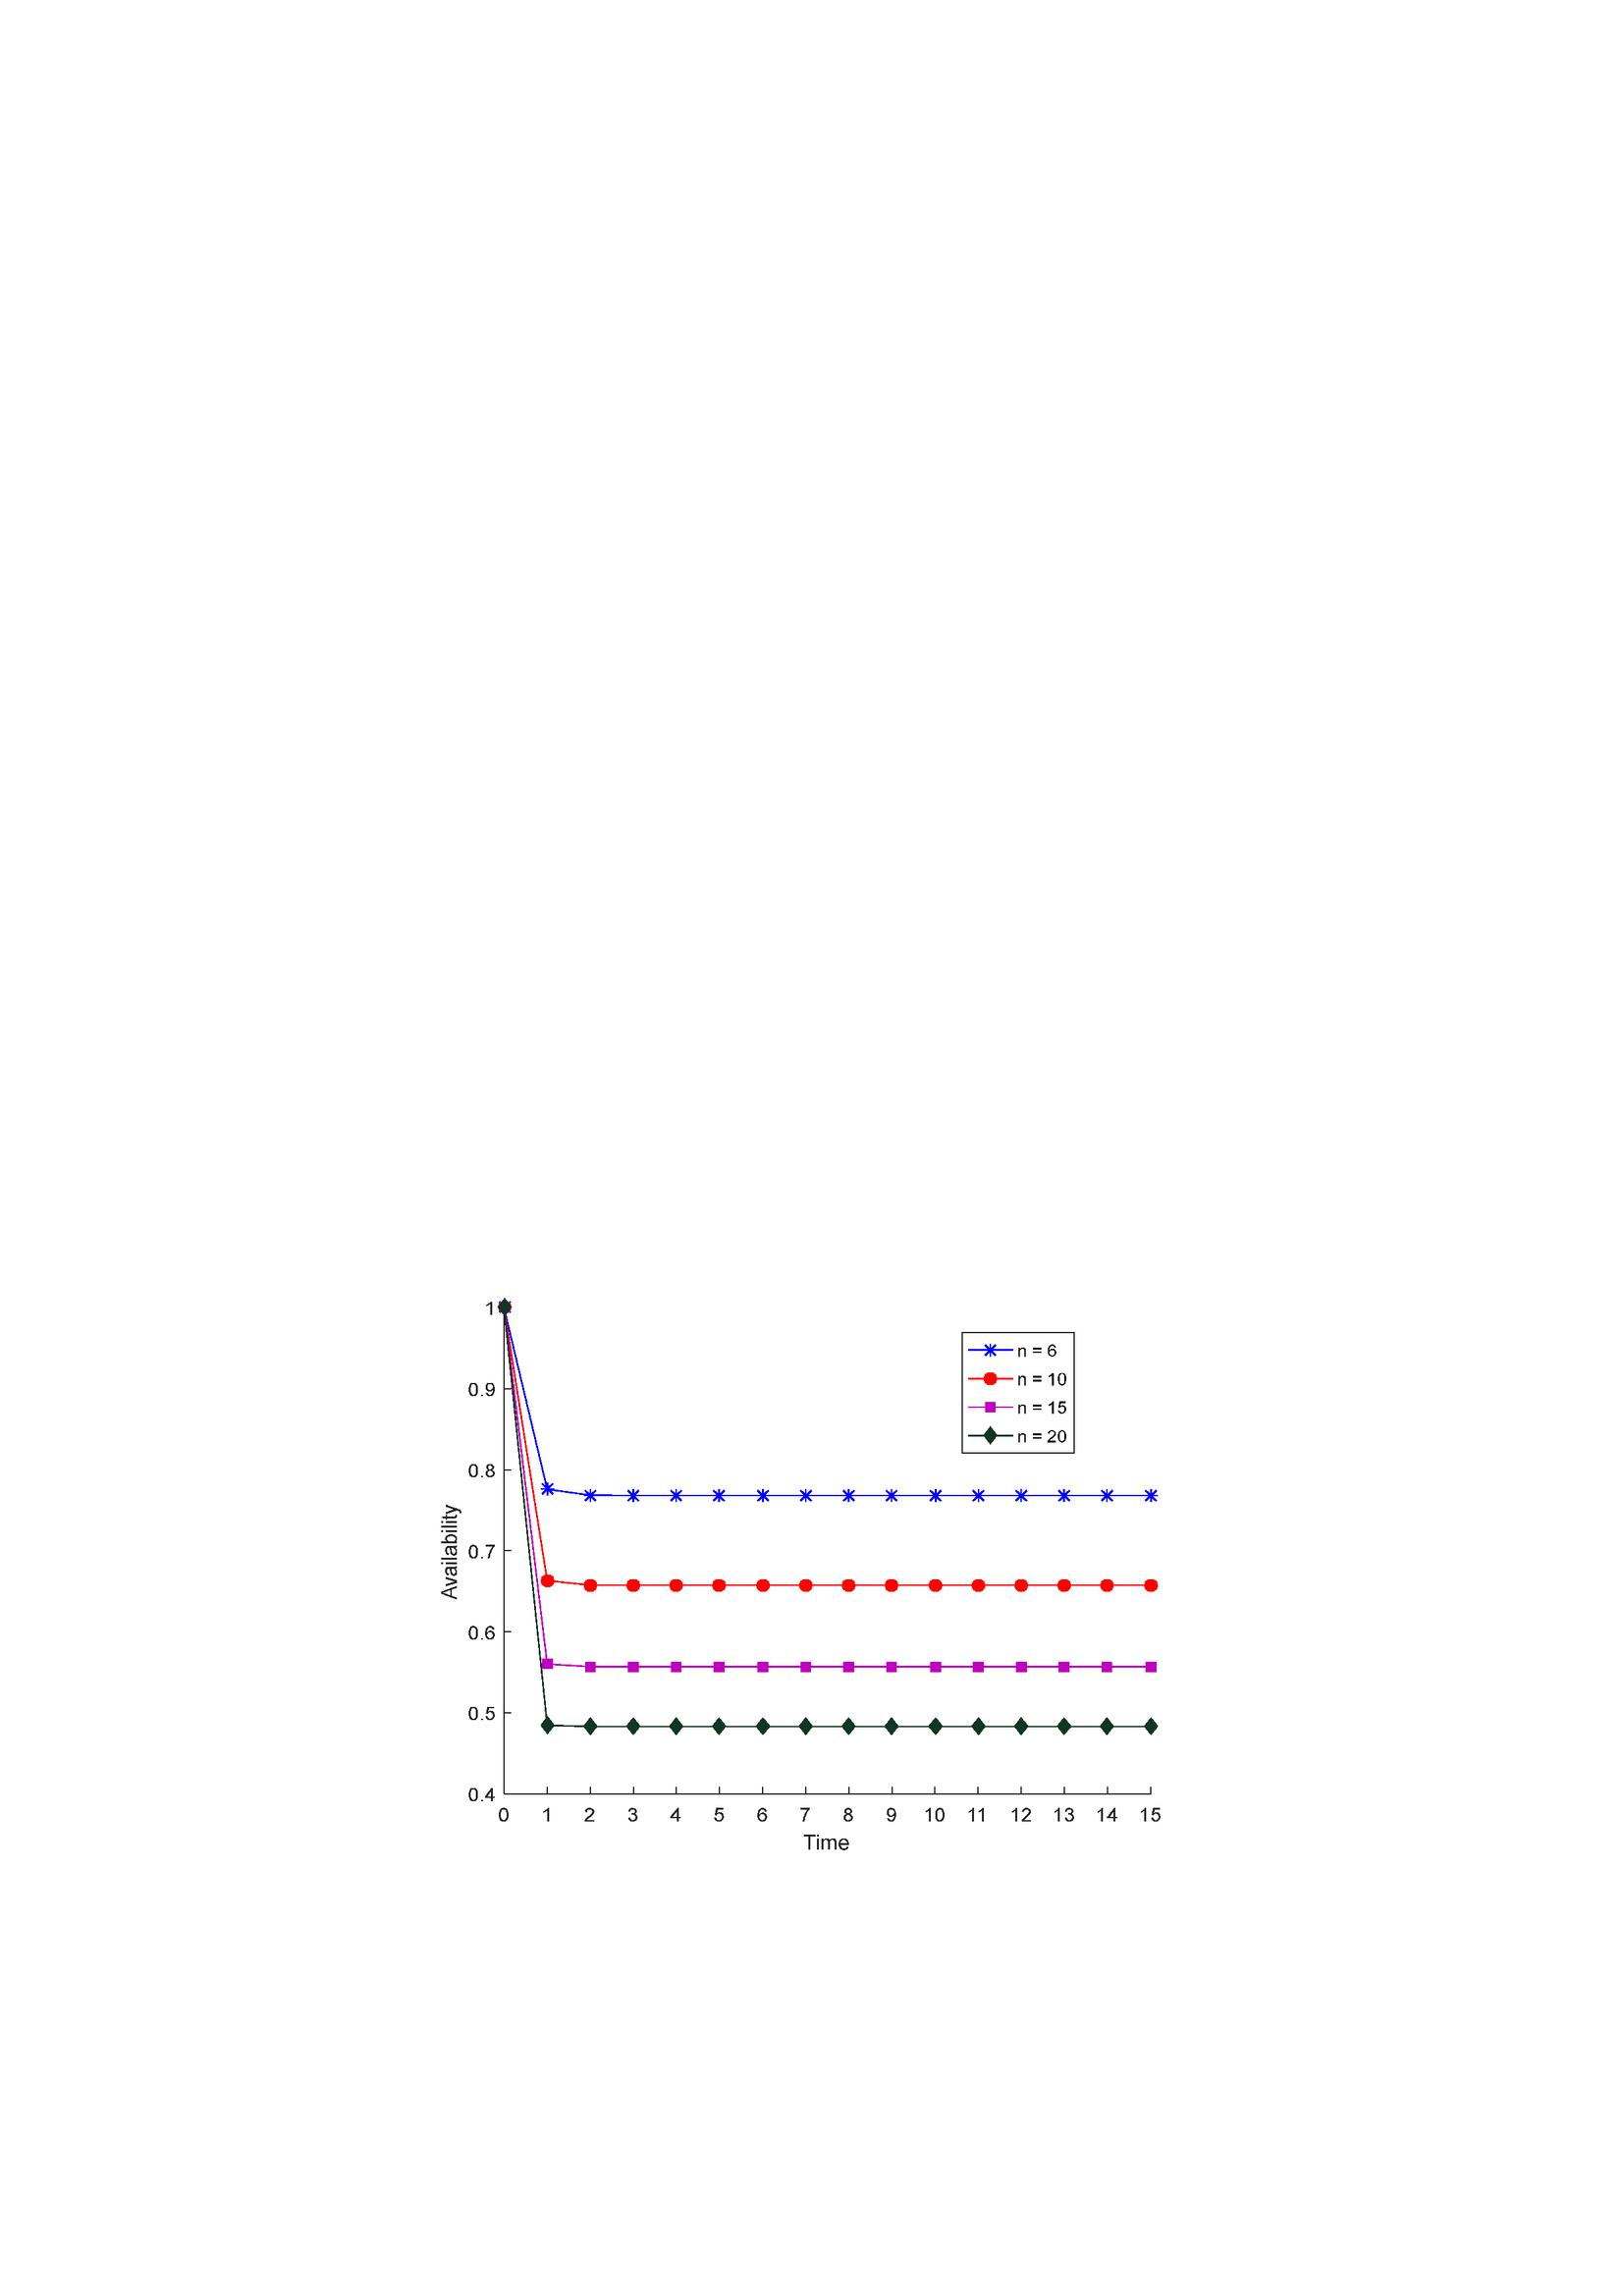
Figure 5 Effect of n on availability of the system.

Figure 6 Effect of n on reliability of the system.
The availability and the reliability of system are influenced by the value of n and that is shown in Figures 5 and 6. It is obvious that the performance of system is improved with decreasing the value of n. The observed differences in system availabilities and reliabilities at are 0.2910 and 0.3866, respectively, when n is varied from 6 to 20.
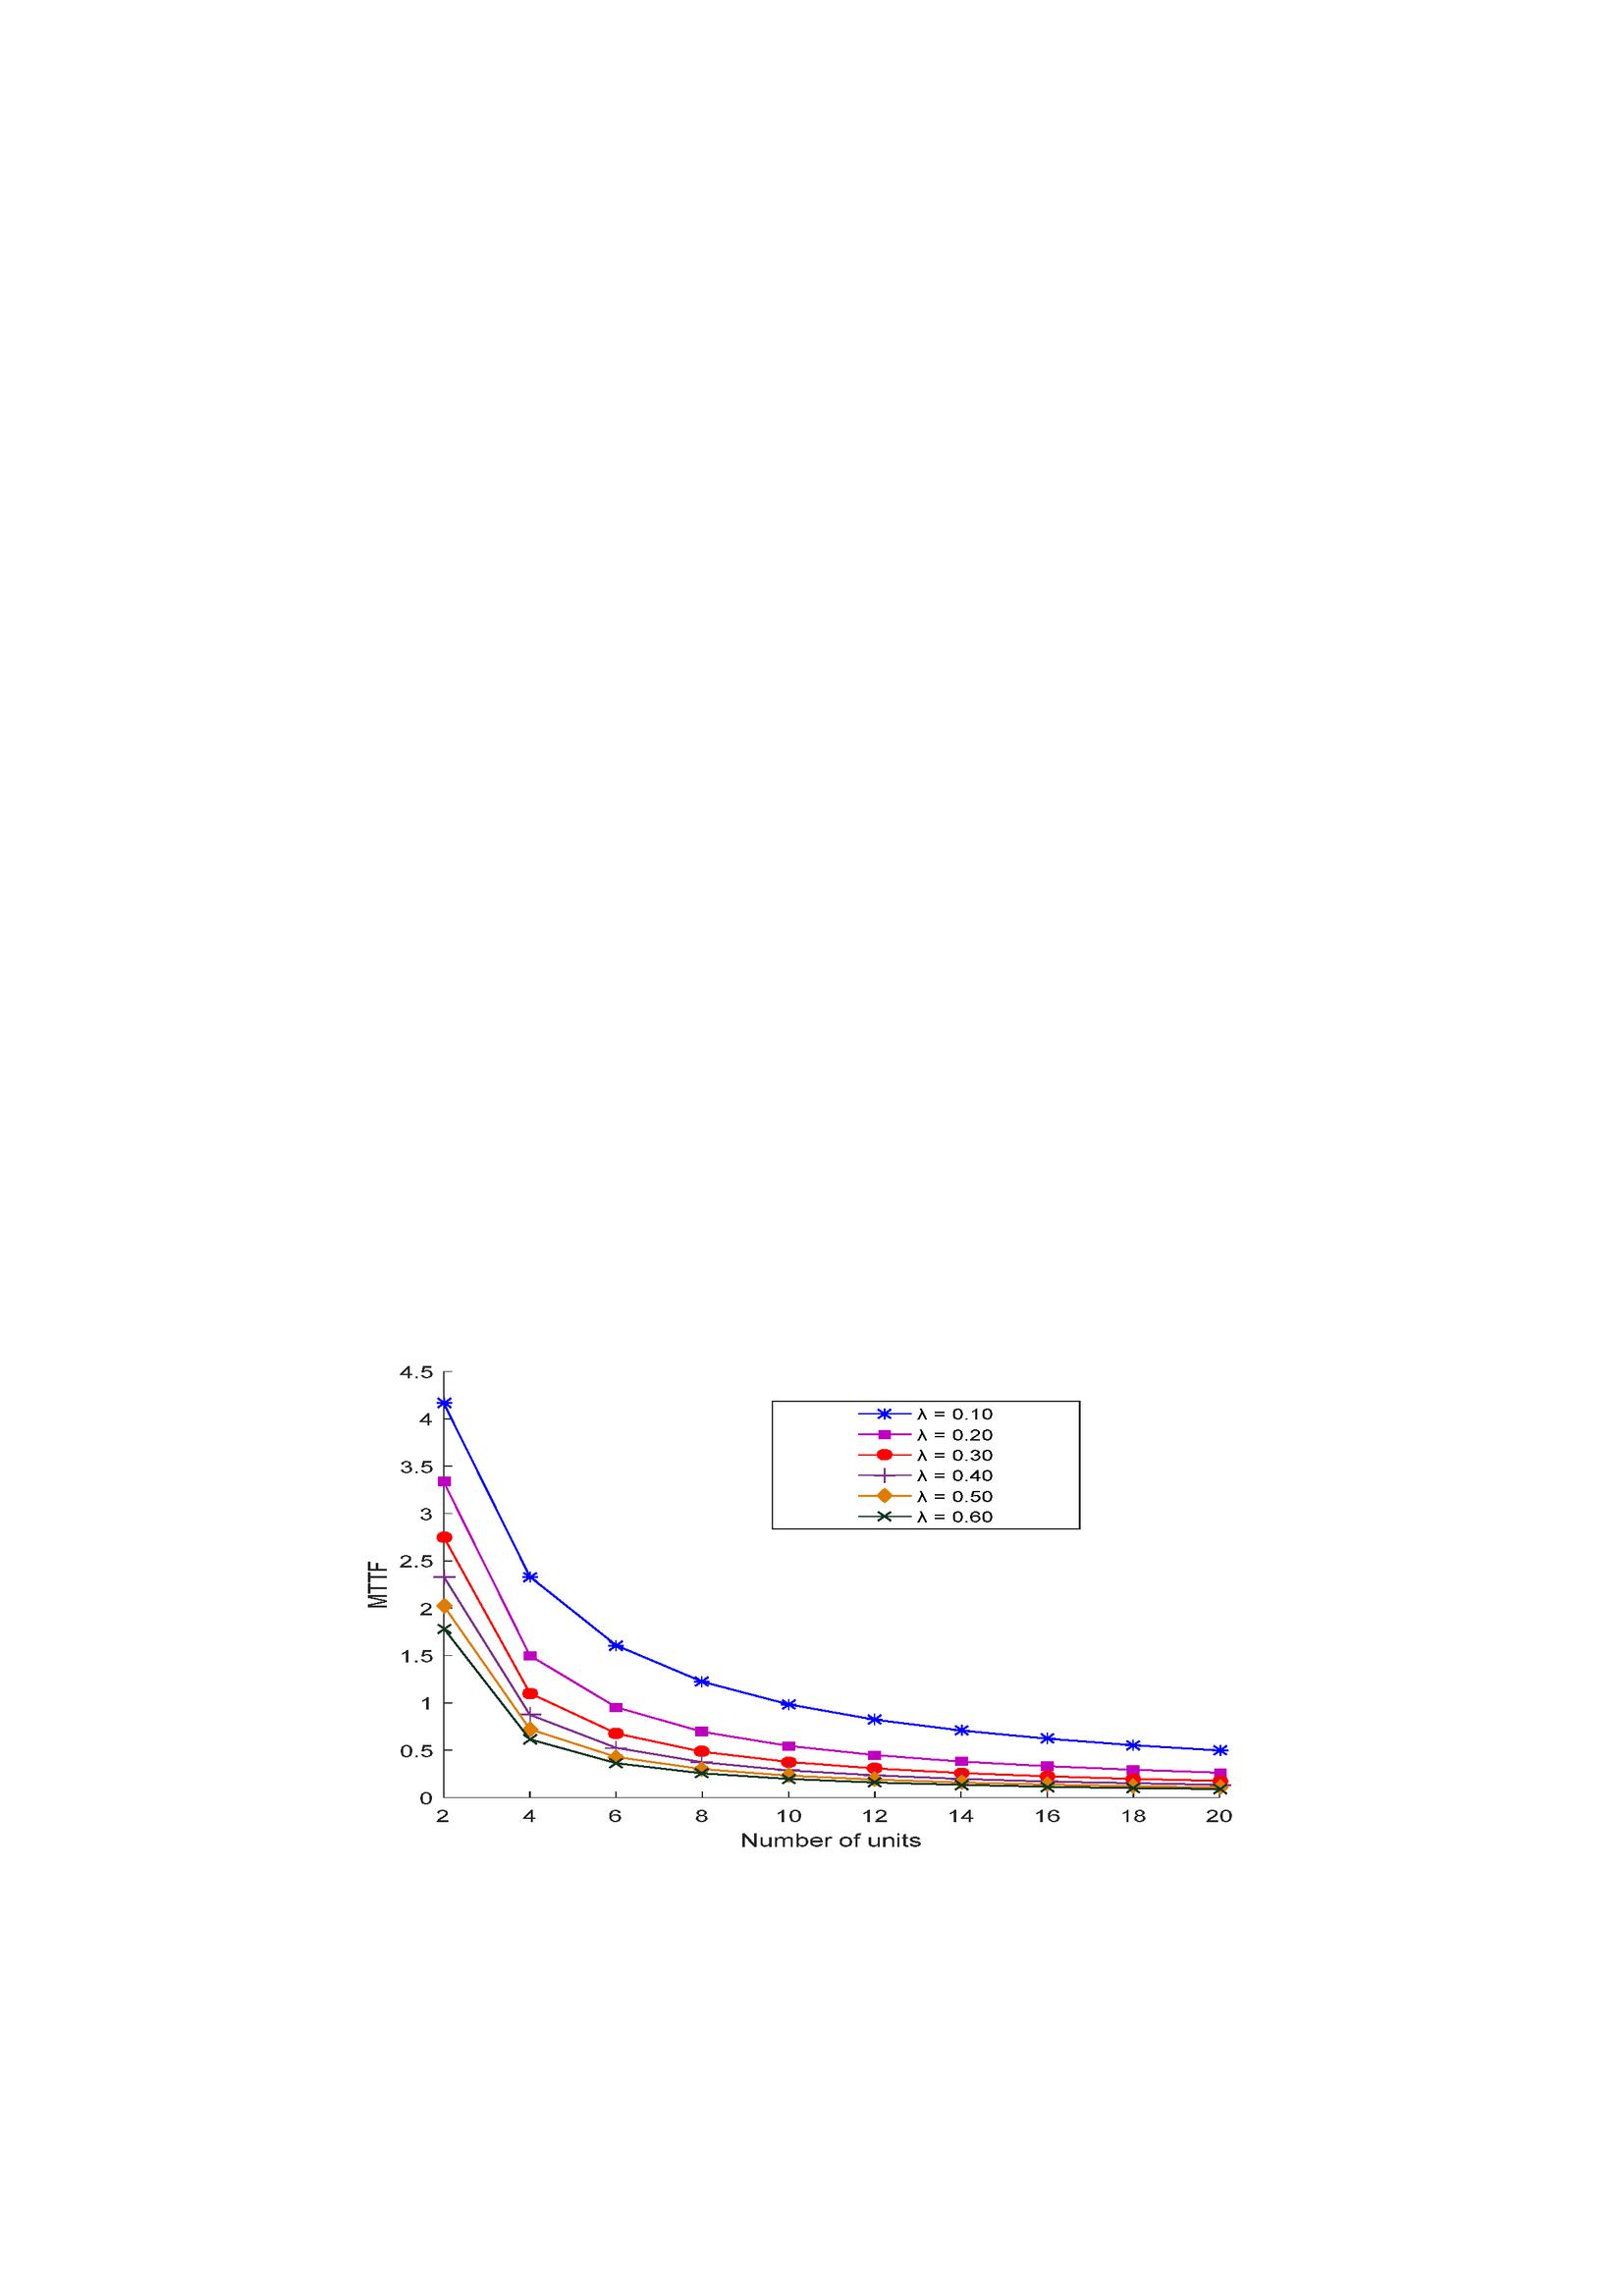
Figure 7 Effect of n and on system MTTF.
MTTF of the consecutive-(n-1)-out-of-n: G system has been analyzed by varying one parameter at a time in Equation (19). Figures 7, 8, and 9 indicate that the system MTTF follows a decreasing trend with increasing the number of components as well as the failure rates. The constant parameters assumed in Figures 7, 8, and 9 are , and , respectively.
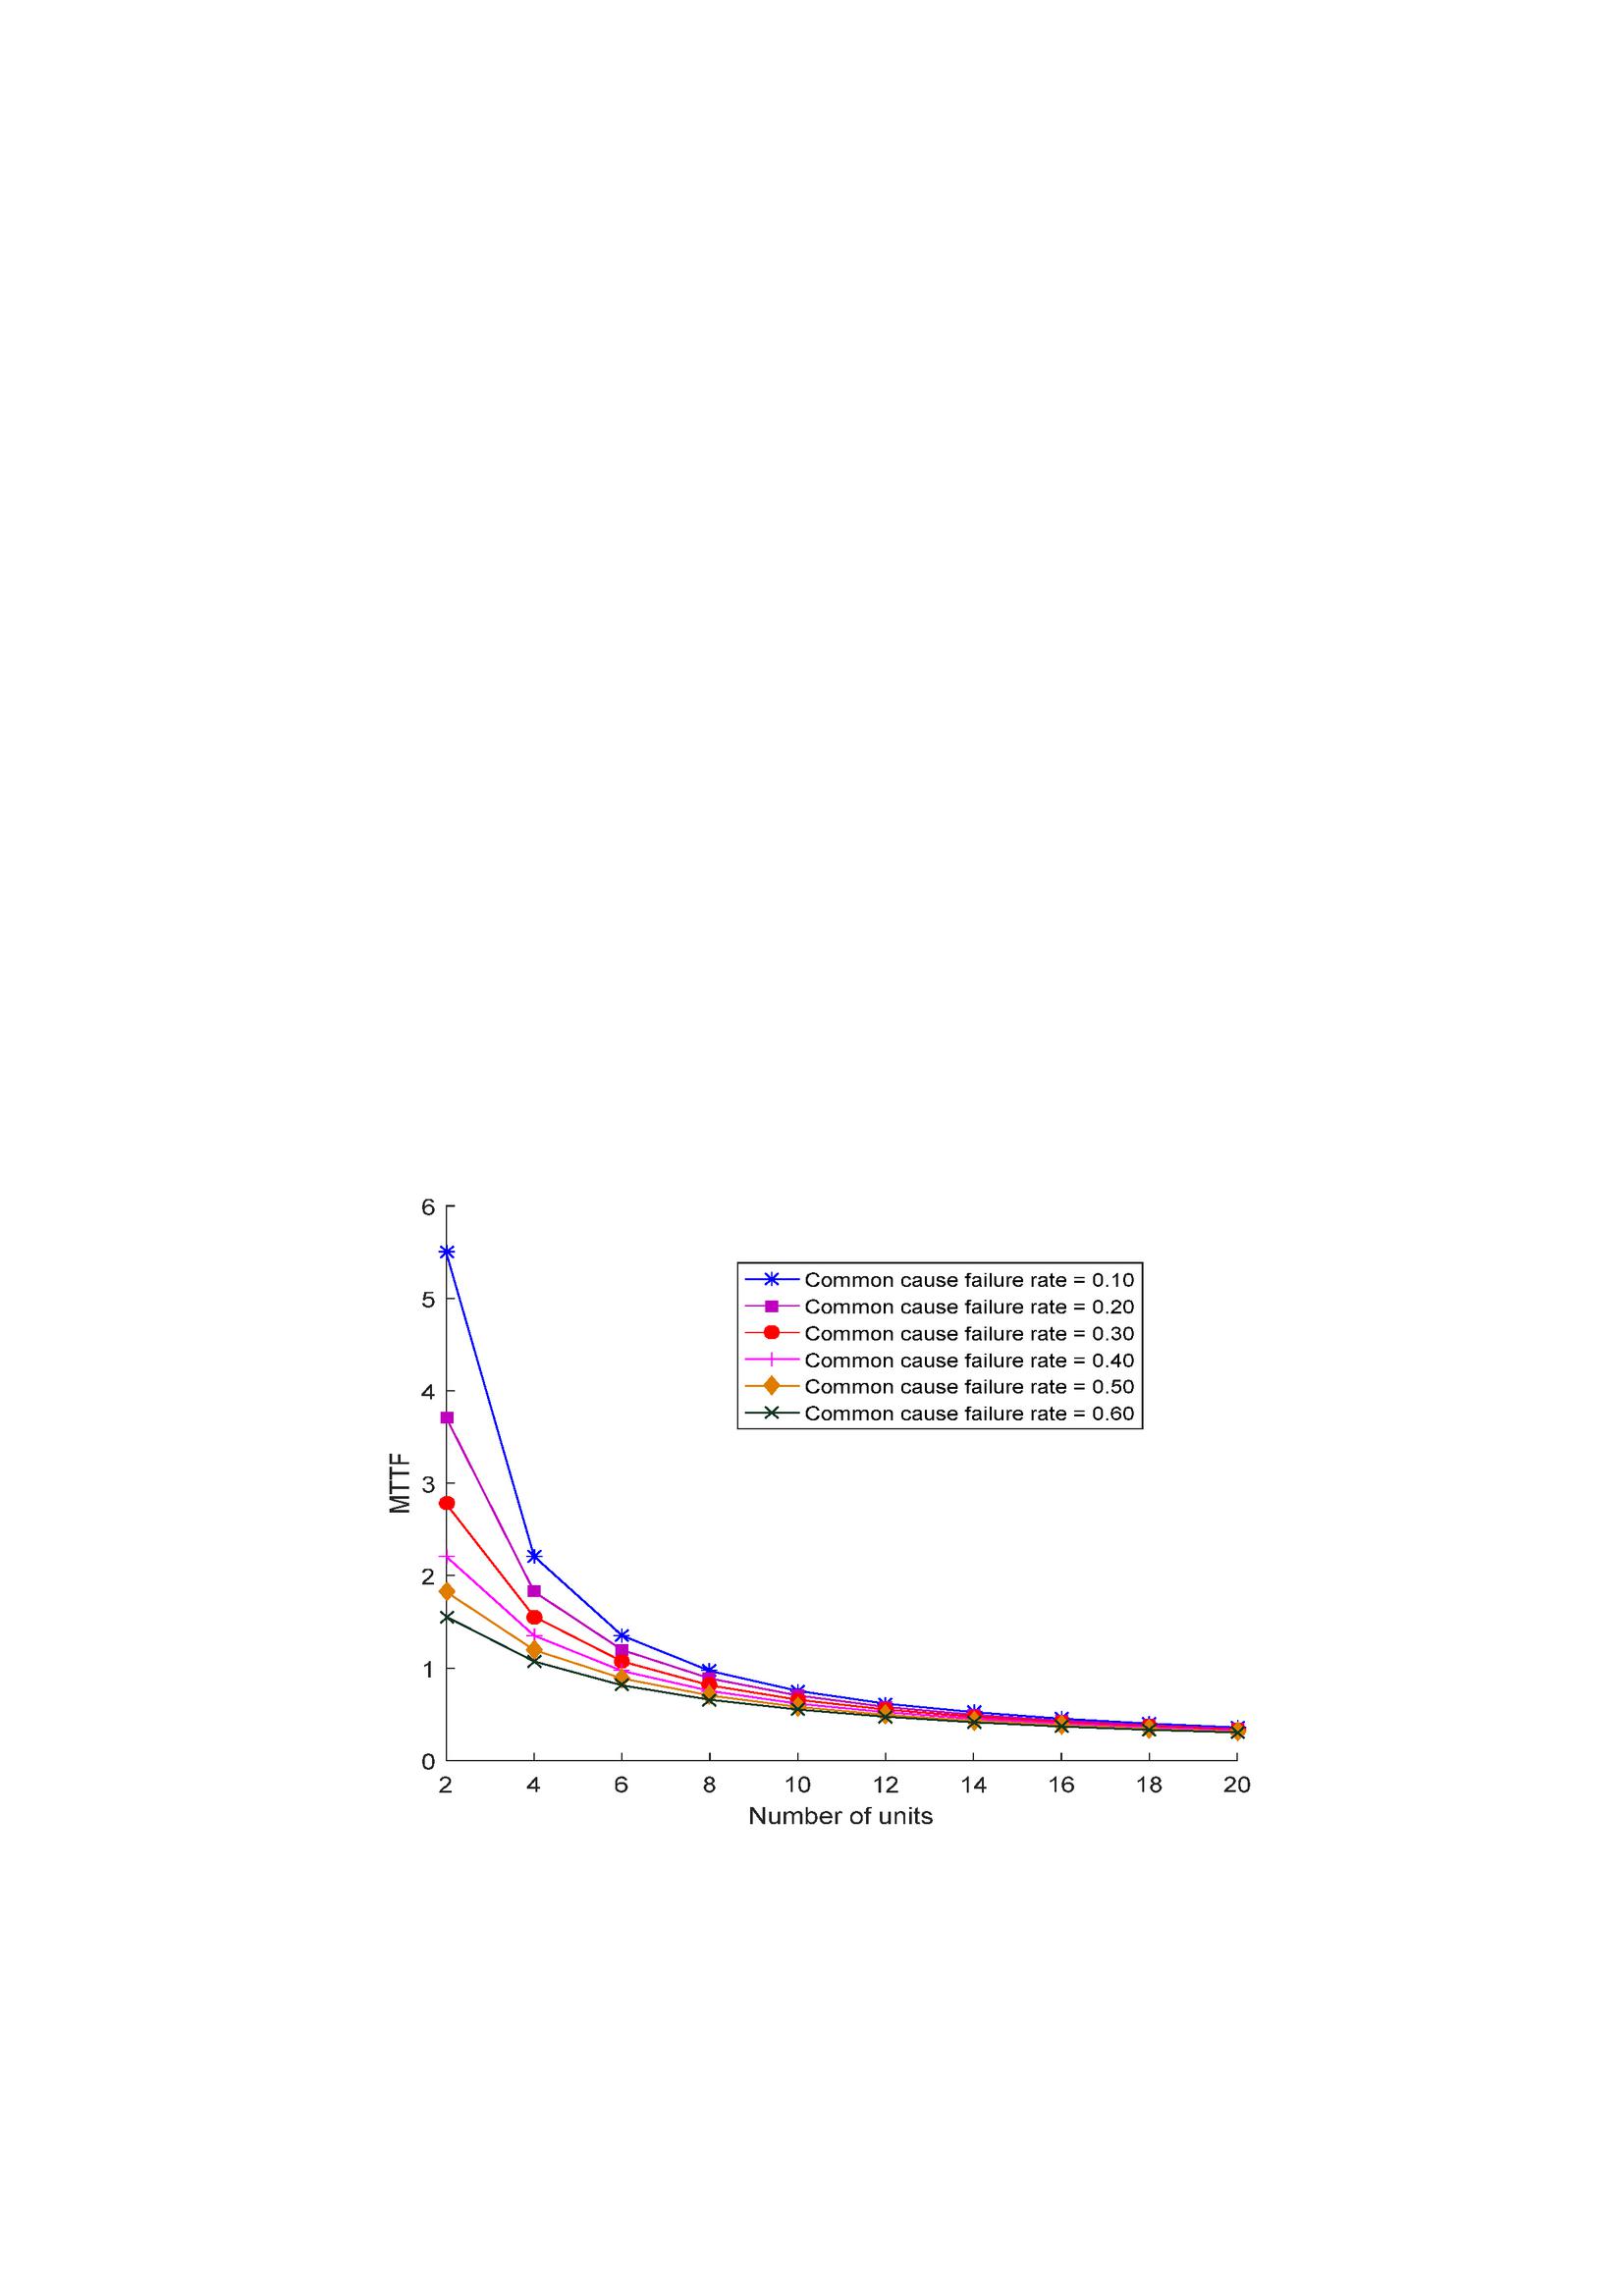
Figure 8 Effect of n and on system MTTF.
Figure 7 reveals that for the higher failure rates, as 0.40, 0.50, and 0.60 MTTF is nearly the same for all the linear consecutive (n-1)-out-of-n: G systems having more than 12 units. Similarly, Figure 8 shows that for the increased common cause failure rate, as 0.30, 0.40, 0.50, and 0.60, all the linear consecutive (n-1)-out-of-n: G systems with more than 8 units have almost alike MTTF.
Graphical presentation of the results shown in Figure 9 exhibits a sharp decrease in the system MTTF owing to increase in failure rate . For a fixed assumed common cause failure rate, , the MTTF of linear consecutive-9-out-of-10: G system decreases from 0.9848 to 0.1194 as, varies from 0.1 to 1.0 while this reduction is 0.3032 for a fixed value of when the common cause failure rate increases from 0.1 to 1.0.
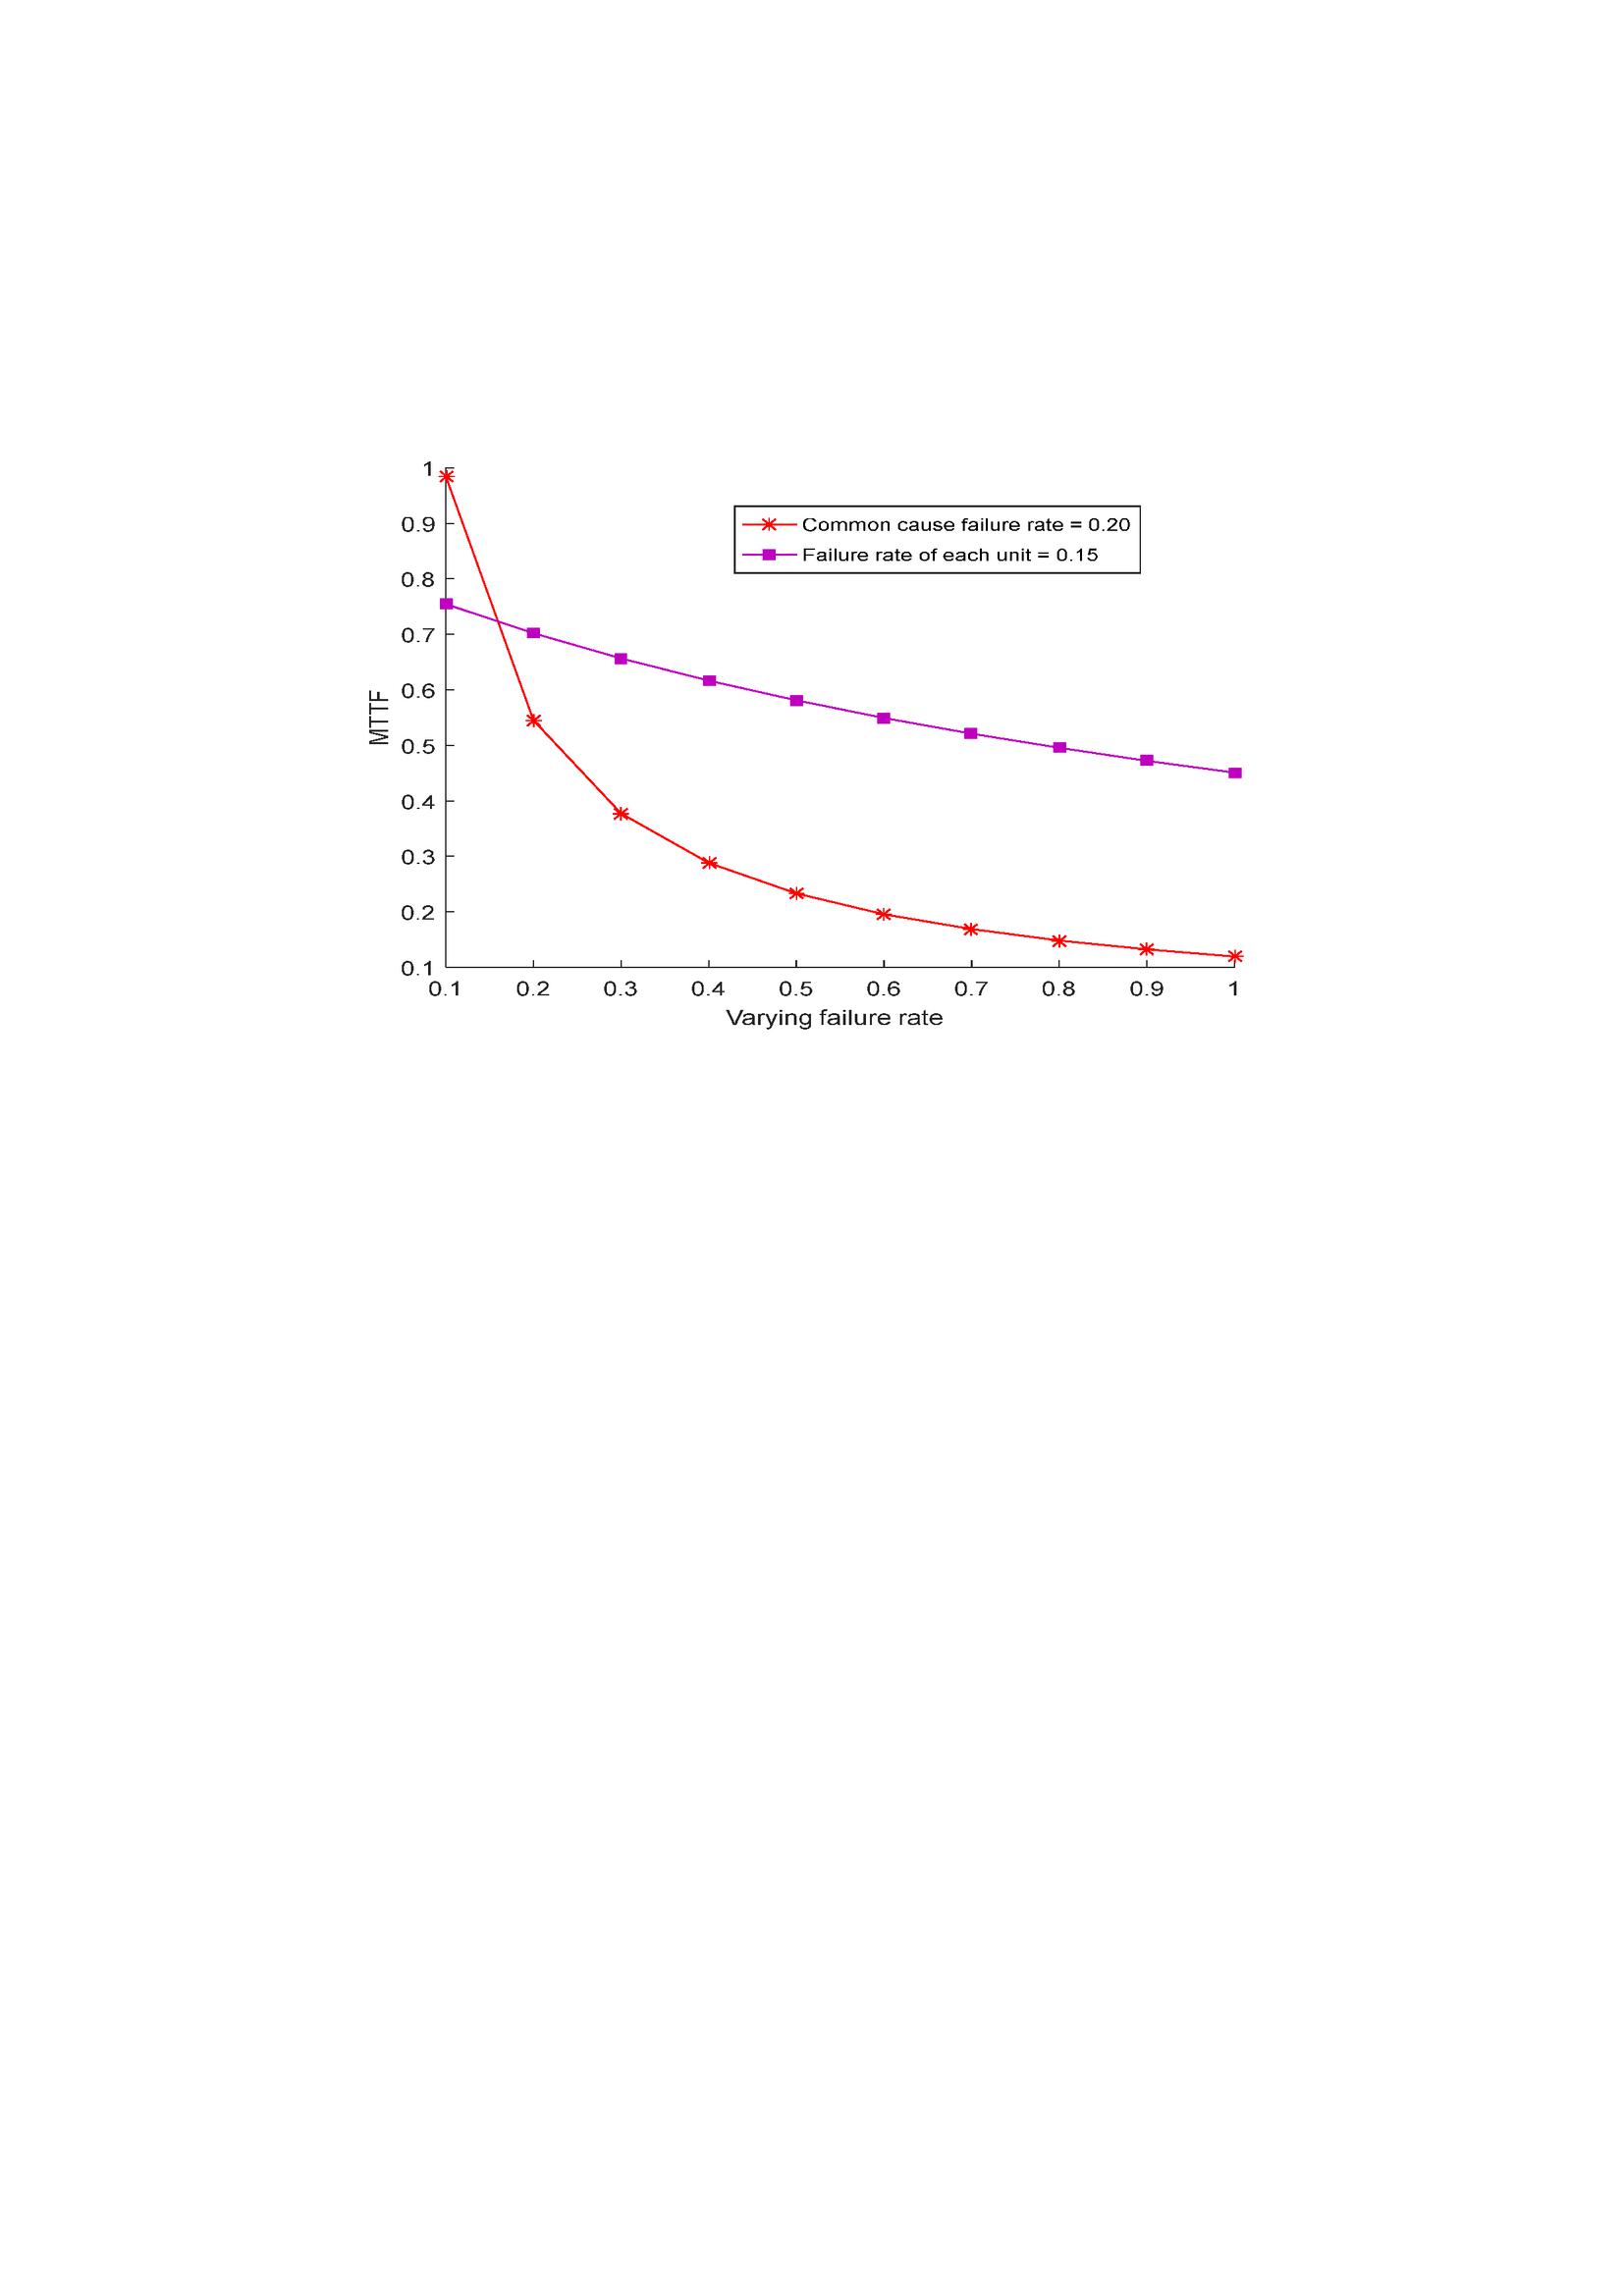
Figure 9 Effect of and on system MTTF.
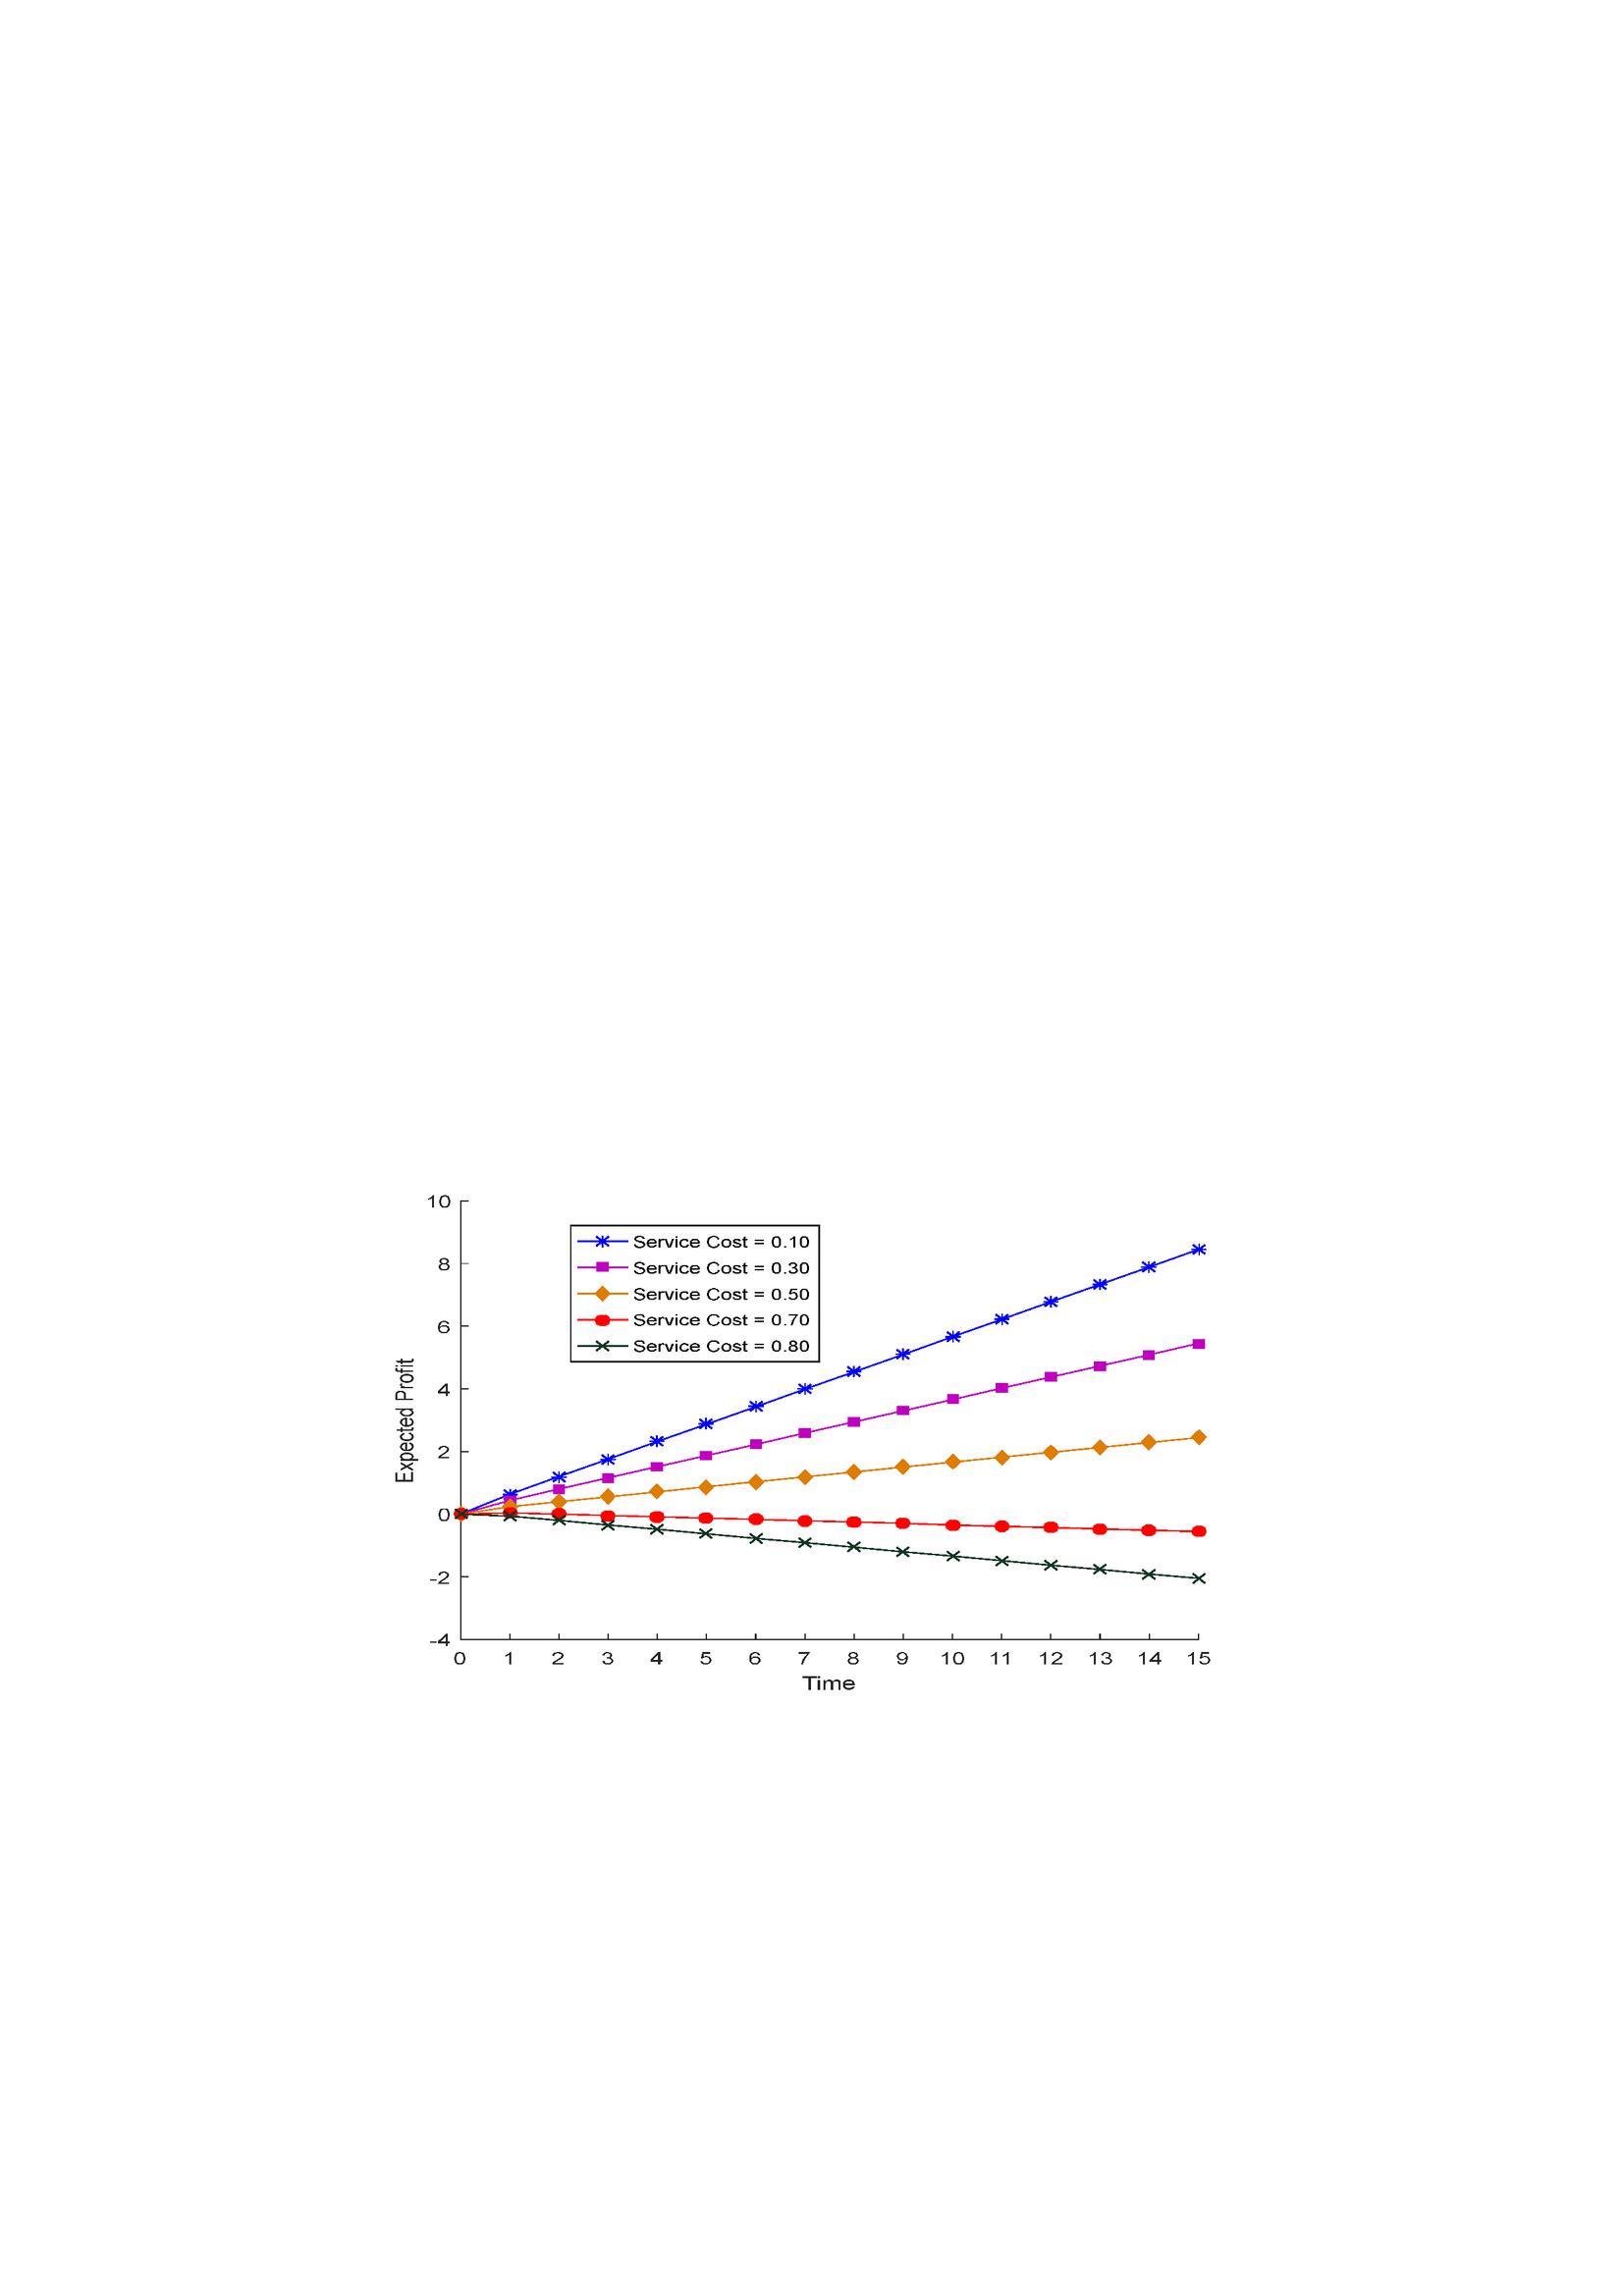
Figure 10 Effect of service cost on expected profit.
Figure 10 indicates that for the service costs of 0.10, 0.30, and 0.50 linear consecutive-9-out-of-10: G system is profitable, and the profit also increases with time. However, for and , the expected profit becomes negative, and the system goes into a loss. The study suggests that controlled lower failure rates and an optimum number of units may result in a highly efficient and profitable linear consecutive-(n-1)-out-of-n: G system.
6 Conclusion
A reliability model for linear consecutive-k-out-of-n: G system is developed using SVT by incorporating common cause failure and copula repair. In the present study a specific case of consecutive-(n-1)-out-of-n: G system has also been worked out. The reliability metrics of such system () have been evaluated and explored in depth by plotting different graphs which confirms that availability, reliability, and MTTF of linear consecutive-(n-1)-out-of-n: G system decrease on account of rise in common cause failure, hardware failure rate, and the number of units. In the proposed model, MTTF of consecutive-9-out-of-10: G system is strongly influenced by increased hardware failure rate, . It has been observed that the MTTF of linear consecutive-9-out-of-10: G system declines more rapidly with rise in the hardware failure rate, , as compared to the common cause failure rate, . For the assumed parameters, corresponding to revenue cost one and service costs of 0.10, 0.30, 0.50, 0.70, and 0.80, the considered linear consecutive-9-out-of-10: G system is earning reasonable profit only if the involved service cost is 0.10, 0.30 and 0.50. The linear consecutive-(n-1)-out-of-n: G system with a lower hardware failure rate, no common cause failure, and an optimum number of units need to be designed, as otherwise, due to the high involved service cost, it may not give significant profit. The findings of this study are expected to be very beneficial for the industries because they may assist them in developing highly reliable and cost-efficient linear consecutive-k-out-of-n: G systems. Managers or the concerned persons can easily adopt the developed model for evaluating reliability measures of linear consecutive-(n-1)-out-of-n: G system. The developed stochastic model can be made more applicable by incorporating the notion of multi-state units and imperfect repair. The proposed model can be further improved by combining inspection and maintenance policies.
References
Cheng, K., and Zhang, Y. L. (2001). Analysis for a consecutive-k-out-of-n: F repairable system with priority in repair. International Journal of Systems Science, 32(5), 591–598.
Chopra, G., and Ram, M. (2019). Reliability measures of two dissimilar units parallel system using Gumbel-Hougaard family copula. International Journal of Mathematical, Engineering and Management Sciences, 4(1), 116–130.
Cox, D. R. (1955). The analysis of non-Markovian stochastic processes by the inclusion of supplementary variables. In Mathematical Proceedings of the Cambridge Philosophical Society, 51(3), 433–441. Cambridge University Press.
Gökdere, G., and Tony Ng, H. K. (2022). Time-dependent reliability analysis for repairable consecutive-k-out-of-n: F system. Statistical Theory and Related Fields, 6(2), 139–147.
Goyal, N., Ram, M., Amoli, S., and Suyal, A. (2017). Sensitivity analysis of a three-unit series system under k-out-of-n redundancy. International Journal of Quality and Reliability Management, 34(6), 770–784.
Guan, J., and Wu, Y. (2006). Repairable consecutive k-out-of-n: F system with fuzzy states. Fuzzy sets and systems, 157(1), 121–142.
Gupta, R., and Goel, L. R. (1992). Profit analysis of a k-out-of-n trichotomous system. Reliability Engineering and System Safety, 37(1), 39–44.
Kontoleon, J. M. (1980). Reliability determination of a r-successive-out-of-n: F system. IEEE Transactions on Reliability, 29(5), 437–437.
Kossow, A., and Preuss, W. (1989). Reliability of consecutive-k-out-of-n: F systems with nonidentical component reliabilities. IEEE Transactions on Reliability, 38(2), 229–233.
Krishnan, R., and Somasundaram, S. (2011). Reliability analysis of repairable consecutive-k-out-of-n: G systems with sensor and repairmen. International Journal of Quality and Reliability Management, 28(8), 894–908.
Kumar, V., Singh, L., and Tripathi, A. K. (2018). Reliability analysis of safety-critical and control systems: a state-of-the-art review. IET Software, 12(1), 1–18.
Kuo, W., Zhang, W., and Zuo, M. (1990). A consecutive-k-out-of-n: G system: The mirror image of a consecutive-k-out-of-n: F system. IEEE Transactions on Reliability, 39(2), 244–253.
Linton, D. G., and Saw, J. G. (1974). Reliability analysis of the k-out-of-n: F system. IEEE Transactions on Reliability, 23(2), 97–103.
Mishra, A., and Jain, M. (2013). Availability of k-out-of-n: F secondary subsystem with general repair time distribution.
Özbey, F., and Gökdere, G. (2021). Analysis of Linear Consecutive-2-out-of-n: F Repairable System with Different Failure Rate. Bitlis Eren Üniversitesi Fen Bilimleri Dergisi, 10(1), 91–99.
Poonia, P. K. (2021). Performance assessment of a multi-state computer network system in series configuration using copula repair. International Journal of Reliability and Safety, 15(1–2), 68–88.
Poonia, P. K. (2022). Performance Assessment and Sensitivity Analysis of a Computer Lab Network Through Copula Repair with Catastrophic Failure. Journal of Reliability and Statistical Studies, 105–128.
Ram, M., and Kumar, A. (2014). Performance of a structure consisting a 2-out-of-3: F substructure under human failure. Arabian Journal for Science and Engineering, 39(11), 8383–8394.
Ram, M., and Kumar, A. (2015). Performability analysis of a system under 1-out-of-2: G scheme with perfect reworking. Journal of the Brazilian Society of Mechanical Sciences and Engineering, 37(3), 1029–1038.
Ram, M., and Singh, S. B. (2010). Availability, MTTF and cost analysis of complex system under preemptive-repeat repair discipline using Gumbel-Hougaard family copula. International Journal of Quality & Reliability Management, 27(5), 576–595.
Rawal, D. K., Ram, M., and Singh, V. V. (2015). Study of reliability measures of a local area network via copula linguistics approach. International Journal of Quality & Reliability Management, 33(1), 97–111.
Rawal, D. K., Sahani, S. K., Singh, V. V., and Jibril, A. (2022). Reliability assessment of multi-computer system consisting n clients and the k-out-of-n: G operation scheme with copula repair policy. Life Cycle Reliability and Safety Engineering, 11, 163–175.
Sanusi, A., Yusuf, I., and Yusuf, H. A. (2022). Evaluation of reliability characteristics of automated teller machine system using Gumbel–Hougaard family copula repair policies. Life Cycle Reliability and Safety Engineering, 11, 367–375.
Singh, J., and Dayal, B. (1991). A 1-out-of-N: G system with common-cause failures and critical human errors. Microelectronics Reliability, 31(5), 847–849.
Singh, V. V., and Poonia, P. K. (2022). Stochastic analysis of k-out-of-n: G type of repairable system in combination of subsystems with controllers and multi repair approach. Journal of Optimization in Industrial Engineering, 15(1), 121–130.
Singh, V. V., Ismail, A. L., Chand, U., and Maiti, S. S. (2022). Performance Assessment of Complex System Under the k-out-of-n: G Type Configuration with k Consecutive Degraded States through the Copula Repair Approach. International Journal of Reliability, Quality and Safety Engineering, 29(2), 2150047.
Wang, Y., Hu, L., Yang, L., and Li, J. (2022). Reliability modeling and analysis for linear consecutive-k-out-of-n: F retrial systems with two maintenance activities. Reliability Engineering & System Safety, 226, 108665.
Wu, W., Tang, Y., Yu, M., and Jiang, Y. (2014). Reliability analysis of a k-out-of-n: G repairable system with single vacation. Applied Mathematical Modelling, 38(24), 6075-6097.
Wu, C., Zhao, X., Wang, S., and Song, Y. (2022). Reliability analysis of consecutive-k-out-of-r-from-n subsystems: F balanced systems with load sharing. Reliability Engineering & System Safety, 228, 108776.
Yam, R. C., Zuo, M. J., and Zhang, Y. L. (2003). A method for evaluation of reliability indices for repairable circular consecutive-k-out-of-n: F systems. Reliability engineering and System safety, 79(1), 1–9.
Yuan, L., and Cui, Z. D. (2013). Reliability analysis for the consecutive-k-out-of-n: F system with repairmen taking multiple vacations. Applied mathematical modelling, 37(7), 4685–4697.
Yusuf, I., Ismail, A. L., Lawan, M. A., Ali, U. A., and Nasir, S. (2021). Reliability modelling and analysis of client–server system using Gumbel–Hougaard family copula. Life Cycle Reliability and Safety Engineering, 10(3), 235–248.
Zhang, Y. L., and Wang, T. P. (1996). Repairable consecutive-2-out-of-n: F system. Microelectronics Reliability, 36(5), 605–608.
Zhang, Y. L., and Lam, Y. (1998). Reliability of consecutive-k-out-of-n: G repairable system. International Journal of Systems Science, 29(12), 1375–1379.
Zhang, Y. L., Zuo, M. J., and Yam, R. C. (2000). Reliability analysis for a circular consecutive-2-out-of-n: F repairable system with priority in repair. Reliability Engineering and System Safety, 68(2), 113–120.
Zhou, L., Yamamoto, H., Nakamura, T., and Xiao, X. (2020). Optimization problems for consecutive-2-out-of-n: G system. Communications in Statistics-Theory and Methods, 49(15), 3792–3807.
Biographies
Garima Chopra is presently working as Assistant Professor in the Department of Mathematics, University Institute of Engineering & Technology, Maharshi Dayanand University, Rohtak, Haryana, India. She received her Ph.D. degree in Mathematics from G. B. Pant University of Agriculture and Technology, Pantnagar, India in 2010. She is recipient of Certificate of Appreciation for excellent academic performance in M.Sc. by Ministry of HRD, Government of India. She has 11 years teaching experience. She has publications in renowned international journals. Her areas of interest are reliability analysis, wavelet transform and image processing.
Mangey Ram received the Ph.D. degree major in Mathematics and minor in Computer Science from G. B. Pant University of Agriculture and Technology, Pantnagar, India in 2008. He has been a Faculty Member for around thirteen years and has taught several core courses in pure and applied mathematics at undergraduate, postgraduate, and doctorate levels. He is currently the Research Professor at Graphic Era (Deemed to be University), Dehradun, India & Visiting Professor at Peter the Great St. Petersburg Polytechnic University, Saint Petersburg, Russia. Before joining the Graphic Era, he was a Deputy Manager (Probationary Officer) with Syndicate Bank for a short period. He is Editor-in-Chief of International Journal of Mathematical, Engineering and Management Sciences; Journal of Reliability and Statistical Studies; Journal of Graphic Era University; Series Editor of six Book Series with Elsevier, CRC Press-A Taylor and Frances Group, Walter De Gruyter Publisher Germany, River Publisher and the Guest Editor & Associate Editor with various journals. He has published 300 plus publications (journal articles/books/book chapters/conference articles) in IEEE, Taylor & Francis, Springer Nature, Elsevier, Emerald, World Scientific and many other national and international journals and conferences. Also, he has published more than 60 books (authored/edited) with international publishers like Elsevier, Springer Nature, CRC Press-A Taylor and Frances Group, Walter De Gruyter Publisher Germany, River Publisher. His fields of research are reliability theory and applied mathematics. Dr. Ram is a Senior Member of the IEEE, Senior Life Member of Operational Research Society of India, Society for Reliability Engineering, Quality and Operations Management in India, Indian Society of Industrial and Applied Mathematics, he has been a member of the organizing committee of a number of international and national conferences, seminars, and workshops. He has been conferred with “Young Scientist Award” by the Uttarakhand State Council for Science and Technology, Dehradun, in 2009. He has been awarded the “Best Faculty Award” in 2011; “Research Excellence Award” in 2015; “Outstanding Researcher Award” in 2018 for his significant contribution in academics and research at Graphic Era Deemed to be University, Dehradun, India. Recently, he has been received the “Excellence in Research of the Year-2021 Award” by the Honourable Chief Minister of Uttarakhand State, India.
Journal of Reliability and Statistical Studies, Vol. 15, Issue 2 (2022), 669–692.
doi: 10.13052/jrss0974-8024.15211
© 2023 River Publishers