Reliability Analysis with New Sine Inverse Rayleigh Distribution
Ikwuoche John David1, Mathew Stephen2,* and Eghwerido Joseph Thomas3
1Federal University Wukari, Nigeria
2Kwararafa University Wukari, Nigeria
3Federal University of Petroleum Resources, Effurun, Nigeria
E-mail: davidij@fuwukari.edu.ng; matetsve231@gmail.com; eghwerido.joseph@fupre.edu.ng
*Corresponding Author
Received 31 March 2023; Accepted 01 December 2023; Publication 26 December 2023
Abstract
This article examined some of the characteristics of the New Sine Inverse Rayleigh Distribution. There is just one scale parameter in the New Sine Inverse Rayleigh distribution. The raw moments, reliability analysis, and other aspects of the New Sine Inverse Rayleigh Distribution have been derived. The maximum likelihood approach was used to estimate the New Sine Inverse Rayleigh Distribution’s parameters. Utilizing simulation, the distribution’s stability was examined, and the applicability of the distribution was demonstrated using three data sets. The analysis’s findings demonstrated that the New Sine Inverse Rayleigh Distribution behaves well and fits the data more closely than other probability distributions.
Keywords: Well-behaved, New Sine G, MLE, reliability.
1 Introduction
Probability models are vital tools for representing random processes in statistics. In recent years, new flexible models have been discussed and evaluated in the literature. This made it possible to investigate real processes in greater depth. Researchers have suggested more flexible distributions for better modeling of various types of data experience in practical applications as a result of the advancement of research in many fields, including reliability, predictive modelling, information science, financial management, biomedical sciences, medicine, hydrology, and many more.
One example of probability distributions is the Rayleigh distribution, named after John William Strutt, popularly known as Lord Rayleigh, a British scientist who lived from 1842 to 1919 (Umar 2017). This probability distribution is known to have many applications including in life testing trials, cognitive science, technology, reliability test, medical testing, and clinical investigations. It was derived from the two parameter Weibull distribution. By transforming the random variable, it can be demonstrated that if the random variable (r. v.) has a Rayleigh distribution, then, has an inverse Rayleigh distribution (IRD). Assume that z is a random variable with a scale parameter that follows the Inverse Rayleigh distribution, then, its PDF (probability density function) and CDF (cumulative density function) are provided by,
| (1) | ||
| (2) |
The Rayleigh distribution is known to have some infirmities and to make the model more flexible and applicable, the model has been modified by several scholarships. Some of the extensions are, Weibull Rayleigh proposed by Merovci, and Elbatal (2015), the Odd Lindley-Rayleigh distribution posited by Ieren, Abdulkadir, and Issa (2020), Rayleigh-Rayleigh distribution formulated by Al-Noor and Assi (2020), Lomax-Rayleigh distribution by Al-Anber (2020), New generalized Rayleigh distribution by Voda (2007), Generalized Rayleigh distribution by Kundu, and Raqab (2005), Transmuted Rayleigh by Merovci (2013), the alpha power inverse Rayleigh distribution by Malik and Ahmad (2019), the Epsilon-Skew Rayleigh Distribution by Greene (2019) amongst others. Considering the dynamics of data generation systems in the 21st century, reliability data often arise from systems that are highly complex thus, there is a need to continually improve the ability of existing to adjust and accommodate these realities.
Mahmood, Chesneau, and Tahir (2019) proposed the New Sine G family of distribution. This transformation has some appealing properties, like potential to capture periodic behavior. The sine function introduces periodic behavior which can be observable in reliability data. This article intends to use this transformation to modify the inverse Rayleigh distribution to make it more flexible. As suggested by Mahmood et al., (2019), the CDF of the N-Sine family of distributions is as stated below;
| (3) |
On substituting (1) into (3), the new CDF of the N-Sine Inverse Rayleigh Distribution is formed as shown below;
| (4) |
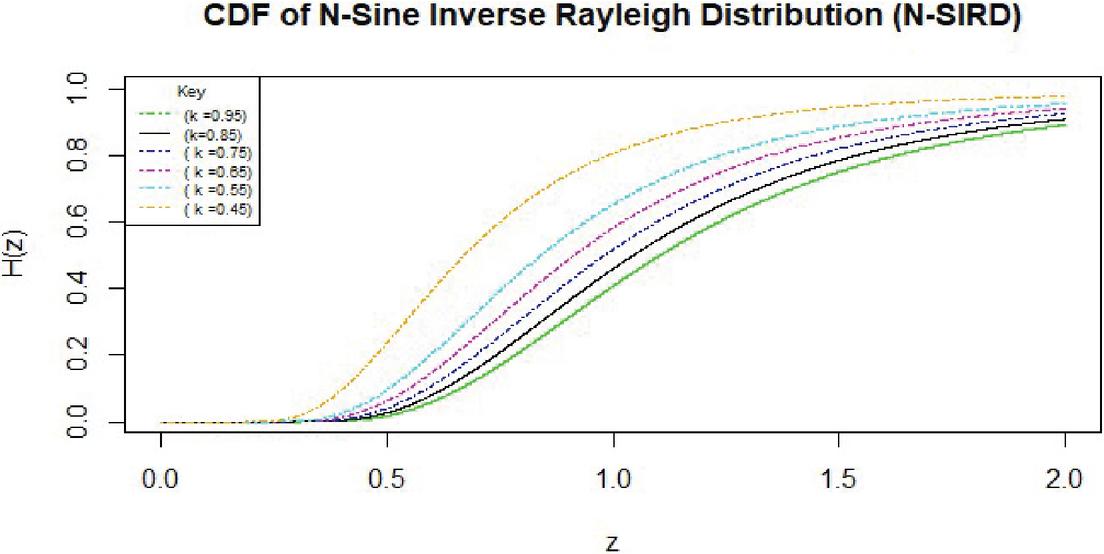
Figure 1 CDF of N-SIRD.
Thus, in line with the fundamental theory of calculus, to obtain the PDF of the N-Sin Inverse Rayleigh Distribution, (N-SIRD) the CDF is differentiated with respect to the random variable in the model. This is shown as;
| (5) |
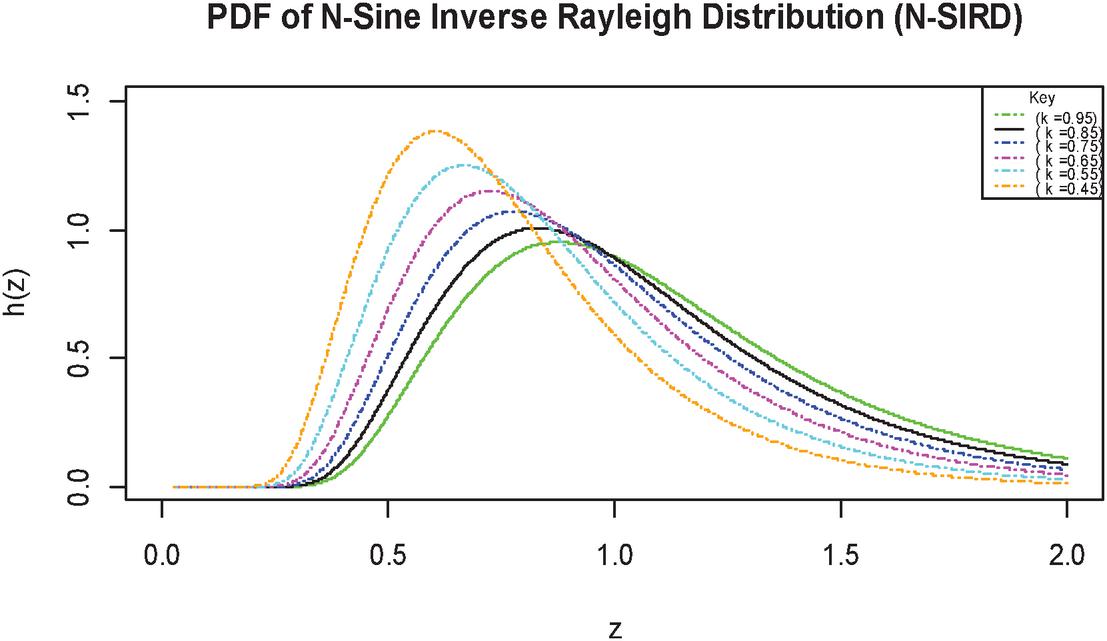
Figure 2 PDF of N-SIRD.
2 Mixture Representation for N-SIRD Model
To derive the statistical properties of the N-SIRD, a mixture representation for the PDF of the N-SIRD is derived as shown below. As discussed in Mahmood et al. (2019), a random variable z N-SIRD is a member of NS-G family and can be generally represented as;
| (6) |
(For further details on the derivation of (6), consult Mahmood et al., 2019).
Let
| (7) |
Then it implies that,
| (8) |
Substituting for and in (8),
| (9) | ||
| (10) |
3 Some Properties of N-SIRD Derived
3.1 Survival Function
| (11) |
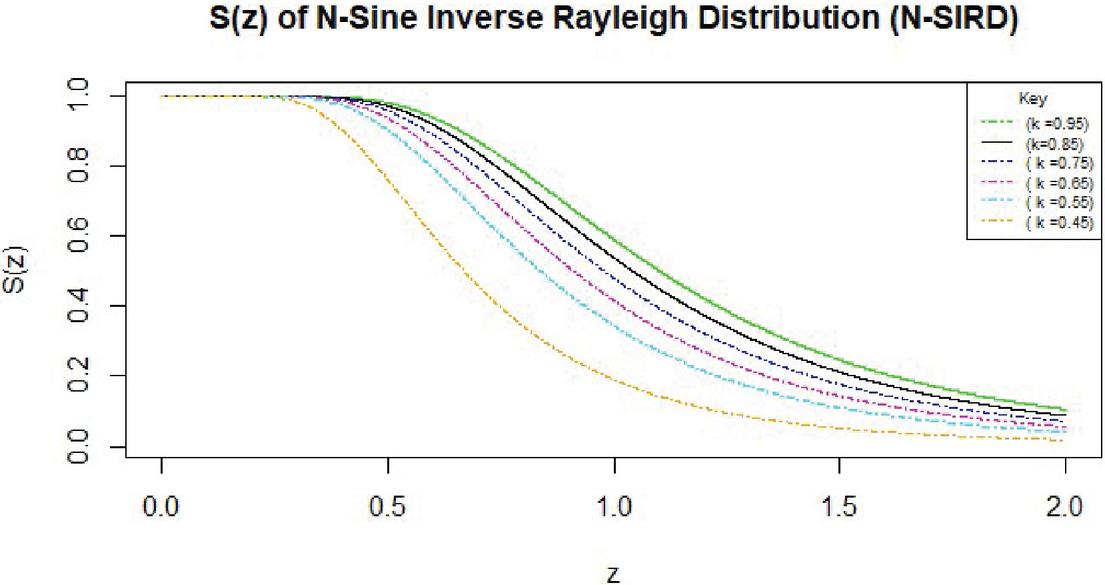
Figure 3 Survival function of N-SIRD.
3.2 Hazard Function
The hazard function, is a concept used in survival analysis and reliability theory. It describes the instantaneous probability of an event occurring at a particular point in time, given that the event has not occurred up to that time. It quantifies the likelihood of an event happening in a very small-time interval, conditional on the event not having occurred before. For the N-SIRD, the hazard function is given by;
| (12) |

Figure 4 Hazzard function of N-SIRD.
3.3 Raw Moments
The th raw moment of a continuous probability distribution is defined as the expected value of the th power of a random variable. It is calculated using the probability density function (PDF) of the distribution as follows:
| (13) |
For a random variable , is derived as;
| (14) |
By transformation, if we let
| (15) |
Then on substituting (3.3) into (14), we arrived at,
| (16) |
Using the Gamma notation, (3.3) can be written in the following form,
| (17) |
3.4 Moment Generating Function (MGF)
If , then the MGF of is obtained as follows;
| (18) |
Since the Taylor’s series expansion of then,
| (19) |
and
| (20) |
3.5 Quantile Function
The quantile function of a random variable is obtained by inverting the CDF of the distribution of the random variable. This can be illustrated as follows. Let , then the quantile function of is obtained by solving the equation;
| (21) |
For the family of N-Sine G Distribution, the quantile function is given by the expression below;
| (22) |
where is the quantile function of the distribution being transformed. (For further details on the proof of (22)(6), consult Mahmood et al., 2019). Therefore, the quantile function for the density model of the N-SIRD is given by the expression below;
| (23) |
where is the quantile function of the Inverse Rayleigh distribution.
The quantile function of the N-SIRD is thus given as,
| (24) |
| Size (n) | Parameters | MLE | AAB | MSE |
| 30 | 0.3 | 0.17976 | 0.1202399 | 0.0144576 |
| 30 | 0.4 | 0.31733 | 0.0826722 | 0.0068347 |
| 60 | 0.3 | 0.24630 | 0.0536974 | 0.0028834 |
| 60 | 0.4 | 0.37146 | 0.0285361 | 0.0008143 |
| 90 | 0.3 | 0.24418 | 0.0558220 | 0.0031161 |
| 90 | 0.4 | 0.36002 | 0.0399776 | 0.0015982 |
| 150 | 0.3 | 0.24805 | 0.0519466 | 0.0026984 |
| 150 | 0.4 | 0.37411 | 0.0258894 | 0.0006703 |
| 200 | 0.3 | 0.25467 | 0.0453269 | 0.0020545 |
| 200 | 0.4 | 0.39060 | 0.0093996 | 0.0000884 |
| 400 | 0.3 | 0.25515 | 0.0448475 | 0.0020113 |
| 400 | 0.4 | 0.39913 | 0.0008728 | 0.0000008 |
| 600 | 0.3 | 0.25578 | 0.0442174 | 0.0019552 |
| 600 | 0.4 | 0.41013 | 0.0101250 | 0.0001025 |
4 Study of the Parameter Behavior of N-SIRD Using Simulation
In this subsection, a simulation by Monte Carlo method is carried out to assess how well-behaved the model is with respect to the parameter estimates and sample sizes. In order to run the simulation, the R program was used to produce random samples with constants of n 30, 60, 90, 150, 200, 400, and 600 while selecting the parameter 0.3 and 0.4. According to Table and Figures 1: I and II, the average absolute bias (ABBS), mean square error (MSE), and root mean square error (RMSE) values were calculated using the maximum likelihood estimation (MLE) technique. All the values of the MSE and AAB demonstrated that there was consistency characteristic since they were decreasing in magnitude as the sample size increases. The Adequacy model package and R program are used throughout the whole simulation.
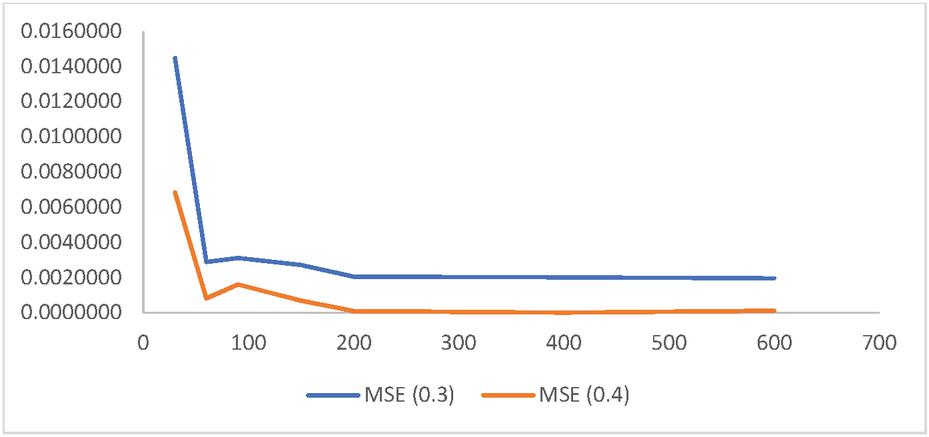
Figure 5 Displaying the MSE at different (n).
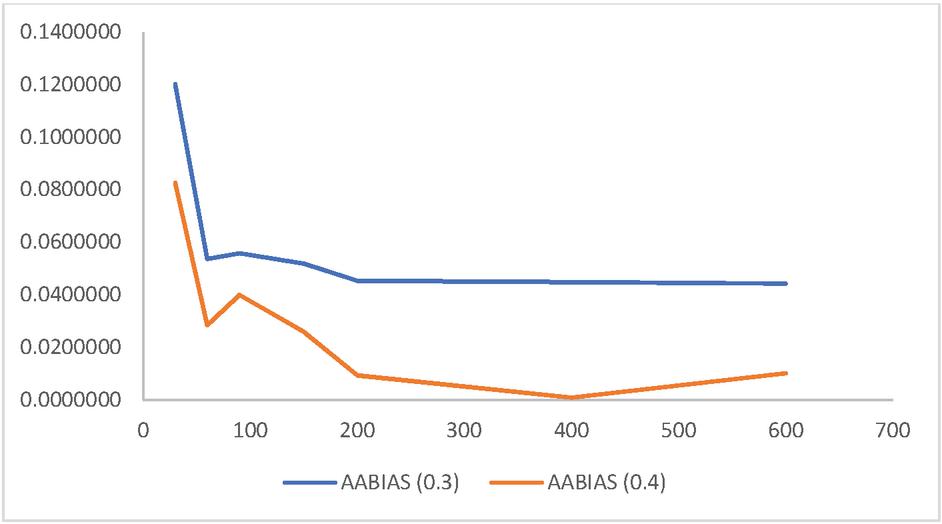
Figure 6 Displaying the RMSE at different (n).
5 Application in Fitting Real Datasets
To compare fitness of distributions to a data set, information criteria like Akaike Information Criterion, (AIC), Bayesian Information Criterion (BIC), Consistent Akaikes Information Criterion (CAIC) and Hannan-Quinn information criterion, (HIC) were used. The best distribution (model) is corresponding to smaller values of (AIC), (BIC), (CAIC) and (HIC). Three data sets were fitted to seven probability distributions and the results are presented in Tables 2 to 4.
| Models | N-SIRD | PrD | RaD | SED | SIED | WD | FD | ||||
| AIC | 94.39 | 247.22 | 221.90 | 171.96 | 169.80 | 105.74 | 398.36 | ||||
| BIC | 96.53 | 249.37 | 224.04 | 174.10 | 171.94 | 112.17 | 404.79 | ||||
| CAIC | 94.45 | 247.29 | 221.97 | 172.02 | 169.86 | 106.15 | 398.77 | ||||
| HIC | 95.23 | 248.07 | 222.74 | 172.80 | 170.64 | 108.27 | 400.89 | ||||
| MLE | 1.90 | 1.80 | 2.00 | 0.38 | 1.05 | 2.00 | 1.54 | 1.51 | 0.67 | 0.72 | 0.69 |
| Key: RaD Ram Awadh Distribution; SED Sine Exponential Distribution; N-SIRD New Sine Inverse Rayleigh Distribution; PrD Prakaamy Distribution; SIED Sine Inverse Exponential Distribution; WD Weibull Distribution, FD Frchet Distribution. | |||||||||||
| Models | N-SIRD | PrD | RaD | SED | SIED | WD | FD | ||||
| AIC | 159.64 | 216.03 | 209.41 | 255.41 | 374.28 | 285.70 | 613.71 | ||||
| BIC | 161.87 | 218.26 | 211.65 | 257.64 | 376.52 | 292.40 | 620.41 | ||||
| CAIC | 159.70 | 216.09 | 209.47 | 255.47 | 374.34 | 286.07 | 614.08 | ||||
| HIC | 160.53 | 216.91 | 210.30 | 256.30 | 375.17 | 288.36 | 616.37 | ||||
| MLE | 5.25 | 1.62 | 1.85 | 0.24 | 0.71 | 0.95 | 1.67 | 0.36 | 0.41 | 0.54 | 0.57 |
| Models | N-SIRD | PrD | RaD | SED | SIED | WD | FD | ||||
| AIC | 42.40 | 70.84 | 119.50 | 65.45 | 54.94 | 51.54 | 153.78 | ||||
| BIC | 43.39 | 71.83 | 120.50 | 66.44 | 55.94 | 54.52 | 156.77 | ||||
| CAIC | 42.62 | 71.06 | 119.72 | 65.67 | 55.16 | 53.04 | 155.28 | ||||
| HIC | 42.59 | 71.03 | 119.70 | 65.64 | 55.13 | 52.12 | 154.37 | ||||
| MLE | 2.92 | 1.85 | 1.20 | 0.30 | 2.00 | 1.97 | 1.90 | 0.33 | 0.54 | 0.63 | 1.69 |
First Data Set
The dataset contains information about the strength of 1.5 cm glass fibers, measured at the National Physical Laboratory in England. While the paper does not specify the units of measurement, these units have been adapted from a source called Smith and Naylor (1987). This dataset is essential for the analysis of the strength and mechanical properties of these specific glass fibers.
0.55,0.93,1.25,1.36,1.49,1.52,1.58,1.61,1.64,1.68,1.73,1.81,2.00,0.74,1.04, 1.27,1.39,1.49,1.53,1.59,1.61,1.66,1.68,1.76,1.82,2.01,0.77,1.11,1.28,1.42, 1.50,1.54,1.60,1.62,1.66,1.69,1.76,1.84,2.24,0.81,1.13,1.29,1.48,1.50,1.55, 1.61,1.62,1.66,1.70,1.77,1.84,0.84,1.24,1.30,1.48,1.51,1.55,1.61,1.63,1.67, 1.70,1.78,1.89
Second Data Set
The dataset provided comprises measurements of tensile strength, expressed in GigaPascals (GPa), for 69 individual carbon fibers that were subjected to tensile testing using a 20 mm gauge length. These measurements were obtained as part of a study conducted by Bader and Priest (1982), likely to investigate the material properties and performance of these carbon fibers under tension.
1.312,1.314,1.479,1.552,1.700,1.803,1.861,1.865,1.944,1.958,1.966,1.997, 2.006,2.021,2.027,2.055,2.063,2.098,2.140,2.179,2.224,2.240,2.253,2.270, 2.272,2.274,2.301,2.301,2.359,2.382,2.382,2.426,2.434,2.435,2.478,2.490, 2.511,2.514,2.535,2.554,2.566,2.570,2.586,2.629,2.633,2.642,2.648,2.684, 2.697,2.726,2.770,2.773,2.800,2.809,2.818,2.821,2.848,2.880,2.954,3.012, 3.067,3.084,3.090,3.096,3.128,3.233,3.433,3.585,3.858
Third Data Set
This dataset consists of recorded relief times (in minutes) for 20 patients who received an analgesic, as reported by Gross and Clark (1975). The dataset is likely used for analyzing the effectiveness of the analgesic treatment.
1.1,1.4,1.3,1.7,1.9,1.8,1.6,2.2,1.7,2.7,4.1,1.8,1.5,1.2,1.4,3,1.7,2.3,1.6,2
In the application of the distribution model to some real-life data sets, the results from the analysis revealed a great potential of the N-SIRD. the results are presented in Tables 2, 3 and 4. It can be easily observed from Tables 2–4, that N-SIRD have the smallest of all the information criterions i.e., AIC, BIC, CAIC and HIC values as compared to PrD, RaD, SED, SIED, WD and FD respectively. Hence, we can conclude that the “A” leads to better fit.
In applying a distribution to fitting some real-life datasets, the findings from the analysis have unveiled the remarkable potential of the N-SIRD. A thorough examination of the results, as presented in Tables 2–4, clearly indicated that N-SIRD exhibits the most favorable characteristics in terms of information criteria, including the AIC (Akaike Information Criterion), BIC (Bayesian Information Criterion), CAIC (Consistent AIC), and HIC (Hannan-Quinn Information Criterion).
Comparing N-SIRD to PrD, RaD, SED, SIED, WD, and FD, it becomes evident that N-SIRD consistently yields the lowest information criteria. In essence, the lower values of AIC, BIC, CAIC, and HIC for N-SIRD indicate that this model provides a more parsimonious and informative representation of the data, suggesting that it is a more suitable choice for modeling and explaining the underlying patterns in the dataset.
6 Conclusion
The New Sine Inverse Rayleigh Distribution, a new distribution with just one scale parameter, was introduced in the current study. The probability density function, cumulative density function, raw moment, moment generating function, quantile function, and some reliability characteristics like the survival and hazard rate functions of this new model were all given explicit mathematical expressions. The behavior of the estimates, the flexibility and the applicability of the new distribution were illustrated with a real data set and the results obtained revealed that the New Sine Inverse Rayleigh Distribution provides the better fit among all the compared related distributions.
References
Al-Anber N.J. (2020). Lomax-Rayleigh distribution: traditional and heuristic methods of estimation, in: Journal of Physics: Conference Series, vol. 1591, IOP Publishing, 1–12
Smith, R. L., and Naylor, J. (1987). A comparison of maximum likelihood and Bayesian estimators for the three-parameter Weibull distribution. Journal of the Royal Statistical Society Series C: Applied Statistics, 36(3), 358–369.
Bader, M. G., and Priest, A. M. (1982). Statistical aspects of fibre and bundle strength in hybrid composites. Progress in science and engineering of composites, 1129–1136.
Gross, A. J., and Clark, V. (1975). Survival distributions: reliability applications in the biomedical sciences. (No Title).
Al-Noor N. and Assi N., (2020). Rayleigh-Rayleigh distribution: properties and applications, in: Journal of Physics: Conference Series, vol. 1591, IOP Publishing. 1–15.
Greene M. J., (2019). The Epsilon-Skew Rayleigh Distribution. A Dissertation Submitted to the Graduate School University of Arkansas at Little Rock.
Ieren T.G., Abdulkadir S.S. and Issa A.A., (2020). Odd Lindley-Rayleigh distribution: its properties and applications to simulated and real life datasets, J. Adv. Math. Comput. Sci. 35(1) 63–88.
Kundu D. and Raqab M.Z., (2005). Generalized Rayleigh distribution: different methods of estimations, Comput. Stat. Data Anal. 49(1) 187–200.
Mahmood, Z. Chesneau, C. and Tahir, M.H. (2019). A new sine-G family of distributions: Properties and applications. Bull. Comput. Appl. Math., 7, 53–81.
Malik, A. S., and Ahmad, S. P. (2019). Transmuted Alpha Power Inverse Rayleigh Distribution: Properties and Application. Journal of Scientific Research, 11(2).
Merovci F., and Elbatal I., (2015). Weibull-Rayleigh distribution: theory and applications, Appl. Math. Inf. Sci. 9(5) 1–11.
Merovci F., (2013). Transmuted Rayleigh distribution, Aust. J. Stat. 42(1) 21–31.
Voda V.G., (2007). A new generalization of Rayleigh distribution, Reliab. Theory Appl. 2(6) 47–56.
Biographies

Ikwuoche John David obtained his B.Sc. and M.Sc. in 2009 and 2012 respectively, from the Department of Mathematics, Ahmadu Bello University, Zaria-Nigeria. In 2021 he obtained his Ph.D. in Statistics from the Department of Statistics, Ahmadu Bello University, Zaria-Nigeria. Currently he is a Senior Lecturer and Departmental Postgraduate Co-ordinator for Mathematics and Statistics programs in the Department of Mathematics and Statistics, Federal University Wukari, Nigeria.

Mathew Stephen received his Diploma and B.Sc. in Statistics from The Federal Polytechnic Mubi, Adamawa State and Federal University Wukari, Wukari Taraba State, Nigeria in years 2014 and 2018 respectively. Presently, he pursues an MSc in statistics at Federal University Wukari, Wukari Taraba State Nigeria. He is also a Graduate Assistant at Kwararafa University Wukari, Wukari Taraba State Nigeria.

Eghwerido Joseph Thomas received his B.Sc. and M.Sc. in Statistics from the Obafemi Awolowo University Ile-Ife in years 2008 and 2013 respectively. He then proceeded to the University of Benin Edo State, Nigeria where he obtained his Ph.D. in Industrial Mathematics with Options in Statistics in 2019. He is the Pioneer and current Head of the Department of Statistics, Federal University of Petroleum Resources, Effurun, Delta State, Nigeria. He has several publications in Spatial Statistics, Data Science, Portfolio Management, Probability Theory, and Distribution Theory. He is a member of the Editorial Team of Mathematical Reviews (MathSciNet), Mathematica Slovaca, Scientific African, Thailand Statistician, Fupre Journal of Scientific and Industrial Research, Gazi University Journal of Science, Scientometrics, Austrian Journal of Statistics, and lots more. He is a member of the Nigerian Statistical Association, Nigerian Mathematical Society, and International Biometric Society.
Journal of Reliability and Statistical Studies, Vol. 16, Issue 2 (2023), 255–268.
doi: 10.13052/jrss0974-8024.1623
© 2023 River Publishers