Performance Analysis of Continuous Casting System of Steel Industry
Sapna Saini, Jitender Kumar* and M. S. Kadyan
Department of Statistics & Operational Research, Kurukshetra University, Kurukshetra, India
E-mail: sapnahamidpur@gmail.com; khatkarjitu@gmail.com; mskadian@kuk.ac.in
*Corresponding Author
Received 15 February 2022; Accepted 25 July 2022; Publication 31 March 2023
Abstract
The continuous casting system is the most important to solidify the liquid steel in the steel industry. Steel is the backbone of civilization and modernization. So, there is a need to optimize the performance of continuous casting system of steel industry. Continuous casting system has six subsystems: “Pouring turret ladle”, “Tundish”, “Mold”, “Water spray chamber”, “Support roller” and “Torch cutter”. Series configuration is used to arrange these subsystems. The subsystem “Pouring turret ladle” is having three similar units. These units are operating in parallel. The subsystems “Tundish”, “Mold”, “Water spray chamber” and “Support roller” have a single unit. The subsystem “Torch cutter” contains two identical units: one is operative and other keep in cold standby. For all subsystems, the distribution of repair rates and failure rates of continuous casting system are taken as arbitrary distributions. Analysis of continuous casting system has been done by using supplementary variable technique. The numerical results of reliability measure of continuous casting system in terms of availability and profit have been computed by assuming exponential, Rayleigh and Weibull distributions.
Keywords: Continuous casting system, availability analysis, profit analysis, supplementary variable technique, steel industry.
1 Introduction
Due to advancement in science and engineering technology, the different kinds of mechanical systems used in industries is improved to make production faster, simpler and more efficient with their minimum production cost. This can be possible by failure-free functioning of mechanical systems. But, the possibilities of failure of mechanical systems cannot be denied completely. So, reliability engineering plays a vital role to maintain worthless failure of mechanical equipment and to enhance the smooth functioning of the whole industry.
Several researchers and engineers have been paid attention to mechanical system of different industries such as Arora and Kumar (1997) presented the availability of steam and power generation systems by Markov birth-death process. Singh and Mahajan (1999) analyzed reliability of utensils manufacturing unit by using Laplace transformation. Gupta at al. (2007) analyzed reliability and availability of serial processes of plastic-pipe manufacturing plant by using Runge-Kutta fourth order method. Sharma et al. (2009a) developed a computer network system model by supplementary variable technique. Kumar et al. (2009b) evaluated the performance analysis of ammonia synthesis unit in a fertilizer plant based on Markov birth-death process using probabilistic approach. Ram and Singh (2009c) analyzed the reliability characteristics of a complex engineering system under copula by supplementary variable technique. Garg et al. (2010) described the availability of combed silver production system by supplementary variable technique of yarn production plant. Ahmad et al. (2011a) discussed the configurational modeling and stochastic analysis of a complex repairable industrial system model carried out by using regenerative point technique. Kumar and Lata (2011b) analyzed the reliability of piston manufacturing system by using the fault tree method. Khanduja et al. (2012) demonstrated the steady state behavior and maintenance planning of the bleaching system bases on Markov birth-death process using probabilistic approach of a paper plant. Suleiman et al. (2013a) introduced stochastic analysis and performance of complex thermal power plant by using probabilistic approach. Modgil et al. (2013b) discussed the performance model based on Markov birth-death process for shoe upper manufacturing unit and calculated the long term availability of the system. Aggarwal et al. (2017) analyzed the performance of butter oil production system using genetic algorithm. Pandey et al. (2018) discussed reliability analysis critical subsystem by risk priority numbers of the dragline. Kumari et al. (2019a) has been presented stochastic model of skimmed-milk producing system of the milk plant using supplementary variable technique. Kumari et al. (2019b) studied profit analysis of butter producing system by using supplementary variable technique of the milk plant. Mehta et al. (2019c) analyzed reliability of sheet manufacturing unit with supplementary variable technique of a steel industry. Gupta et al. (2020a) discussed behavioral analysis of cooling tower in steam turbine by using Markov birth-death process of the power plant. Saini et al. (2020b) presented availability and profit of coking system by using supplementary variable technique. Garg et al. (2020c) analyzed reliability of ammonia synthesis unit by using Markov birth-death process in a fertilizer plant. Aggarwal et al. (2021a) analyzed the profit of a standby repairable system with priority to preventive maintenance. Kumari et al. (2021b) discussed performance analysis of curd (Dahi) producing system of milk plant using trapezoidal fuzzy numbers with different left and right heights. Kumari et al. (2021c) evaluated profit analysis of skimmed milk powder producing system of milk plant using trapezoidal fuzzy numbers with different left and right heights.
Before, 19th century ingot casting method was used to solidify the molten steel in the history of the steel industry. This method was time consuming, costly and energy consuming etc. So, after the 19th century a new method is created to solidify the liquid steel called continuous casting method with more benefits such as better yield, save energy and manpower, improvement of steel quality.
In the world, fifty-five percentage of liquid steel production is solidified by continuous casting process in continuous casting system of steel industry. Continuous casting is the process whereby the liquid steel is solidified into semi finished products such as slabs, billets and blooms etc. This is the most important system in the production of steel in the whole steel industry. That’s why there is need to study the behaviour of continuous casting system.
However, the authors/engineers Chakraborti et al. (2001), Marcial et al. (2003), Santos et al. (2005), Tavakoli (2018) and Shah (2019d) have been discussed the continuous casting mold using a pareto-converging genetic algorithm, modeling of the solidification process in a continuous casting installation for steel slabs, solidification mathematical model and a genetic algorithm in the optimization of strand thermal profile along the continuous casting of steel, the continuous casting process using distributed parameter identification approach-controlling the curvature of solid-liquid interface and optimized the continuous casting process in steel manufacturing industry respectively. The literature of continuous casting system revealed that the reliability measure of continuous casting system have not discussed by these researchers.
Therefore, the aim of the current study is to enhance the performance of continuous casting system of steel industry. Continuous casting system has six subsystems: “Pouring turret ladle”, “Tundish”, “Mold”, “Water spray chamber”, “Support roller” and “Torch cutter”. Series configuration is used to arrange these subsystems. The subsystem “Pouring turret ladle” is having three similar units. These units are operating in parallel. The subsystems “Tundish”, “Mold”, “Water spray chamber” and “Support roller” having single unit. The subsystem “Torch cutter” contains two identical units: one is operative and other keep in cold standby. For all subsystems, the distribution of repair rates and failure rates of continuous casting system are taken as arbitrary distributions. Analysis of continuous casting system has been done by using supplementary variable technique. The numerical results of reliability measure of continuous casting system in terms of availability and profit have been computed by assuming exponential, Rayleigh and Weibull distributions.
The paper has been organised into six sections. The present section comprises an introductory. Section 2 consists brief description of the system, assumptions, notations, and state-specification used in the system analysis. Mathematical modelling of the system has been carried out in Section 3. Section 4 concerns the profit analysis of the system. Numerical analysis of the continuous casting system is done by MATLAB in Section 5. Section 6 highlights the conclusion of the study.
2 System Description, Assumptions, Notations and State-specification
2.1 System Description
Pouring turret ladle (Subsystem A): – Subsystem “Pouring turret ladle” consists of three similar units are working in parallel. Pouring turret ladle is used to transfer the liquid steel. Failure of any one unit of subsystem A, continuous casting system works with reduce capacity. If any two units of subsystem A fail, then the system will completely fail.
Tundish (Subsystem B): – The Subsystem “Tundish” contain a single unit. The liquid steel which comes from Pouring turret ladle (Subsystem A) is transferred to Tundish via a pipe. Failure of this unit causes the system completely fails.
Mold (Subsystem C): – After Tundish (Subsystem B) liquid steel is pass through subsystem “Mold” (which contain cooled water) to solidify. Mold (subsystem C) has a single unit. This unit is fail then system is completely fails to work.
Water spray chamber (Subsystem D): – The subsystem “Water spray chamber” is having single unit. After Mold (subsystem C) the hot steel (strand) travels through water spray chamber which spray the water on it. Subsystem Water spray chamber fails to causes the system completely fails.
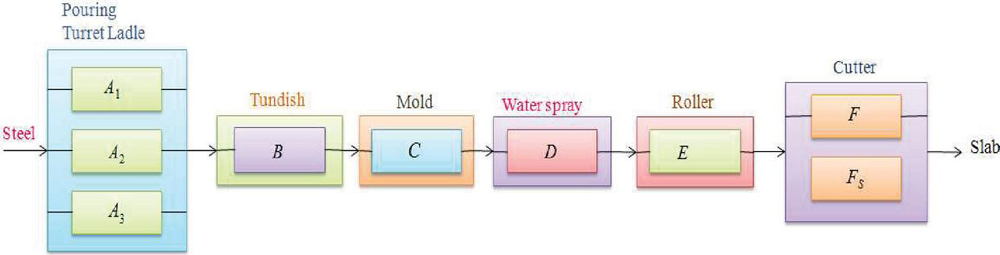
Figure 1 Process flow diagram of continuous casting system in steel industry.
Support roller (Subsystem E): – The subsystem “Support roller” contains a single unit. After Water spray chamber (subsystem D) the strand passes through straightening rolls and withdrawal rolls to give pre-shapes of the final strand. System is fail completely when subsystem “Support roller” stops to perform its work.
Torch cutter (subsystem F): – The subsystem “Torch cutter” is having two units: one is operative and another keep in cold standby. After “Support roller” (Subsystem E) steel slab obtained from the strand cut into predetermined lengths by torch cutter. Both units fail to causes the system completely fails.
2.2 Assumptions
1. Initially, system is operative with full capacity.
2. Repairmen always available for the repair facility.
3. Repaired unit operative as a new unit.
4. Two units are not simultaneously failed.
5. The failure rates and repair rates of continuous casting system are considered as general distributions.
2.3 Notations
: System units working with full capacity. .
: Failed units.
: Failure rates of units respectively.
: Repair rates of , units respectively.
: Probability that system is working at time t with full capacity of initially state 0.
: Probability that system is in state at time and have an elapsed repair time .
L: Laplace Transformation.
: Laplace Transformation of all probabilities set.
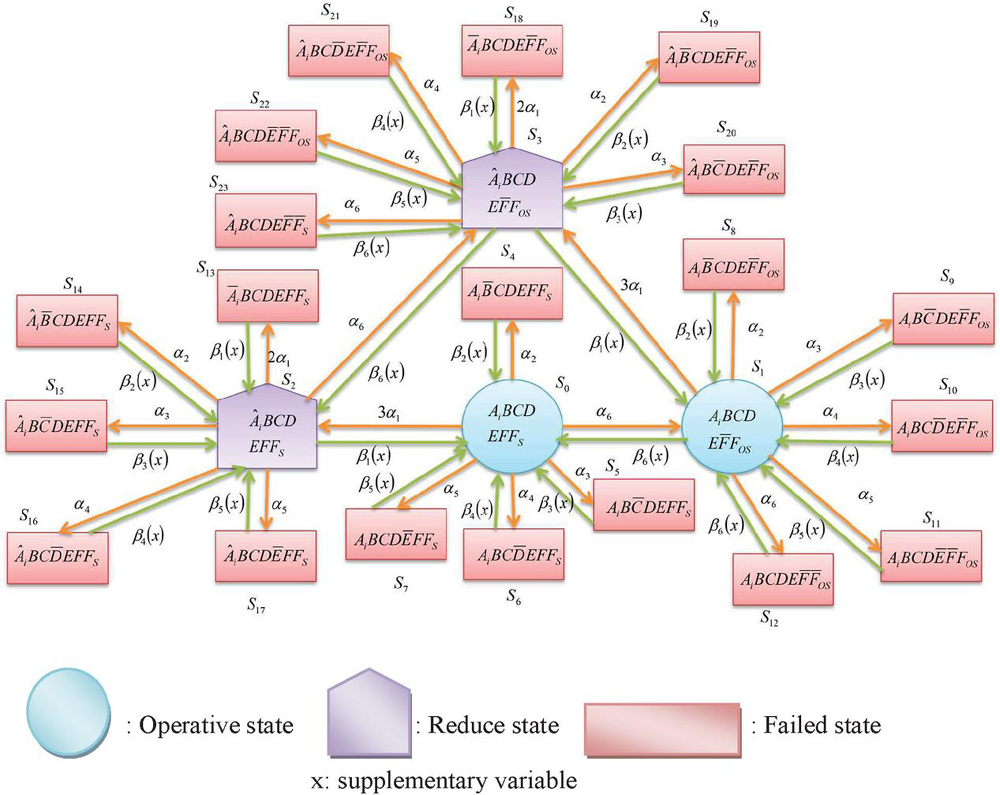
Figure 2 State-transition diagram of the continuous casting system.
2.4 State-specification
The states of the system are expressed as:
S: All subsystems of continuous casting system are good.
S: The operative unit of subsystem F is failed then the standby unit is in operative mode.
S: Any one unit of subsystem A is failed then system is operative in reduce capacity.
S: System operative in reduce capacity when any one unit of subsystem A is failed and operative unit of subsystem F is also failed and standby unit is in operative mode.
S: : Failure of any one subsystem causes the system completely failed due to series configuration.
3 Mathematical Modeling of the Continuous Casting System of the Steel Industry
The following difference-differential equations are associated with the model of continuous casting system is derived by using supplementary variable technique from the state transition diagram in Figure 2:
| (1) | |
| (2) | |
| (3) | |
| (4) | |
| (5) | |
| (6) | |
| (7) | |
| (8) | |
| (9) | |
| (10) | |
| (11) | |
| (12) | |
| (13) | |
| (14) | |
| (15) | |
| (16) | |
| (17) | |
| (18) | |
| (19) | |
| (20) | |
| (21) | |
| (22) | |
| (23) | |
| (24) |
Initial conditions
| (25) |
Boundary conditions
Equation (1) is first order linear differential equation while equations (2)–(24) are partial differential equations. The set of differential equations (1)–(24) together with the initial conditions (25) and boundary conditions (3) is called Chapman-Kolmogorov differential-difference equation. By using Laplace transformation from Equations (1)–(24) combined with the initial conditions (25) and boundary conditions (3) are used to obtain the reliability of continuous casting system of steel industry.
| (27) |
3.1 Particular Case
The Weibull density function for two parameters is given by:
Where .
Here, is shape parameter, are scale parameters. If , it reduce in exponential distribution and it become Rayleigh distribution if . For analysis the performance of continuous casting system by considering repair rates as exponentially distributed. Then, the difference differential Equations (1)–(24) are associated with the continuous casting system model is given below:
| (28) | |
| (29) | |
| (30) | |
| (31) | |
| (32) | |
| (33) | |
| (34) | |
| (35) | |
| (36) | |
| (37) | |
| (38) | |
| (39) | |
| (40) | |
| (41) | |
| (42) | |
| (43) | |
| (44) | |
| (45) | |
| (46) | |
| (47) | |
| (48) | |
| (49) | |
| (50) | |
| (51) |
Initial conditions
The set of steady state probabilities are achieved by taking ; and in Equations (28)–(51).
Here
By using the normalizing condition we obtain
| (52) |
Now, the Availability of system is:
| (53) |
4 Profit Analysis
The net profit of continuous casting system is derived by using Equation (3.1):
Profit
Profit
Steady state availability of the continuous casting system.
T Total revenue per unit up time of the continuous casting system.
C Total repair cost of the continuous casting system.
5 Numerical Analysis
To show the behavior of the continuous casting system, availability and profit analysis has been done by assuming exponential, Rayleigh and Weibull distributions.
Table 1 For Exponential distribution, failure rates impact on availability of subsystems of continuous casting system of steel industry
| Availability | |||||||
| 2 | 0.8541 | 0.8515 | 0.839 | 0.8395 | 0.8411 | 0.8439 | 0.8533 |
| 4 | 0.7577 | 0.7506 | 0.7349 | 0.736 | 0.7388 | 0.7424 | 0.7556 |
| 6 | 0.6942 | 0.6822 | 0.6676 | 0.6693 | 0.6729 | 0.6767 | 0.6906 |
| 8 | 0.6525 | 0.6362 | 0.624 | 0.6264 | 0.6304 | 0.6341 | 0.6477 |
| 10 | 0.6247 | 0.6052 | 0.5957 | 0.5986 | 0.6031 | 0.6064 | 0.6191 |
| 12 | 0.6064 | 0.584 | 0.5772 | 0.5806 | 0.5851 | 0.5882 | 0.6001 |
| 14 | 0.5938 | 0.5692 | 0.5649 | 0.5687 | 0.5733 | 0.576 | 0.587 |
| 16 | 0.5854 | 0.5588 | 0.5566 | 0.5607 | 0.5653 | 0.5679 | 0.5781 |
| 18 | 0.5793 | 0.5513 | 0.5511 | 0.5551 | 0.5599 | 0.5622 | 0.5719 |
| 20 | 0.575 | 0.5457 | 0.5455 | 0.5514 | 0.5559 | 0.5583 | 0.5674 |
Table 2 For Exponential distribution, failure rates impact on profit of subsystems of continuous casting system of steel industry
| Profit | |||||||
| 2 | 3770.5 | 3757.5 | 3695 | 3697.5 | 3705.5 | 3719.5 | 3766.5 |
| 4 | 3288.5 | 3253 | 3174.5 | 3180 | 3194 | 3212 | 3278 |
| 6 | 2971 | 2911 | 2838 | 2846.5 | 2864.5 | 2883.5 | 2953 |
| 8 | 2762.5 | 2681 | 2620 | 2632 | 2652 | 2670.5 | 2738.5 |
| 10 | 2623.5 | 2526 | 2478.5 | 2493 | 2515.5 | 2532 | 2595.5 |
| 12 | 2532 | 2420 | 2386 | 2403 | 2425.5 | 2441 | 2500.5 |
| 14 | 2469 | 2346 | 2324.5 | 2343.5 | 2366.5 | 2380 | 2435 |
| 16 | 2427 | 2294 | 2283 | 2303.5 | 2326.5 | 2339.5 | 2390.5 |
| 18 | 2396.5 | 2256.5 | 2255.5 | 2275.5 | 2299.5 | 2311 | 2359.5 |
| 20 | 2375 | 2228.5 | 2227.5 | 2257 | 2279.5 | 2291.5 | 2337 |
Table 3 For Exponential distribution, repair rates impact on availability of subsystems of the continuous casting system of steel industry
| Availability | |||||||
| 2 | 0.8691 | 0.8693 | 0.8705 | 0.8699 | 0.8701 | 0.87 | 0.8693 |
| 4 | 0.7811 | 0.7814 | 0.7848 | 0.7832 | 0.7839 | 0.7833 | 0.7811 |
| 6 | 0.722 | 0.7228 | 0.7286 | 0.7255 | 0.7267 | 0.7258 | 0.7222 |
| 8 | 0.6823 | 0.6839 | 0.6915 | 0.6872 | 0.6887 | 0.6875 | 0.6829 |
| 10 | 0.6558 | 0.6581 | 0.6671 | 0.6615 | 0.6635 | 0.6618 | 0.6565 |
| 12 | 0.638 | 0.641 | 0.6511 | 0.6443 | 0.6464 | 0.6445 | 0.6387 |
| 14 | 0.6258 | 0.6296 | 0.6402 | 0.6327 | 0.635 | 0.6327 | 0.6267 |
| 16 | 0.6175 | 0.622 | 0.6328 | 0.6246 | 0.6272 | 0.6247 | 0.6185 |
| 18 | 0.6116 | 0.6169 | 0.6277 | 0.6191 | 0.6216 | 0.619 | 0.6126 |
| 20 | 0.6079 | 0.6135 | 0.6241 | 0.6151 | 0.6176 | 0.6149 | 0.6087 |
Table 4 For Exponential distribution, repair rates impact on profit of subsystems of the continuous casting system of steel industry
| Profit | |||||||
| 2 | 3845.5 | 3846.5 | 3852.5 | 3849.5 | 3850.5 | 3850 | 3846.5 |
| 4 | 3405.5 | 3407 | 3424 | 3416 | 3419.5 | 3416.5 | 3405.5 |
| 6 | 3110 | 3114 | 3143 | 3127.5 | 3133.5 | 3129 | 3111 |
| 8 | 2911.5 | 2919.5 | 2957.5 | 2936 | 2943.5 | 2937.5 | 2914.5 |
| 10 | 2779 | 2790.5 | 2835.5 | 2807.5 | 2817.5 | 2809 | 2782.5 |
| 12 | 2690 | 2705 | 2755.5 | 2721.5 | 2732 | 2722.5 | 2693.5 |
| 14 | 2629 | 2648 | 2701 | 2663.5 | 2675 | 2663.5 | 2633.5 |
| 16 | 2587.5 | 2610 | 2664 | 2623 | 2636 | 2623.5 | 2592.5 |
| 18 | 2558 | 2584.5 | 2638.5 | 2595.5 | 2608 | 2595 | 2563 |
| 20 | 2539.5 | 2567.5 | 2620.5 | 2575.5 | 2588 | 2574.5 | 2543.5 |
Table 5 For Rayleigh distribution, failure rates impact on availability of subsystems of the continuous casting system of steel industry
| Availability | |||||||
| 2 | 0.8573 | 0.8548 | 0.8427 | 0.8431 | 0.8435 | 0.8431 | 0.8562 |
| 4 | 0.7694 | 0.7623 | 0.7475 | 0.7489 | 0.7498 | 0.7489 | 0.7675 |
| 6 | 0.7153 | 0.7035 | 0.6898 | 0.6921 | 0.6935 | 0.6921 | 0.7107 |
| 8 | 0.6861 | 0.666 | 0.6546 | 0.6577 | 0.6597 | 0.6577 | 0.6758 |
| 10 | 0.6606 | 0.6416 | 0.633 | 0.6367 | 0.639 | 0.6367 | 0.6538 |
| 12 | 0.6471 | 0.6255 | 0.6194 | 0.6236 | 0.6261 | 0.6236 | 0.6396 |
| 14 | 0.6384 | 0.6143 | 0.6092 | 0.6152 | 0.6179 | 0.6098 | 0.6304 |
| 16 | 0.6325 | 0.6067 | 0.6051 | 0.6098 | 0.6124 | 0.6098 | 0.624 |
| 18 | 0.6284 | 0.6009 | 0.6007 | 0.606 | 0.6088 | 0.606 | 0.6196 |
| 20 | 0.6256 | 0.5965 | 0.5960 | 0.6035 | 0.6061 | 0.6035 | 0.6164 |
Table 6 For Rayleigh distribution, failure rates impact on profit of subsystems of the continuous casting system of steel industry
| Profit | |||||||
| 2 | 3786.5 | 3774 | 3713.5 | 3715.5 | 3717.5 | 3715.5 | 3781 |
| 4 | 3347 | 3311.5 | 3237.5 | 3244.5 | 3249 | 3244.5 | 3337.5 |
| 6 | 3076.5 | 3017.5 | 2949 | 2960.5 | 2967.5 | 2960.5 | 3053.5 |
| 8 | 2930.5 | 2830 | 2773 | 2788.5 | 2798.5 | 2788.5 | 2879 |
| 10 | 2803 | 2708 | 2665 | 2683.5 | 2695 | 2683.5 | 2769 |
| 12 | 2735.5 | 2627.5 | 2597 | 2618 | 2630.5 | 2618 | 2698 |
| 14 | 2692 | 2571.5 | 2546 | 2576 | 2589.5 | 2549 | 2652 |
| 16 | 2662.5 | 2533.5 | 2525.5 | 2549 | 2562 | 2549 | 2620 |
| 18 | 2642 | 2504.5 | 2503.5 | 2530 | 2544 | 2530 | 2598 |
| 20 | 2628 | 2482.5 | 2480 | 2517.5 | 2530.5 | 2517.5 | 2582 |
Table 7 For Rayleigh distribution, repair rates impact on availability of subsystems of the continuous casting system of steel industry
| Availability | |||||||
| 2 | 0.872 | 0.8721 | 0.8737 | 0.8729 | 0.8731 | 0.8726 | 0.872 |
| 4 | 0.7918 | 0.7922 | 0.7967 | 0.7941 | 0.7954 | 0.7936 | 0.7918 |
| 6 | 0.7415 | 0.7426 | 0.7499 | 0.7454 | 0.7466 | 0.74455 | 0.7416 |
| 8 | 0.71 | 0.7119 | 0.7212 | 0.715 | 0.7167 | 0.7138 | 0.7101 |
| 10 | 0.6901 | 0.693 | 0.7035 | 0.6958 | 0.6979 | 0.6944 | 0.6902 |
| 12 | 0.6774 | 0.6812 | 0.6924 | 0.6838 | 0.6859 | 0.682 | 0.6774 |
| 14 | 0.669 | 0.6737 | 0.6853 | 0.6757 | 0.678 | 0.6738 | 0.6692 |
| 16 | 0.6635 | 0.669 | 0.6807 | 0.6704 | 0.6729 | 0.6685 | 0.6637 |
| 18 | 0.6598 | 0.666 | 0.6775 | 0.6668 | 0.6692 | 0.6647 | 0.6599 |
| 20 | 0.6571 | 0.664 | 0.6752 | 0.6642 | 0.6666 | 0.6621 | 0.6573 |
Table 8 For Rayleigh distribution, repair rates impact on profit of subsystems of the continuous casting system of steel industry
| Profit | |||||||
| 2 | 3860 | 3860.5 | 3868.5 | 3864.5 | 3865.5 | 3863 | 3860 |
| 4 | 3459 | 3461 | 3483.5 | 3470.5 | 3477 | 3468 | 3459 |
| 6 | 3207.5 | 3213 | 3249.5 | 3227 | 3233 | 3222.75 | 3208 |
| 8 | 3050 | 3059.5 | 3106 | 3075 | 3083.5 | 3069 | 3050.5 |
| 10 | 2950.5 | 2965 | 3017.5 | 2979 | 2989.5 | 2972 | 2951 |
| 12 | 2887 | 2906 | 2962 | 2919 | 2929.5 | 2910 | 2887 |
| 14 | 2845 | 2868.5 | 2926.5 | 2878.5 | 2890 | 2869 | 2846 |
| 16 | 2817.5 | 2845 | 2903.5 | 2852 | 2864.5 | 2842.5 | 2818.5 |
| 18 | 2799 | 2830 | 2887.5 | 2834 | 2846 | 2823.5 | 2799.5 |
| 20 | 2785.5 | 2820 | 2876 | 2821 | 2833 | 2810.5 | 2786.5 |
Table 9 For Weibull distribution, failure rates impact on availability of subsystems of the continuous casting system of steel industry
| Availability | |||||||
| 2 | 0.8764 | 0.8746 | 0.8647 | 0.8654 | 0.8659 | 0.8661 | 0.8759 |
| 4 | 0.7876 | 0.7823 | 0.7689 | 0.7632 | 0.7714 | 0.7716 | 0.7861 |
| 6 | 0.7241 | 0.7148 | 0.7011 | 0.7033 | 0.7049 | 0.7047 | 0.7212 |
| 8 | 0.6785 | 0.6656 | 0.6533 | 0.656 | 0.658 | 0.6575 | 0.6744 |
| 10 | 0.6457 | 0.6297 | 0.6194 | 0.6228 | 0.627 | 0.6243 | 0.6409 |
| 12 | 0.6221 | 0.6034 | 0.5954 | 0.5991 | 0.6018 | 0.6007 | 0.6168 |
| 14 | 0.6052 | 0.5858 | 0.5783 | 0.5824 | 0.5852 | 0.584 | 0.5991 |
| 16 | 0.5928 | 0.5697 | 0.566 | 0.5704 | 0.5734 | 0.5719 | 0.5862 |
| 18 | 0.5836 | 0.559 | 0.5571 | 0.5616 | 0.5647 | 0.5631 | 0.5767 |
| 20 | 0.5769 | 0.5499 | 0.5495 | 0.5553 | 0.5585 | 0.5567 | 0.5697 |
Table 10 For Weibull distribution, failure rates impact on profit of subsystems of the continuous casting system of steel industry
| Profit | |||||||
| 2 | 3882 | 3873 | 3823.5 | 3827 | 3829.5 | 3830.5 | 3879.5 |
| 4 | 3438 | 3411.5 | 3344.5 | 3316 | 3357 | 3358 | 3430.5 |
| 6 | 3120.5 | 3074 | 3005.5 | 3016.5 | 3024.5 | 3023.5 | 3106 |
| 8 | 2892.5 | 2828 | 2766.5 | 2780 | 2790 | 2787.5 | 2872 |
| 10 | 2728.5 | 2648.5 | 2597 | 2614 | 2635 | 2621.5 | 2704.5 |
| 12 | 2610.5 | 2517 | 2477 | 2495.5 | 2509 | 2503.5 | 2584 |
| 14 | 2526 | 2429 | 2391.5 | 2412 | 2426 | 2420 | 2495.5 |
| 16 | 2464 | 2348.5 | 2330 | 2352 | 2367 | 2359.5 | 2431 |
| 18 | 2418 | 2295 | 2285.5 | 2308 | 2323.5 | 2315.5 | 2383.5 |
| 20 | 2384.5 | 2249.5 | 2247.5 | 2276.5 | 2292.5 | 2283.5 | 2348.5 |
Table 11 For Weibull distribution, repair rates impact on availability of subsystems of the continuous casting system of steel industry
| Availability | |||||||
| 2 | 0.8877 | 0.8879 | 0.8887 | 0.8884 | 0.8886 | 0.8887 | 0.8878 |
| 4 | 0.8061 | 0.8065 | 0.8092 | 0.8081 | 0.8087 | 0.809 | 0.8062 |
| 6 | 0.747 | 0.7477 | 0.7524 | 0.7504 | 0.7515 | 0.7517 | 0.7474 |
| 8 | 0.7042 | 0.7053 | 0.7122 | 0.7091 | 0.7107 | 0.7108 | 0.7048 |
| 10 | 0.6732 | 0.675 | 0.6834 | 0.6794 | 0.6813 | 0.6813 | 0.6741 |
| 12 | 0.6507 | 0.6532 | 0.6627 | 0.658 | 0.6601 | 0.66 | 0.6517 |
| 14 | 0.6344 | 0.6375 | 0.6481 | 0.6423 | 0.6448 | 0.6444 | 0.6355 |
| 16 | 0.6223 | 0.6263 | 0.6373 | 0.6309 | 0.6337 | 0.633 | 0.6238 |
| 18 | 0.6135 | 0.6182 | 0.6296 | 0.6226 | 0.6253 | 0.6247 | 0.615 |
| 20 | 0.6069 | 0.6123 | 0.6239 | 0.6163 | 0.6192 | 0.6182 | 0.6086 |
Table 12 For Weibull distribution, repair rates impact on profit of subsystems of the continuous casting system of steel industry
| Profit | |||||||
| 2 | 3938.5 | 3939.5 | 3943.5 | 3942 | 3943 | 3943.5 | 3939 |
| 4 | 3530.5 | 3532.5 | 3546 | 3540.5 | 3543.5 | 3545 | 3531 |
| 6 | 3235 | 3238.5 | 3262 | 3252 | 3257.5 | 3258.5 | 3237 |
| 8 | 3021 | 3026.5 | 3061 | 3045.5 | 3053.5 | 3054 | 3024 |
| 10 | 2866 | 2875 | 2917 | 2897 | 2906.5 | 2906.5 | 2870.5 |
| 12 | 2753.5 | 2766 | 2813.5 | 2790 | 2800.5 | 2800 | 2758.5 |
| 14 | 2672 | 2687.5 | 2740.5 | 2711.5 | 2724 | 2722 | 2677.5 |
| 16 | 2611.5 | 2631.5 | 2686.5 | 2654.5 | 2668.5 | 2665 | 2619 |
| 18 | 2567.5 | 2591 | 2648 | 2613 | 2626.5 | 2623.5 | 2575 |
| 20 | 2534.5 | 2561.5 | 2619.5 | 2581.5 | 2596 | 2591 | 2543 |
Table 13 Impact of failure rates on availability of the continuous casting system follows Exponential, Rayleigh and Weibull distributions
| Time | Expoenetial | Rayleigh | Weibull |
| (In months) | Distribution | Distribution | Distribution |
| 2 | 0.8541 | 0.8573 | 0.8764 |
| 4 | 0.7577 | 0.7694 | 0.7876 |
| 6 | 0.6942 | 0.7153 | 0.7241 |
| 8 | 0.6525 | 0.6861 | 0.6785 |
| 10 | 0.6247 | 0.6606 | 0.6457 |
| 12 | 0.6064 | 0.6471 | 0.6221 |
| 14 | 0.5938 | 0.6384 | 0.6052 |
| 16 | 0.5854 | 0.6325 | 0.5928 |
| 18 | 0.5793 | 0.6284 | 0.5836 |
| 20 | 0.575 | 0.6256 | 0.5769 |
Table 14 Impact of failure rates on profit of continuous casting system follows Exponential, Rayleigh and Weibull distributions
| Time | Expoenetial | Rayleigh | Weibull |
| (In months) | Distribution | Distribution | Distribution |
| 2 | 3770.5 | 3786.5 | 3882 |
| 4 | 3288.5 | 3347 | 3438 |
| 6 | 2971 | 3076.5 | 3120.5 |
| 8 | 2762.5 | 2930.5 | 2892.5 |
| 10 | 2623.5 | 2803 | 2728.5 |
| 12 | 2532 | 2735.5 | 2610.5 |
| 14 | 2469 | 2692 | 2526 |
| 16 | 2427 | 2662.5 | 2464 |
| 18 | 2396.5 | 2642 | 2418 |
| 20 | 2375 | 2628 | 2384.5 |
Table 15 Impact of repair rates on availability of the continuous casting system follows Exponential, Rayleigh and Weibull distributions
| Time | Expoenetial | Rayleigh | Weibull |
| (In months) | Distribution | Distribution | Distribution |
| 2 | 0.8691 | 0.872 | 0.8877 |
| 4 | 0.7811 | 0.7918 | 0.8061 |
| 6 | 0.722 | 0.7415 | 0.747 |
| 8 | 0.6823 | 0.71 | 0.7042 |
| 10 | 0.6558 | 0.6901 | 0.6732 |
| 12 | 0.638 | 0.6774 | 0.6507 |
| 14 | 0.6258 | 0.669 | 0.6344 |
| 16 | 0.6175 | 0.6635 | 0.6223 |
| 18 | 0.6116 | 0.6598 | 0.6135 |
| 20 | 0.6079 | 0.6571 | 0.6069 |
Table 16 Impact of repair rates on profit of the continuous casting system follows Exponential, Rayleigh and Weibull distributions
| Time | Expoenetial | Rayleigh | Weibull |
| (In months) | Distribution | Distribution | Distribution |
| 2 | 3845.5 | 3860 | 3938.5 |
| 4 | 3405.5 | 3459 | 3530.5 |
| 6 | 3110 | 3207.5 | 3235 |
| 8 | 2911.5 | 3050 | 3021 |
| 10 | 2779 | 2950.5 | 2866 |
| 12 | 2690 | 2887 | 2753.5 |
| 14 | 2629 | 2845 | 2672 |
| 16 | 2587.5 | 2817.5 | 2611.5 |
| 18 | 2558 | 2799 | 2567.5 |
| 20 | 2539.5 | 2785.5 | 2534.5 |
6 Conclusion
Effect of failure rates and repair rates of the subsystems of continuous casting system namely: “Pouring turret ladle”, “Tundish”, “Mold”, “Water spray chamber”, “Support roller” and “Torch cutter” on availability and profit are expressed in Tables 1–16 for different parametric values of exponential, Rayleigh and Weibull distributions.
To see the impact of failure rate, the availability and profit of continuous casting system for exponential, Rayleigh and Weibull distributions are presented with in Tables 1&2, 5&6 and 9&10 respectively. These tables reflect that the availability and profit of continuous casting system steadily in reducing pattern with increases in the failure rates of subsystems . However, it is observed/found that “Tundish” i.e. subsystem has more significantly impact of failure rates of the continuous casting system as compare to other subsystems such as “Pouring turret ladle”, “Mold”, “Water spray chamber”, “Support Roller” and “Torch Cutter”.
The numerical results of the availability and profit of the continuous casting system for repair rates are presented in Tables 3&4, 7&8 and 11&12 for exponential, Rayleigh and Weibull distributions respectively. From these tables, it has been identified that the availability and profit of continuous casting system keep on increasing with increase in the repair rates of subsystems . Also, it is examined that the subsystem “Tundish” i.e. subsystem has significant effect of repair rates on availability and profit of the continuous casting system as compare to other subsystems “Pouring turret ladle”, “Mold”, “Water spray chamber”, “Support roller” and “Torch cutter”.
Also, the numerical analysis of availability and profit of continuous casting system are obtained for exponential, Rayleigh and Weibull distributions with respect to time in Tables 13–16 respectively. From these tables, it is observed that as time increasing, availability and profit both are decreasing. Also, numerical values for availability and profit of continuous casting system are more for Weibull distribution if and for Rayleigh distribution if .
The aim of the present paper is to identify the most sensitive subsystem of continuous casting system. By controlling the failure rate of the most sensitive subsystem, the performance of continuous casting system can be enhanced. By increasing the repair rate of sensitive subsystem the availability and profit of the steel industry can also enhance. The availability and profit analysis of steel industrial systems can help the management of steel industry in taking timely decision for its smooth functioning and will help to reduce the costs of production
The above numerical interpretation of effect of failure rates and repair rates on overall availability and profit of continuous casting system, it has been concluded that to optimized (availability & profit) the performance of the continuous casting system of the steel industry, there is need to control the failure rate of subsystem “Tundish” i.e. subsystem . In addition, if random variables of continuous casting system are associated with Weibull distribution if and for Rayleigh distribution if , continuous casting system can be made more availability for utilizing and profitable.
Limitation
Some more distributions can be used for the analysis purpose.
Acknowledgement
The authors are thankful to the reviewers for their valuable comments that led to an improved presentation of the paper.
References
Aggarwal, A.K., Singh, V. and Kumar, K. (2017): Availability analysis and performance optimization of a butter oil production system: a case study, International Journal of Systems Assurance Engineering and Management, 8(1), 538–554.
Aggarwal, C., Ahlawat, N. and Malik, S.C. (2021a): Profit analysis of a standby repairable system with priority to preventive maintenance and rest of servers between repairs, Journal of Reliability and Statistical Studies, 14(1), 57–81.
Ahmad, A., Lakhan, C. and Gourav, V. (2011a): Configurational modeling and stochastic analysis of a complex repairable industrial system model, Journal of Reliability and Statistical Studies, 4(1), 119–127.
Arora, N. and Kumar, D. (1997): Availability analysis of steam and power generation systems in the thermal power plant, Microelectron Reliability, 37(5), 795–799.
Chakraborti, N., Kumar, R. and Jain, D. (2001): A study of the continuous casting mold using a pareto-converging genetic algorithm, Applied Mathematical Modelling, 25(2001), 287–297.
Garg, S., Singh, J. and Singh, D.V. (2010): Mathematical modeling and performance analysis of conmbed yarn production system: Based on few data, Journal of Applied Mathematical Modelling, 34(11), 3300–3308.
Garg, T.K., Garg, R. and Jindal, S. (2020c): Reliability analysis of ammonia synthesis unit in a fertilizer plant using CAS mathematica. International Journal of Advanced Scientific and Technical Research, 29(6), 397–409.
Gupta, N., Saini, M. and Kumar, A. (2020a): Behavioral analysis of cooling tower in steam turbine power plant using reliability, availability, maintainability and dependability Investigation, Journal of Engineering Science and Technology Reviews, 13(2), 191–198.
Gupta, P., Lal, A.K., Sharma, R.K. and Singh, J. (2007): Analysis of reliability and availability of serial processes of plastic-pipe manufacturing plant: A case study, International Journal of Quality and Reliability Management, 24(4), 404–419.
Khanduja, R., Tewari, P.C. and Kumar D. (2012): Steady state behavior and maintenance planning of bleaching system in the paper plant, International Journal of Industrial Engineering, 7(12), 39–44.
Kumar, A. and Lata, S. (2011b): Reliability analysis of piston manufacturing system, Journal of Reliability and Statistical Studies, 4(2) 43–55.
Kumari, P., Kadyan, M.S. and Kumar, J. (2019a): Performance analysis of skimmed milk-producing system of milk plant using supplementary variable technique, Life Cycle Reliability and Safety Engineering, 8(3), 227–242.
Kumari, P., Kadyan, M.S. and Kumar, J. (2019b): Profit analysis of butter–oil (ghee) producing system of milk plant using supplementary variable technique, International Journal of Systems Assurance Engineering and Management, 10(6), 1627–1638
Kumari, P., Kadyan, M.S. and Kumar, J. (2021b): Performance analysis of curd (Dahi) producing system of milk plant by using trapezoidal fuzzy numbers with different left and right heights, International Journal of Systems Assurance Engineering and Management, 12(4), 1348–1361.
Kumari, P., Kadyan, M.S. and Kumar, J. (2021c): Profit analysis of skimmed milk powder producing system of milk plant using trapezoidal fuzzy numbers with different left and right heights, Life Cycle Reliability and Safety Engineering, 10(2), 387–401.
Kumar, S., Tewari, P.C. and Kumar, S. (2009b): Performance evaluation and availability analysis of ammonia synthesis unit in a fertilizer plant, Journal of Industrial Engineering International, 5(9), 17–26.
Marcial, G., Marcial, B., Goldsmith, Andrea, P.A., Elena, F.B. and Eduardo, N.D. (2003) Modeling of the solidification process in a continuous casting installation for steel slabs, Metallurgical and Materials Transactions, (34B), 455–473.
Mehta, M., Singh, J. and Singh, M. (2019c): Reliability analysis of sheet manufacturing unit of a steel industry, Advances in Industrial and Production Engineering, 59(10), 978–981.
Modgil, V., Sharma, S.K. and Singh, J. (2013b): performance modeling and availability analysis of shoe upper manufacturing unit, International Journal of Quality and Reliability Management, 30(8), 816–831.
Pandey, P., Mukhopadhyay, A.K. and Chattopadhyay, S. (2018): Reliability analysis and failure rate evaluation for critical subsystems of the dragline, Journal of Brazilian of Society of Mechanical Sciences and Engineering, 40(2), 50–60.
Ram, M. and Singh, S.B. (2009c): Reliability characteristics of a complex engineering system under copula, Journal of Reliability and Statistical Studies, 2(1), 91–102.
Saini, S., Kumar, J. and Kadyan, M.S. (2020b): Availability and profit analysis of coking system by using supplementary variable technique, International Journal of Statistics and Reliability Engineering, 7(3), 382–392.
Santos, C.A., Cheung, N., Garcia, A. and Spim, J.A. (2005): Application of a solidification mathematical model and a genetic algorithm in the optimization of strand thermal profile along the continuous casting of steel, Materials and Manufacturing Processes, 20, 421–434. ISSN: 1042–6914.
Shah, D. (2019d): Optimization of continuous casting process in steel manufacturing industry, Multidisciplinary International Research journal of Gujarat Technology University, 1(2), ISSN: 2581–8880.
Sharma, D., Garg, R.R. and Gupta, A.K. (2009a): Performance measures of a computer network system, Journal of Theoretical and Applied information Technology, 8(2), 187–202.
Singh, J. and Mahajan, P. (1999): Reliability of utensils manufacturing plant-A case study, Operational Research Society of India, 36(3), 260–269.
Suleiman, K., Ali, U.A. and Yusuf, I. (2013a): Stochastic analysis and performance evaluation of complex thermal power plant, Innovative Systems Design and Engineering, 4(15), 21–31.
Tavakoli, R. (2018): Thermal optimization of the continuous casting process using distributed parameter identification approach- controlling the curvature of solid-liquid interface, International Journal of Advanced Manufacturing Technology, 94, 1101–1118.
Biographies

Sapna Saini is a research scholar in Department of Statistics & Operational Research, Kurukshetra University, Kurukshetra, India. She obtained her M. Sc. (Statistics) degree in 2014 from Kurukshetra University, Kurukshetra, India. Now, she is doing Ph.D. from Department of Statistics & Operational Research, Kurukshetra University, Kurukshetra, India. Her research interest is reliability modeling and analysis.

Jitender Kumar specializes in Reliability Modeling and Analysis. His research papers appeared in different international repute journals. He has presented his research work in number of national and international conferences in India and Abroad. He is secretary of Indian Association of Reliability and Statistics (IARS). He plays role of managing editor of International Journal of Statistics and Reliability Engineering. He is guiding a number of Doctoral candidates. UGC sanctioned him a major research project. Dr. Kumar is a reviewer for reputed journals.

M. S. Kadyan specializes in Reliability Modeling and Analysis. He is a published author in national and International Journals of repute. Dr. Kadyan has attended a number of conferences in India and outside. He is vice-president of Indian Association of reliability and statistics and assistant editor of international journal of statistics and reliability engineering. He is guided a number of M.Phil and Ph.D. candidates. UGC sanctioned him a major research project for 2013–2016. He is reviewer of various international journals.
Journal of Reliability and Statistical Studies, Vol. 15, Issue 2 (2022), 693–722.
doi: 10.13052/jrss0974-8024.15212
© 2023 River Publishers