Reliability Index of Simply Supported Beam Based on HL Method
M. Tirumala Devi, T. Sumathi Uma Maheshwari and A. Satyanarayana*
Department of Mathematics, Kakatiya University, Warangal, Telanagana State, 506009, India
E-mail: oramdevi@yahoo.com; tsumathiuma@gmail.com; satyamanumalla@gmail.com
∗Corresponding Author
Received 26 July 2021; Accepted 21 January 2022; Publication 31 March 2023
Abstract
In this paper, reliability of simply supported I-beam is studied under point load at the mid-point of span. Reliability index has been obtained by using Hasofer-Lind method. In the analysis, yield strength of material, depth of the section and load are considered as basic random variables and those are assumed to follow normal distribution. Non-linear limit state surface function has been considered. Derived design point in each case and found the reliability.
Keywords: Reliability, I-beam, reliability index, non-linear limit state function, stress, strength, load, normal distribution.
Notations
| R | Reliability |
| , , | Reliability indices |
| C | Strength of the beam |
| S | Stress of the beam |
| M | Marginal function/Failure function |
| Probability of failure | |
| Design point or Check point | |
| The minimum distance from origin to failure surface | |
| Coordinates of design point | |
| Point load | |
| Failure surface | |
| Depth of the beam | |
| Strength of the material | |
| Thickness of the web | |
| Cumulative standard normal distribution function | |
| Direction cosines along axes in the normalized co-ordinate | |
| system | |
| Basic variables | |
| Coordinates in the normalized coordinate system | |
| Mean yield strength of material | |
| Mean of load | |
| Standard deviation of material yield strength | |
| Standard deviation of load | |
| Mean of | |
| Standard deviation of | |
| Coefficient of variation of | |
| Coefficient of variation of |
1 Introduction
The goal of a structural designer is to plan a design for a safe and economical structure such that the structure should fulfil its intended purpose. A structural design is developed by calculating internal forces and moments on components of the structure. In engineering design, reliability is the probability that the design meets certain demands under given conditions. For stability of a structure, it should be designed such that it satisfies demands towards loads on the structure. The resistance capacity (C) of a structure and stress of the beam (S) then structure is safe if CS, mathematically expressed as C-S0. MC-S is known as limit state function or failure function. M is a function of n basic design variables x, x… x. The function divides the design space into safe zone and unsafe zone with respect to C and S. For safe region M0 and for unsafe region M0. Since the resistance of structural element and loads acting on it are a function of several variables, most of the variables are random in nature. Hence probabilistic approach is suitable in the design of a structure. Structural safety deals with violation of ultimate or serviceability limit states of the structure.
Reliability is a branch of structural engineering and is the probabilistic assessment and analysis of design variables. Reliability index is the measure of probability of failure of an element or structure. It was defined by Cornell [18] as where M be the limit state function. If the design variables are normally distributed then , where is the cumulative standard normal distribution function.
Syed Hooman Gasemi and Andrezej S Nowak [7] calculated the reliability indices for segments of circular tunnel and designed as per manual report of tunnel. Design codes have been derived to conform safety level of the structure. Resistance and load factor design approaches were used, which measures the safety of the structure in terms of reliability indices. Karthik C B et al. [8] analysed reliability for structures made by frames. Loads and strength assumed to follow required distribution. Limit state functions for bending, shear and deflection are considered. Performance functions are studied by Rackwitz algorithm and reliability index was derived using a Matlab programme. O J Aladegboye et al. [9] Used First Order Reliability Method (FORM) for the analysis of simply supported concrete beam. Depth, length and concrete strength are considered as parameters. The result of the model clears that formal deterministic way of calculating safety factor failed to put into consideration of uncertainties in depth, length and strength. E Bastidas and A.H. Soubra [10] were made reliability analysis by taking example for comparison of the Second and First Order Reliability Methods. In the analysis, limit state function is approximated by Taylor series approximation at mean values of design variables. Christopher D. Eamon and Elinjensen [11] were estimated reliability for 0–5 hours of fire exposer using Monte Carlo Simulation Method and cleared that reliability decreases non-linearly with function of time. A.Satyanarayana et al. [19] derived reliability of simply supported beam under uniformly distributed load. Span, width and depth of the beam are considered to follow normal distribution. Bending strength, loads, tolerance of depth of the beam, width of the beam taken into account in the analysis. Reliability analysis has been done with respect to material strength, load, tolerance of depth.
In this article, simply supported I-beam under point load at mid-point of span is taken for the analysis of reliability. Strength of the material, depth of the section and load are assumed to follow normal distribution. Non-linear limit state function is taken for the analysis and derived design points as per required reliability.
This work may be useful in designing simply supported I-beams which are used in structures.
2 Methodology
Cornel reliability index is unique for equivalent linear failure functions of basic variables. If the safety margin of a function is not a linear function then for its equivalent non-linear functions there may be different values for the Cornel reliability index .
where are un-correlated then the reliability index by Cornel for the failure function is
Consider the equivalent failure function, , then the Cornel reliability index, .
If the linearization of the safety margin, is done about and then
It is clear that and are not equal. Hence, in the case of non-linear failure functions, the Cornel’s reliability index is not invariant.
There are disadvantages also in the First Order Second Moment Method (FOSM). In the linearization process of non-linear failure function about mean values, there are truncation errors take place by neglecting higher order terms in the Taylor’s series approximation. In many structural engineering problems generally the mean point is away from the failure space. Thus there are unacceptable errors present in the process.
2.1 Model Assumptions
(i) Limit state function is taken as a function of load acting on the beam, strength of the material, depth of the beam and thickness of web.
(ii) All variables are to be considered to follow normal distribution.
2.2 Model Description
Hasofer and Lind Method
Let be a failure surface function of independent basic variables . The basic variables are transformed using the relation
where and be the mean and the standard deviation of . Here the co-ordinate system is said to be normalized co-ordinate system. The failure surface function is written in the normalized co-ordinate system. Reliability index was defined by Hasofer and Lind, which is the minimum distance from origin to the failure surface in the Z co-ordinate system. The point D where the perpendicular meets the surface is called check point or design point.
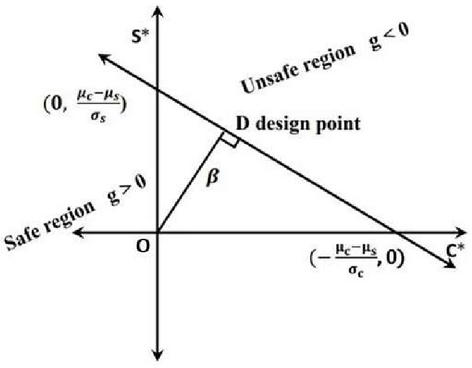
Figure 1 Design point.
In the method, the failure surface is approximated by a hyper tangent plane to the surface. Safety measure obtained in the method is invariant for equivalent failure functions. In case of failure function is linear, the reliability index of Cornell, which agrees with the value defined by Hasofer and Lind. The failure surface divides the design space into two regions, safe region and unsafe region. If the failure surface is concave and this side having origin then the approximation for D will be on safer side, otherwise it will be on unsafe side. Let be a nonlinear limit state function in the original variable space and be the non-linear limit state function in the normalized co-ordinate space.
Let D be the point and the distance from a point on the failure surface to the origin such that .
The problem reduces to finding of minimum values for , where and will be minimized subject to the condition
Consider the Lagrange function
For minimization , where and .
Implies and .
Then , where is called gradient vector.
Therefore .
Let
| (1) |
where be the minimum distance from the origin to the limit state surface.
Since .
Therefore .
Using Equation (1), the minimum distance .
Therefore reliability index
| (2) | ||
From Equation (2), it is known that and , where , , and are the direction cosines along axes in the normalized co-ordinate system.
Iterative method can be used to find minimum value for for a non-linear failure surface function.
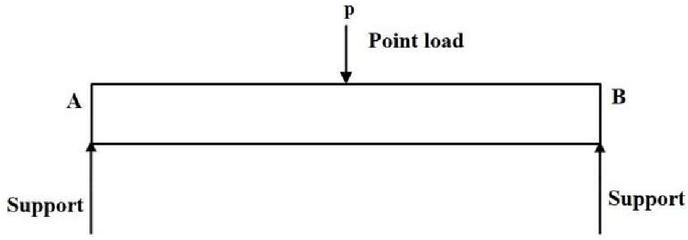
Figure 2 Simply supported beam subjected to the point load at midpoint of span.
3 Calculation of Reliability
Consider the simply supported I-beam AB under limit state of shear and the beam is subjected to the point load at midpoint of span. Design variables are normally distributed. Let and be the vector of mean and standard deviations of load , shear strength of the material and depth of the beam respectively. Assume that is thickness of the web and deterministic variable such that
| (3) |
Maximum shear force and resistance to the shear .
The beam fails if .
Therefore the equation of failure surface is given by
| (4) |
Using the Equation (3), the failure surface function (4) in the normalized co-ordinate system is given by
| (5) |
Where , , .
Since
| (6) |
Therefore the relation obtained from Equations (5) and (6) is
| (7) |
Considering initial values for and as , , , for the iterative method. Matlab is used for the calculations.
4 Numerical Results
4.1 Mean Load Vs Reliability
From the Table 2 it is noticed that reliability was computed for different values of mean load on the beam and observed that the increment in load from 2000N to 7000N at standard deviation 1000N effects the decrease of reliability index from 3.721 to 0.136 and reliability from 0.9999 to 0.554089.
Table 2 Simply supported beam subjected to the point load at midpoint of span-1
| . | ||||||
| R | ||||||
| 2000 | 108.8 | 46.4 | 4791.3 | 3.721 | 0.000099 | 0.999900 |
| 2500 | 107.0 | 45.8 | 4989.6 | 3.348 | 0.000407 | 0.999593 |
| 3000 | 105.3 | 45.3 | 5194.8 | 2.978 | 0.001451 | 0.998549 |
| 3500 | 103.5 | 44.7 | 5407.1 | 2.611 | 0.004514 | 0.995486 |
| 4000 | 101.7 | 44.1 | 5626.6 | 2.247 | 0.012320 | 0.987680 |
| 4500 | 99.9 | 43.5 | 5853.2 | 1.887 | 0.029580 | 0.970419 |
| 5000 | 98.1 | 42.8 | 6087.0 | 1.530 | 0.063009 | 0.936992 |
| 5500 | 96.3 | 42.2 | 6327.9 | 1.177 | 0.119600 | 0.880402 |
| 6000 | 94.4 | 41.6 | 6576.0 | 0.826 | 0.204400 | 0.795598 |
| 6500 | 92.6 | 40.9 | 6831.1 | 0.479 | 0.316000 | 0.684031 |
| 7000 | 90.7 | 40.3 | 7093.2 | 0.136 | 0.445911 | 0.554089 |
Table 3 Simply supported beam subjected to the point load at midpoint of span-2
| . | ||||||
| R | ||||||
| 2000 | 113.3 | 47.7 | 4308.7 | 4.179 | 0.000015 | 0.999954 |
| 2500 | 111.0 | 47.1 | 4544.2 | 3.750 | 0.000084 | 0.999912 |
| 3000 | 108.8 | 46.4 | 4789.0 | 3.327 | 0.000439 | 0.999561 |
| 3500 | 106.6 | 45.7 | 5043.1 | 2.910 | 0.001807 | 0.998193 |
| 4000 | 104.3 | 44.9 | 5306.5 | 2.499 | 0.006227 | 0.993773 |
| 4500 | 102.1 | 44.2 | 5579.1 | 2.093 | 0.018175 | 0.981826 |
| 5000 | 99.8 | 43.4 | 5860.6 | 1.693 | 0.045228 | 0.954773 |
| 5500 | 99.6 | 42.7 | 6150.8 | 1.299 | 0.096972 | 0.903028 |
| 6000 | 95.4 | 41.9 | 6499.6 | 0.910 | 0.181411 | 0.818589 |
| 6500 | 93.1 | 41.1 | 6756.7 | 0.527 | 0.299097 | 0.700903 |
| 7000 | 90.9 | 40.3 | 7071.8 | 0.156 | 0.440382 | 0.559618 |
Table 3 shows that, if mean point load decreases from 2000N to 7000N at standard deviation 800N then reliability changes from 0.999954 to 0.559618 and reliability index changes from 4.179 to 0.156. Mean shear strength of material Vs Reliability.
Table 4 Mean shear strength of material Vs Reliability-1
| . | ||||||
| R | ||||||
| 115 | 132.0 | 48.4 | 6188.6 | 3.815 | 0.000068 | 0.999932 |
| 110 | 126.5 | 47.6 | 6051.5 | 3.589 | 0.000166 | 0.999834 |
| 105 | 120.9 | 46.9 | 5904.3 | 3.355 | 0.000397 | 0.999603 |
| 100 | 115.2 | 46.1 | 5747.4 | 3.114 | 0.000923 | 0.999077 |
| 95 | 109.4 | 45.4 | 5581.5 | 2.866 | 0.002078 | 0.997922 |
| 90 | 103.5 | 44.7 | 5407.1 | 2.611 | 0.004514 | 0.995486 |
| 85 | 97.4 | 44.0 | 5225.0 | 2.350 | 0.009387 | 0.990613 |
| 80 | 91.3 | 43.4 | 5035.6 | 2.082 | 0.018671 | 0.981329 |
| 75 | 84.4 | 42.8 | 4839.7 | 1.810 | 0.035148 | 0.964852 |
| 70 | 78.6 | 42.2 | 4637.9 | 1.532 | 0.062761 | 0.937239 |
| 65 | 71.1 | 41.7 | 4430.6 | 1.249 | 0.105833 | 0.894168 |
| 60 | 95.6 | 41.3 | 4218.4 | 0.961 | 0.168276 | 0.831724 |
| 55 | 58.9 | 40.8 | 4001.7 | 0.670 | 0.251429 | 0.748571 |
| 50 | 52.2 | 40.4 | 3781.0 | 0.374 | 0.354202 | 0.645798 |
| 45 | 45.5 | 40.1 | 3556.6 | 0.075 | 0.470107 | 0.529893 |
As per the Table 4 material strength changes from 115 N/mm to 45 N/mm reliability index decreases from 3.815 to 0.075 and reliability of the structural member decreases from 0.999932 to 0.529893.
Table 5 Mean shear strength of material Vs Reliability-2
| . | ||||||
| R | ||||||
| 115 | 126.1 | 49.5 | 6345.3 | 3.958 | 0.000039 | 0.999961 |
| 110 | 120.9 | 48.6 | 6218.5 | 3.728 | 0.000097 | 0.999904 |
| 105 | 115.6 | 47.8 | 6079.3 | 3.494 | 0.000238 | 0.999762 |
| 100 | 110.3 | 47.0 | 5927.7 | 3.252 | 0.000573 | 0.999427 |
| 95 | 104.8 | 46.2 | 5764.0 | 3.001 | 0.001345 | 0.998655 |
| 90 | 99.3 | 45.4 | 5588.4 | 2.742 | 0.003053 | 0.996947 |
| 85 | 93.6 | 44.6 | 5401.4 | 2.474 | 0.006680 | 0.993320 |
| 80 | 87.9 | 43.9 | 5203.5 | 2.199 | 0.013939 | 0.986061 |
| 75 | 82.0 | 43.3 | 4999.3 | 1.916 | 0.027683 | 0.972318 |
| 70 | 76.1 | 42.6 | 4777.3 | 1.625 | 0.052081 | 0.947919 |
| 65 | 70.0 | 42.0 | 4550.3 | 1.328 | 0.092089 | 0.907911 |
| 60 | 60.0 | 41.5 | 4314.9 | 1.025 | 0.152682 | 0.847318 |
| 55 | 57.9 | 41.0 | 4071.9 | 0.715 | 0.237305 | 0.762696 |
| 50 | 51.6 | 40.5 | 3821.7 | 0.400 | 0.344578 | 0.655422 |
It is evident from the Table 5 that material strength changes from 115 N/mm to 50 N/mm causes decrease in the reliability from 0.999961 to o.655422 and reliability index from 3.958 to 0.4.
4.2 Mean Depth of the Beam Vs Reliability
In the Table 6 reliability changes from 0.999984 to 0.784944 and reliability index from 4.159 to 0.789 when there is a change in mean depth of the beam from 85 mm to 45 mm at standard deviation 4 mm.
Table 6 Mean depth of the beam Vs Reliability-1
| . | ||||||
| R | ||||||
| 85 | 76.3 | 86.3 | 4874.6 | 4.159 | 0.000016 | 0.999984 |
| 80 | 74.2 | 81.5 | 4954.0 | 3.949 | 0.000039 | 0.999961 |
| 75 | 71.6 | 76.7 | 5019.8 | 3.696 | 0.000110 | 0.999891 |
| 70 | 68.8 | 71.9 | 5058.7 | 3.389 | 0.000351 | 0.999649 |
| 65 | 65.3 | 67.0 | 5051.5 | 3.089 | 0.001004 | 0.998996 |
| 60 | 61.4 | 62.0 | 4973.7 | 2.575 | 0.005012 | 0.994988 |
| 55 | 57.2 | 56.9 | 4799.3 | 2.053 | 0.020036 | 0.979964 |
| 50 | 52.8 | 51.5 | 4508.0 | 1.453 | 0.073112 | 0.926889 |
| 45 | 48.8 | 45.9 | 4093.1 | 0.789 | 0.215056 | 0.784944 |
Table 7 Mean depth of the beam Vs Reliability-2
| . | ||||||
| R | ||||||
| 90 | 78.2 | 90.3 | 4783.0 | 4.340 | 0.000007 | 0.999993 |
| 85 | 76.5 | 85.3 | 4866.6 | 4.168 | 0.000015 | 0.999985 |
| 80 | 74.5 | 80.4 | 4945.7 | 3.962 | 0.000037 | 0.999963 |
| 75 | 72.1 | 75.4 | 5012.7 | 3.713 | 0.000102 | 0.999898 |
| 70 | 69.2 | 70.6 | 5055.4 | 3.412 | 0.000322 | 0.999678 |
| 65 | 65.9 | 65.5 | 5056.3 | 3.049 | 0.001148 | 0.998852 |
| 60 | 62.0 | 60.5 | 4991.4 | 2.612 | 0.004501 | 0.995499 |
| 55 | 57.8 | 55.5 | 4831.6 | 2.093 | 0.018175 | 0.981825 |
| 50 | 53.3 | 50.4 | 4548.9 | 1.490 | 0.068112 | 0.931888 |
| 45 | 49.0 | 45.2 | 4126.2 | 0.813 | 0.208109 | 0.791891 |
| 40 | 45.4 | 40.0 | 3569.4 | 0.083 | 0.466926 | 0.533074 |
From the Table 7 it is clear that at standard deviation 2 mm of depth of the beam and mean depth from 90 mm to 40 mm reliability changes from 0.999993 to 0.533074 and reliability index changes from 4.34 to 0.083.
5 Conclusion
Reliability analysis of simply supported I-beam under limit state shear and subjected to the point load at mid-point of span has been done by Hasofer and Lind method. In the analysis, strength of the material, depth of the section and load are assumed to follow normal distribution. Studied non-linear limit state function and normalized the basic variables and derived the iterative function to find reliability index. Used Matlab code for the design points at each level, calculated reliability and reliability index at each design point. From the calculations, the increment in load on the structural member from 2000N to 7000N at standard deviation 1000N effects the decrease of reliability index from 3.721 to 0.136 and reliability from 0.9999 to 0.554089. Increment in load from 2000N to 7000N at standard deviation 1000N effects the decrease of reliability index from 3.721 to 0.136 and reliability from 0.9999 to 0.554089. If the material strength changes from 115 N/mm to 45 N/mm reliability index decreases from 3.815 to 0.075 and reliability of the structural member decreases from 0.999932 to 0.529893. If the material strength changes from 115 N/mm to 50 N/mm causes decrease in the reliability from 0.999961 to 0.655422 and reliability index from 3.958 to 0.4. The reliability changes from 0.999984 to 0.784944 and reliability index from 4.159 to 0.789 when there is a change in mean depth of the beam from 85 mm to 45 mm at standard deviation 4 mm. At the standard deviation 2 mm of depth of the beam and mean depth from 90 mm to 40 mm reliability changes from 0.999993 to 0.533074 and reliability index changes from 4.34 to 0.083.
Future Scope of Work
One may study T-section, rectangular section of a beam for reliability and design point using Hasofer-Lind method. Linear and non–linear limit state functions may be taken for the analysis.
Ethics
The research work is not associated to safety, water and air pollution, the depletion of natural resources, loss of biodiversity, destruction of ecosystems, and global climate. The submitted work is original and not have been published elsewhere in any form or language.
References
[1] R.S. Kurmi and N. Kurmi, Strength of Materials, S. Chand Publications, 2015.
[2] L.S. Srinath, Reliability Engineering, John Wiley and Sons, Inc. U.K., 1997
[3] K.C. Kapur and L.R. Lamberson, Reliability in Engineering Design, John Wiley and Sons, Inc. U.K., 1997.
[4] R. Ranganathan, Structural reliability and Design, Jaico publishing house, Delhi, 1999.
[5] John case, Lord Chilver, Carl T.F. Ross, Strength of Materials and Structures, Fourth edition, 1999.
[6] R.K. Bansal, Strength of Materials, Laxmi Publications, 2009.
[7] Seyed Hooman Gasemi and Anderzej S. Nowak, Reliability analysis of circular tunnel with consideration of the strength limit state, Geo Mecanics and Emgineering, Vol. 15, No. 3, 2008.
[8] Karthik C B, Amit Kumar Onkar, Manjuprasad M and Dinesh S V, Analysis of Frames, International Journal of Innovative research in Science, Engineering andTechnology, 6, 9, 2007.
[9] O J Aladegboye, D A Opeyemi and O D Atoyebi E M Ibitogbe, Reliability analysis of rein forced concrete beam using varying properties, Earth and Environmental Science, 445, 012031, 2020.
[10] E. Bastidas and A.H. Soubra, Reliability analysis methods, Stochastic analysis and inverse modeling pp. 53–77, 2015.
[11] Cristopher D. Eamon and Elinjesen, Reliability analysis of prestressed concrete beames exposed to fire, Engineering Structures, 43, 69–77, 2012.
[12] Jinsheng, Shewang Cuiying Zheng and Zuping Chen Yang, FOSM based shear reliability analysis of CSGR dams using strength theory, Computer and Geo techniques 97, 52–62, 2018.
[13] Renjian Lu, Yuanhui and Joel P. Conte, Structural Safety 14, 277–298, 1994.
[14] Henrik O. Madsen, First Order Vs Second Order Reliability Analysis of Series of Structures, Structural Safety, 2, 207–214, 1985.
[15] Z Yanfang, et al., Reliability sensitivity based on First-Order Reliability Method, J. Mechanical Engineering Science, Vol. 000 Part C, 2011.
[16] Manuel Baro-Tijerina and Gerardo Duran-Medrano, Stress/Strength Models to Estimate Systems Reliability R(t) P(x y), International Journal of Engineering Research & Technology (IJERT), 7, 03, 2018.
[17] Yannan Gao and Xin Zhao, Application of Monte Carlo Method Based on Matlab Calculation of Definite Integrals and Simulation of Heston’s Model, Journal of Physics, IOP Conf. Series, 1069, 012092, 2018.
[18] Cornell, C.A.: A Probability-Based Structural Code. ACI-Journal, Vol. 66, 1966, pp. 974–985.
[19] A. Satyanarayana, T. Sumathi UmaMaheshwari and M. Tirumala Devi. Reliability of Simply Supported Rectangular Beam under Uniformly Distributed Load, Journal of Xi’an University of Architecture & Technology, Volume XII, Issue V, 2678.
Biography

M. Tirumala Devi received the Bachelor’s degree in 1993, the Master’s Degree in Mathematics in 1995 and the Ph.D. in Mathematics in 2012 from Kakatiya University. She is currently working as an Assistant Professor at the Department of Mathematics, Kakatiya University, Waranagal, India. She has 15 years teaching experience. Her area of research is Reliability Theory, Operations Research.

T. Sumathi Uma Maheswari received the Bachelor’s degree in 1984 from Osmania University, the Master’s Degree in Mathematics in 1987 and the Ph.D. in Mathematics in 1991 from Kakatiya University. Post-Doctoral Researcher 1996 to 1997 from UGC. She is currently working as a Professor at the Department of Mathematics, Kakatiya University, Waranagal, India. She has 21 years teaching experience. Her area of research is Reliability Theory, Operations Research.

A. Satyanarayana received the Bachelor’s degree from Kakatiya University in 1996, the Master’s Degree in Mathematics from Osmania University in 2012. He is currently working as an Assistant Professor at the Department of Mathematics, SRR Government Arts & Science College, Satavahana University, Karimnagar, India. He has 8 years teaching experience. His area of research is Reliability Engineering.
Journal of Reliability and Statistical Studies, Vol. 15, Issue 2 (2022), 745–758.
doi: 10.13052/jrss0974-8024.15214
© 2023 River Publishers

