Reliability Analysis and Life Cycle Cost Optimization of Hydraulic Excavator
Sandeep Kumar Mishra1,*, Neeraj Kumar Goyal1 and Arup Mukherjee2
1Subir Chowdhury School of Quality and Reliability, Indian Institute of Technology Kharagpur, India – 721302
2TATA Hitachi Construction Machinery Co. Pvt. Ltd, Kharagpur, India -721301
E-mail: sandeep21iitk@gmail.com
*Corresponding Author
Received 16 July 2023; Accepted 20 February 2024; Publication 15 March 2024
Abstract
This study focuses on conducting a reliability analysis of an excavator from its field failure data and improve its reliability cost effectively. The aim of the research is to perform reliability estimation of systems and identify the critical subsystem with significant contributions to system unreliability. The reliability analysis was performed using repairable system data analysis approaches. Life cycle cost (LCC) was estimated for critical subsystems, and it was optimized to select cost effective reliability improvement strategy. The results of the study provide valuable insights into the performance and cost-effectiveness of the excavator and its subsystems, which can assist manufacturers and operators in optimizing their equipment’s reliability, availability while considering the cost implications over the life cycle of the equipment. The results show that the undercarriage has critical contributions to system unreliability. This study attempts deep down reliability analysis of critical undercarriage components for optimal selection of improvement method among feasible alternatives. LCC analysis and its optimization performed on the critical sub-system is expected to help OEM save approx. 15% of LCC. The empirical data used in the paper is based on field data gathered during the operational life of the hydraulic excavator over approx. six years in its Indian operations.
Keywords: Availability, excavator, life cycle cost, reliability, repairable system.
1 Introduction
Excavators are essential equipment for the construction and mining industries, and their reliability and availability have a direct impact on project timelines and cost. Reliability and availability studies are important for ensuring that an excavator operates safely, efficiently, and cost-effectively. By monitoring and optimizing these factors, excavator operators and the concerned team can reduce downtime, improve productivity, and minimize the risk of unexpected breakdowns.
Excavators are heavy machinery used for a variety of tasks, including excavation, demolition, mining, forestry work, and construction. The importance of an excavator lies in its ability to perform heavy-duty tasks efficiently and effectively. In short, excavators are versatile which can be equipped with various attachments to carry out a wide range of tasks. For example, excavators can be fitted with buckets, rock breakers, quick couplers, and even orange peel grab, which enable them to perform different jobs such as digging, breaking up concrete, lifting heavy objects, drilling holes etc. In essence, excavators are an important machinery for construction and mining industry in particular and many other industries in general. These machines play a crucial role in making a wide range of tasks efficient and cost-effective.
Generally, excavators are of three types viz. mechanical, hydraulic and hybrid based on the technology used. All these types have three main sections: the upper structure, the undercarriage, and the front attachment. The upper structure includes cabin, an engine and counterweight. Counterweights offset the force of the digging. The undercarriage includes idlers, rollers and track chain which help in smooth (forward and backward) movements. The front attachment consists of the boom, the digging arm, and the bucket or any other attachment. In simple words, an excavator is a machine which imbibes the human body and its style of functioning. Like the human body, excavator is also a very complex system with a mix of several subsystems.
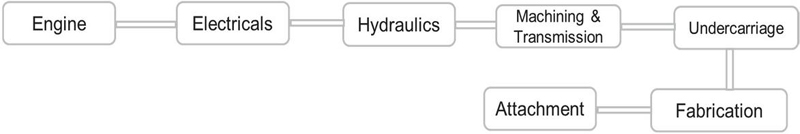
A schematic diagram of hydraulic excavator represented in Figure 1. It is to be noted that across industries excavators are named based on their operating weight.
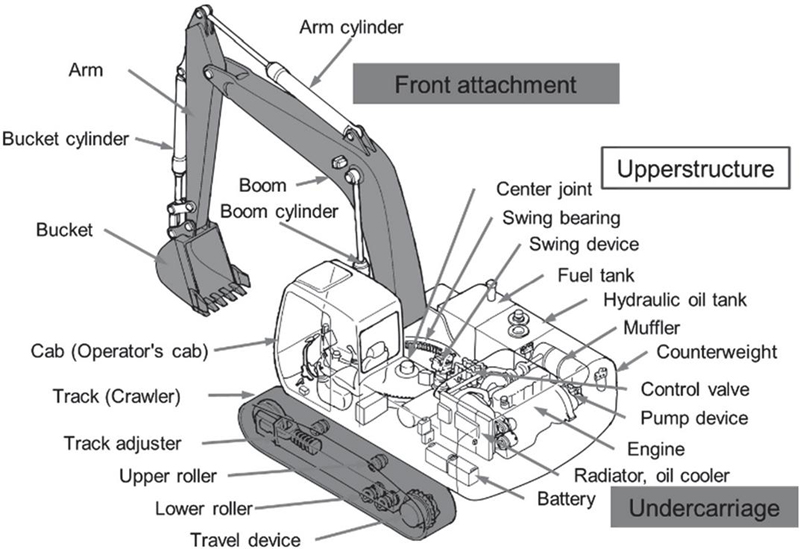
Figure 1 Schematic diagram of hydraulic excavator.
We have divided the overall system into subsystems so that the failures can be organized. The excavator has nine subsystems delineated in Table 1.
Table 1 Subsystems of excavator
| S.No. | Subsystem | Aggregates |
| 1 | Hydraulics | Travel motor, Swing Motor, Pump, Center Joint, etc. |
| 2 | Engine | Fuel Injection Pump, Radiator Oil Cooler, etc. |
| 3 | Electrical | Battery, Wire Harness, Starter, Fusebox, etc. |
| 4 | Machining & Transmission (M&T) | Travel Device, Swing Device, Bush, Pin, etc. |
| 5 | Fabrication | Boom, Arm, Track Frame, Main Frame |
| 6 | Sheet Metal Parts | Doors, Cover, bracket, cabin, etc. |
| 7 | Attachment | Bucket, rock breaker, orange peel grab, etc. |
| 8 | Undercarriage | Idler, Lower Roller, Track Chain Assembly, Upper Roller, Sprocket, Track Adjuster |
| 9 | Others | Grips, Plastic covers, boot, loose parts, etc. |
Reliability analysis is a critical analysis tool for determining the expected performance over lifespan of systems and system life cycle cost (LCC) is a comprehensive method for evaluating the costs associated with acquiring, operating, and disposing of a system (excavator in present study) over life span. The term life cycle cost (LCC) refers to all expenses that will be incurred during the course of a single product’s life. LCC analysis supports a variety of activities that take place over the lifespan of equipment including decision-making, budget planning, expense control, and more (Waghmode and Sahasrabudhe, 2012).
Industries face several challenges while performing reliability analysis and life cost analysis, including:
• Data collection and management: Accurately collecting and managing data for reliability and life cost analysis can be challenging and time-consuming.
• Complexity of models and methods: Reliability and life cost analysis often involve complex models and methods, requiring specialized knowledge and skills.
• Lack of standardization: There is a lack of standardization in the methods and models used for reliability and life cost analysis, which can lead to inconsistent results.
• Uncertainty in data and models: The uncertainty in the data used for reliability and life cost analysis, as well as the limitations of the models used, can introduce significant errors in the results.
• Integration with other systems: Integrating reliability and life cost analysis with other systems and processes, such as product design and manufacturing, can be challenging.
• Cost and time: Performing reliability and LCC analysis can be a costly and time-consuming process, requiring significant resources and effort.
• Balancing trade-offs: Balancing the trade-offs between the costs and benefits of different reliability and life cost optimization options can be challenging.
In short, performing reliability and LCC analysis effectively requires significant expertise and resources, and can be impacted by a range of technical, organizational, and financial challenges. However, the manufacturing sector is currently being forced by the fierce global rivalry to estimate and optimize the total cost of ownership for a system, taking performance, safety, reliability, and maintainability into account which makes reliability and LCC analysis of products obligatory. To reduce equipment failures and increase their availability, it is important that reliability engineering and maintenance management are understood, modelled, and analysed.
Analysis of non-repairable systems can be simpler and more straight forward than that of repairable system which can involve complex statistical models and data analysis. (Usher, 1993) pointed out that majority of the literature belongs to reliability analysis of non-repairable systems. The prevalence of non-repairable systems in many fields, their higher consequences of failure, and the relative simplicity of their analysis are some of the reasons why the literature on non-repairable systems is more extensive than that on repairable systems. However, if the proper analysis techniques are not employed, fundamental issues may be overlooked. For example, techniques for non-repairable systems may be applied to repairable systems, despite the fact that the data may not have the same identical and independent distribution (IID).
A reliability engineer is frequently confronted with a bewildering number of reliability models, which produces findings that are contradictory and erroneous. Therefore, proper analysis methods are essential for managing repairable systems effectively and efficiently, and can help to improve system reliability, reduce cost, and ensure regulatory compliance.
Few studies have been reported in literature for reliability and life cycle cost (LCC) analysis of excavators. (Mukherjee, 2001) used best fit distribution to model the failure data and estimated reliability at different operational hours. They found that the hydraulics and engine were the most significant contributor towards unreliability. (Roy et al., 2001) analysed the reliability and maintainability characteristics of four shovels using best fit distribution approach. The authors suggested using maintenance time interval at 75% reliability first and then adjust it based on realized benefits in terms of cost, safety, and operational effectiveness of the machine. A study by (Enyindah and Amadi, 2019) highlighted the importance of applying LCC model to determine the total ownership cost and economic replacement time. The authors through the analysis of an excavator for a period of 9 years found that the maintenance cost was the most significant contributor to LCC. (Dašić et al., 2015) used weibull distribution to ascertain the reliability and mean time to work without failure of hydraulic system of an excavator. Authors using goodness of fit tests concluded that the greatest agreement with experimental data is with weibull distribution. Analysing the reliability of an individual excavator is simple, more straightforward, and often relevant to the specific purpose of the analysis. However, in this study we have considered analysis of a fleet of excavators which can provide valuable insights to industrial professionals to optimize maintenance and repair strategies, reduce costs, improve safety, and improve performance.
In mining applications, similar reliability and LCC studies have been reported. (Markeset and Kumar, 2018) advocated the application of LCC before procurement of any new capital-intensive equipment. The authors pointed out that LCC can be used as a system improvement tool in addition to its economic value. (Waghmode and Sahasrabudhe, 2008) presented a LCC framework for repairable and non-repairable systems considering reliability and maintainability (R&M) perspective. (Lad and Kulkarni, 2008) suggested an LCC-based approach in a conceptual study to address integrated system and maintenance schedule design for life cycle. (Bala et al., 2018) analysed the reliability of mining equipment using a three-parameter weibull distribution. The authors found that the electrical and mechanical subsystems have lowest reliability and recommended use of reliability-centered PM interval for reliability improvement. (Barabady and Kumar, 2008) analysed the reliability of a crushing plant at a bauxite mine in Iran using statistical methods. The authors found that the crushing plant had a low reliability, which led to high maintenance and repair costs. They recommended using reliability-centered maintenance (RCM) to improve equipment reliability and reduce maintenance costs. A study by (Taheri and Aghajani, 2016) compared basic maintenance approach vis a vis Reliability centered maintenance (RCM) approach and concluded that reliability analysis is very helpful for choosing maintenance periods. (Vagenas et al., 2007) analysed the reliability and availability of three mining equipment and showed that RCM analysis can provide significant benefits in maintenance and other costs over common failure analysis techniques. However, most of these studies are either conceptual in nature or specific to a particular equipment and not on fleet of equipment.
For majority of repairable systems, maintenance and operating costs dominate the LCC. (Waghmode and Patil, 2016) pointed out that the operation cost is the easily identifiable, but system reliability & maintainability (R&M) parameters were must to forecast the expense of maintenance and repairs. Authors also developed a generalized LCC model that can be applied for estimating the life cycle cost of repairable systems.
We are of the opinion that reliability estimation and LCC optimization of repairable systems, like excavators and other mining equipment, is an ongoing process. It requires the selection of appropriate methods and techniques from available multiple techniques for reliability modelling, failure data analysis, repair data analysis, maintainability analysis, downtime analysis, LCC modelling, cost estimation, cost optimization, availability optimization etc.
In this study, we aim to perform the reliability analysis and LCC evaluation of excavators to determine their cost-effectiveness and potential areas for improvement. Through this analysis, we expect to provide valuable insights for equipment manufacturers, contractors, and project owners to make informed decisions while selecting and utilizing excavators in their operations. We strongly believe LCC optimization of a product supported with reliability analysis will motivate industries to adopt this field which drives following objectives in present study:
• To estimate the subsystem reliability and thereby system reliability of hydraulic excavator.
• To identify the critical subsystem and understand the nature of its failure patterns which need to be addressed considering effective changes in design and maintenance policies for improvement in system reliability and availability.
• To model and estimate the life cycle cost of the critical subsystem.
• To optimize the life cycle cost of critical subsystem by deep down analysis of critical failure modes.
The paper is structured as follows: Section 2 provides the approach used for reliability and life cycle cost analysis; Section 3 presents a case study describing the reliability and life cycle cost analysis of a hydraulic excavator; Section 4 concludes the paper.
2 Proposed Approach
Concerned class of excavators are causing the highest loss of revenue for the company.
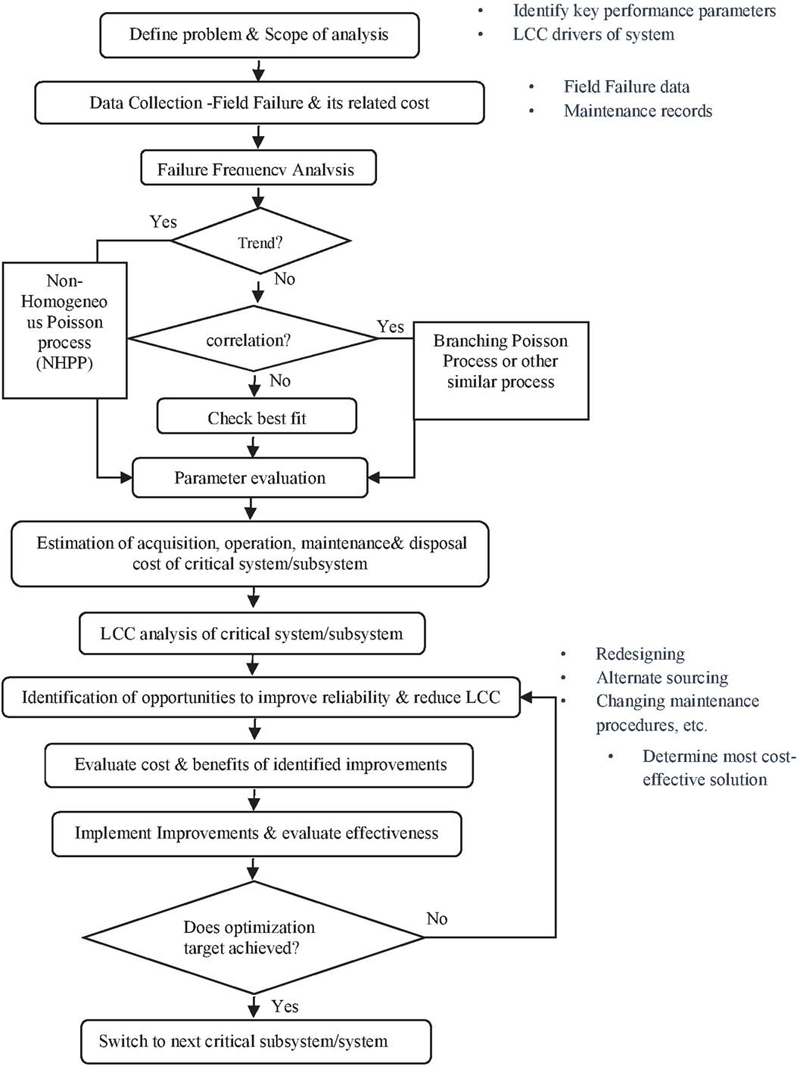
Figure 2 Flow chart for reliability analysis and life cycle cost (LCC) optimization of a repairable system.
Therefore, in this case study our aim is to estimate the reliability for concerned repairable system followed by the cost analysis and optimization of critical subsystem(s), so that the system remains productive and cost effective. Figure 2 depicts a model framework for reliability & LCC analysis of a repairable system in which the step-by-step process of achieving the objective of LCC optimization through the established methods of reliability & maintainability analysis is elucidated. It must be noted that the key performance parameters and LCC drivers of the concerned system must be identified before applying the proposed framework.
2.1 Data Collection
Data pertaining to the failure of the hydraulic excavator and its related expenses were collected over a period of approx. six years. It is to be noted that failure data collected have been modified with random factors and generic nomenclature is used to maintain anonymity due to confidentiality of the failure data. However, the changes do not impact the analysis method and decisions derived from this study.
Following challenges were encountered during the process of data preparation for current study:
• Data is manually recorded in multiple forms following different formats in the workshops.
• Incomplete entries were noticed without defect details.
• Few field failures details were highly confidential and were not shared for the study.
• Duplicate data entries were found for the same part number in different operational hours.
• Problem descriptions are not filled in correctly in many cases. The descriptions were ambiguous.
• Same problem reported multiple times by customers to claim the cost if claim was rejected in earlier attempts.
• Since repair times of service call numbers are separately collected by branch teams and collated by product support group, we performed concatenation of repair time using service call numbers.
The author prepared a data collection format (refer Table 2) to address the aforementioned issues, which was subsequently employed in this study.
Table 2 Format for data collection
| 1 | 2 | 3 | 4 | 5 | 6 | 7 | 8 | 9 | 10 | 11 | 12 |
| Service Number | Equipment S.No. | Time to Failure | Defect Group | Aggregate | Part Number | Customer warranty begin | Application | Defect | HMR Date | Item Text | Time to Repair |
2.2 Conversion of Operational Data Into Relevant Format
Using correct data collection format ensures that the data is collected accurately and consistently. This improves the accuracy of the reliability analysis and reduce the likelihood of errors.
Highlights of the prepared data collection sheet are mentioned below:
(a) The focus of the format is on precise collection of failure data.
(b) Data collection should be regulated through common software in entire chain.
(c) The proposed format requires coordination between branch and service teams so that repair times are updated in the system itself at the time of claiming the service cost.
2.3 Component Failure Frequency Analysis
It can be done using Pareto charts (Figure 3). Component failure frequency analysis helps to identify the major critical subsystems contributing to system failures.
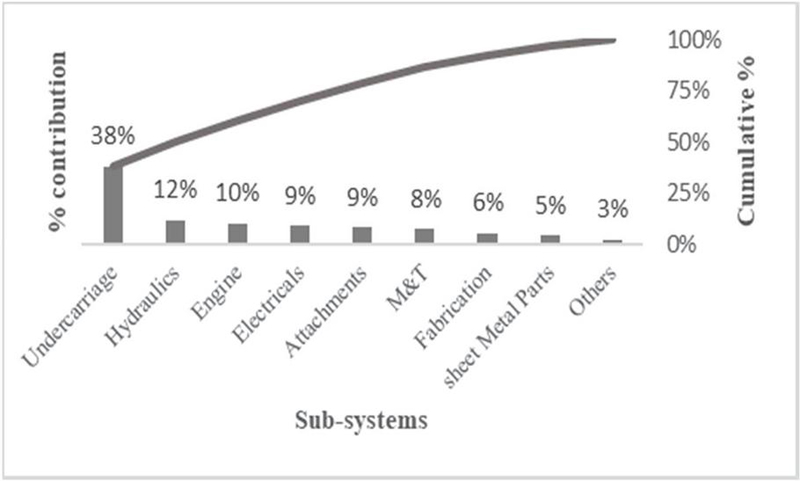
Figure 3 Defect analysis of sub-systems.
It is evident that undercarriage alone is contributing 38% of the total failures followed by hydraulics and engine.
2.4 Performing Trend Test
The next step is to validate the independent and identically distributed (IID) nature of the TBF data of each subsystem. Analytical test (MIL-HDBK-189) along with graphical tests (trend test and serial correlation test) are performed to check whether sample data collected is independent and identical (IID) or not.
Sample results of graphical trend test for undercarriage are shown below in Figure 4.
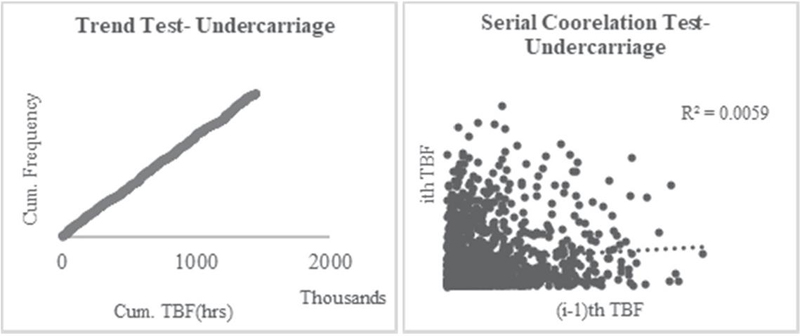
Figure 4 Graphical trend test result of undercarriage.
Our study indicates that all the subsystems have trend free data.
2.5 Analysis of Trend Free Data (Best Fit Distribution and Parameter Estimation)
Trend free data are analysed to find out the characteristic of failure time distributions of sub-systems for estimating the reliability. The following statistical distributions were examined, and their parameters were estimated by using Minitab software.
• Weibull
• Lognormal
• Exponential
• Loglogistic
• 3-Parameter Weibull
• 3-Parameter Lognormal
• 2-parameter Exponential
• 3-Parameter Loglogistic
• Smallest extreme value
• Normal
• Logistic
Table 3 Summary of undercarriage parameter estimation
| Subsystem | Trend Test | Best Fit | Parameter | MTBF (hrs) | Availability |
| undercarriage | No Trend & | Lognormal | LMean: 8.41 | 4,349 | 0.98 |
| No Dependency | LStd: 2.39 |
2.6 MTBF and Availability Calculation
The Mean Time Between Failure is calculated by dividing total cumulative hours by number of failures in that interval whereas Steady state availability is calculated by dividing cumulative MTBF by the sum of Cumulative MTBF and Cumulative MTTR (Barabady and Kumar, 2008).
Table 3 represents the summary after applying step 3 to step 5 of above procedure for undercarriage and Figure 5 shows the probability plot of undercarriage having lognormal distribution as the best fit. Log mean (referred as LMean) & Log Standard deviation (referred as LStd.) are the parameters of the log normal distribution.
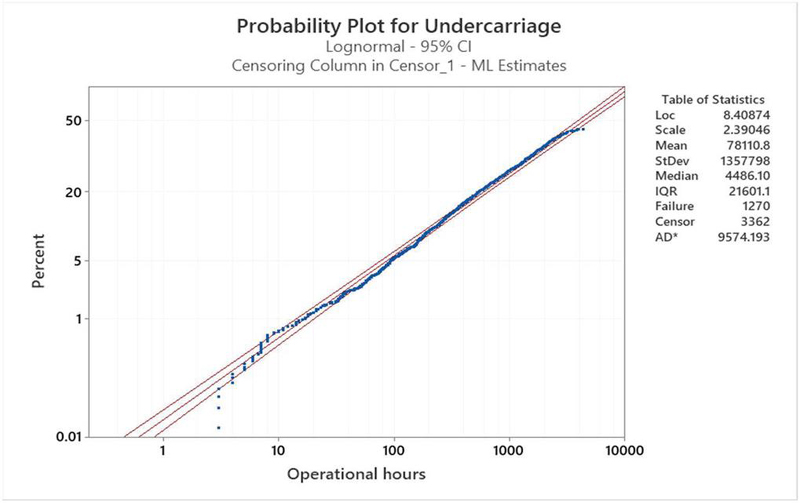
Figure 5 Probability plot of undercarriage.
2.7 Determination of System Reliability Using Subsystems
All the subsystems are functionally arranged in a series configuration which means that the excavator is in a working condition only when all the sub-systems are working satisfactorily. The reliability of the hydraulic excavator (R) can be calculated as follows:
| (1) |
where R is the reliability of different sub systems.
2.8 Reliability Based Maintenance Interval
The periodic maintenance time intervals are determined to meet different interval reliability targets using Equation (2)
| (2) |
2.9 Quality and Reliability Analysis of Critical Subsystem
The idea in this step is to further analyse the critical subsystem or subsystems to find out the components which are causing maximum failure in terms of cost and reliability. We have done the deep-down analysis of components of critical systems and improved it in terms of process, raw material, or design to reduce or eliminate the failures.
This requires a complete understanding of the product, and its applications. Users must analyse its failures in different aspects viz commissioning year, application, region, climate, failure modes etc. to ascertain the cause of failure and act to improve the failure cost.
2.10 Life Cycle Cost (LCC) Analysis
In this study, the model chosen involved five kinds of costs namely, acquisition cost, operating cost, failure cost, support cost and net salvage cost.
• The acquisition cost includes engineering design and manufacturing, material costs, production costs, spare parts and logistics, initial training, and service during warranty period etc.
• Operating cost includes all the costs necessary for the daily operation of a machine, which primarily includes fuel and lubricants. Working hours of concerned class of excavator which in this study is considered as 3000 hours per year.
• Failure cost means cost incurred due to failure of goods either due to bad quality, poor workmanship, or application abuse. For failure cost MTTF needs to be estimated for all the subsystems/components involved.
• Support cost means annual preventive maintenance (PM) cost. It consists of labour cost and the cost of components/consumables that are replaced during PM. Additionally, fixed documentation support costs are charged.
• Net salvage cost is the realized cost at the end of useful life of the undercarriage when it is scrapped.
A generalization of the LCC model is given by Equation (3) (Ebeling, 1997) (Waghmode and Patil, 2016)
Operating cost is for the entire machine, however in this paper we have not considered operating cost. Salvage value is also minimal and hence no considerable impact on LCC of considered subsystem.
Therefore,
Mathematically,
| (3) |
Where,
= Acquisition cost of undercarriage
= Number of operating units
= Fixed support cost
= Annual support cost per unit
= Cost per failure
= Operating hours per unit per year
= Design life in years
To/MTTF = Expected number of failures per year
| (4) |
is the annuity factor.
2.11 Life Cycle Cost (LCC) Optimization
Once, LCC of existing product is determined then based on findings of reliability improvement suggestions, failure cost, support cost and operating cost as applicable should be optimized. Optimization requires weighing all the factors and implementing the ones which have impact in terms of safety, quality, reliability, and cost. Special caution should be applied while implementing the improvements and its impact should be properly ascertained through testing, survey, or batch assembly before using it for mass production. It is important to note that the assumptions and inputs used in the analysis should be based on accurate and reliable data. Additionally, the results should be evaluated against other factors, such as safety, regulatory compliance, and social responsibility.
3 Results and Findings
In this section we present the detailed results and inferences drawn based on subsystem analysis of the failure data of the concerned hydraulic excavator.
3.1 Analysis of Trend Test
We performed both analytical and graphical trend test and found that all the subsystems were not showing significant trend in the failure times. Analytical and Graphical trend test and serial correlation results of all subsystems were depicted in Table 4 and Figures 6 to 13 respectively.
Table 4 Analytical trend test result of subsystems
| Rejection of Null | |||
| Degree of | Calculated | Hypothesis at 5% | |
| Subsystem | Freedom 2(n-1) | Statistic U | Significance Level |
| Undercarriage | 2538 | 2519.42 | Not Rejected (2421.96) |
| Hydraulics | 818 | 1383.28 | Not Rejected (752.63) |
| Engine | 682 | 1016.88 | Not Rejected (622.41) |
| Electricals | 616 | 998.76 | Not Rejected (559.43) |
| Machining & Transmission | 518 | 786.58 | Not Rejected (466.22) |
| Fabrication | 394 | 473.82 | Not Rejected (348.99) |
| Attachment | 564 | 1351.08 | Not Rejected (509.92) |
| Sheet Metal parts | 308 | 371.45 | Not Rejected (268.34) |
| Others | 182 | 493.14 | Not Rejected (151.80) |
The null hypothesis is not rejected at 5% significance level for all the subsystems.
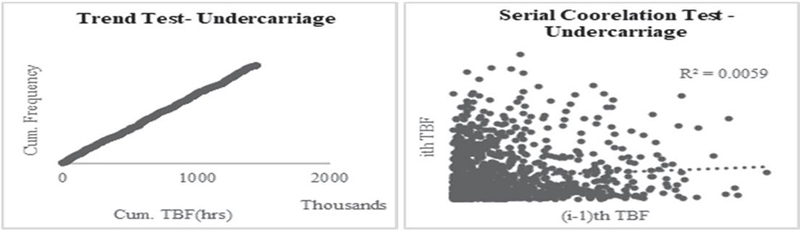
Figure 6 Graphical trend and serial correlation test result of undercarriage.
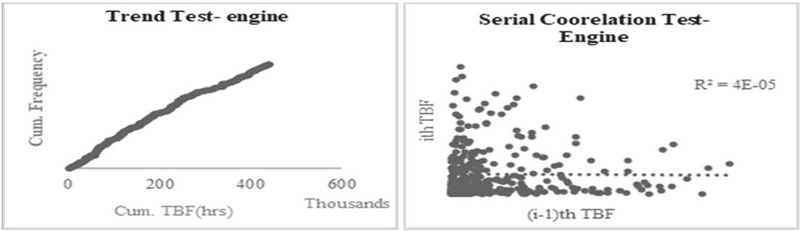
Figure 7 Graphical trend and serial correlation test result of engine.
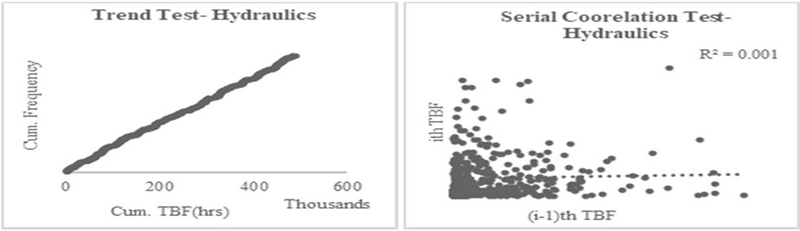
Figure 8 Graphical trend and serial correlation test result of hydraulics.
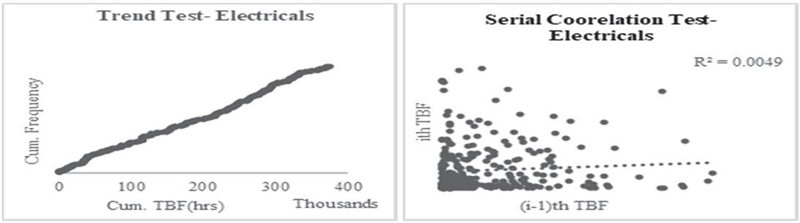
Figure 9 Graphical trend and serial correlation test result of electricals.
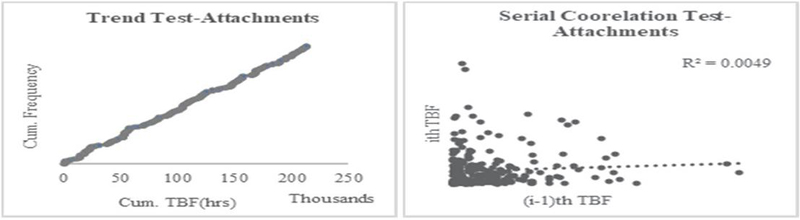
Figure 10 Graphical trend and serial correlation test result of attachments.
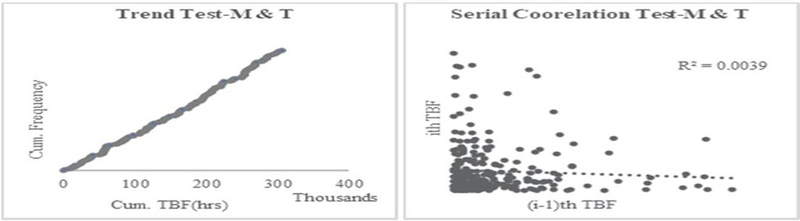
Figure 11 Graphical trend and serial correlation test result of M&T.
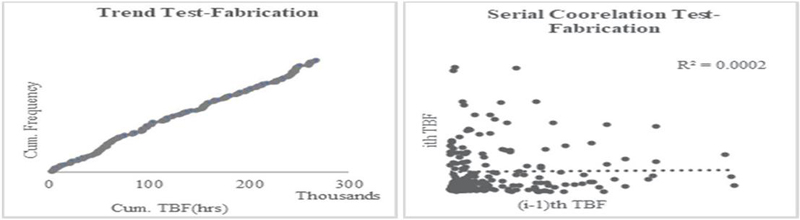
Figure 12 Graphical trend and serial correlation test result of fabrication.
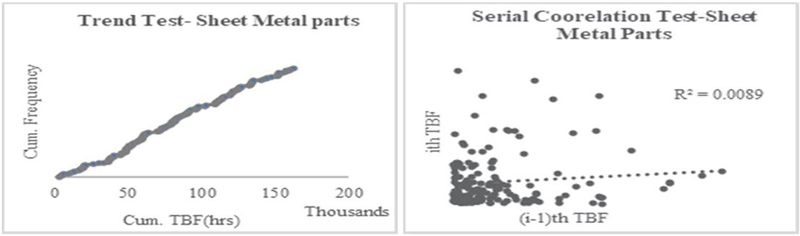
Figure 13 Graphical trend and serial correlation test result of sheet metal parts.
Graphical trend test and serial correlation results (refer, Figures 6 to 13) of all subsystems indicate trend free data which means that the failure data does not exhibit any systematic pattern of change over time. Established IID nature proves that the probability of a failure occurring at any given time is the same for all components, and the occurrence of a failure in one component does not affect the probability of a failure occurring in any other component. This allows for the use of simple statistical models to estimate subsystem reliability.
3.2 Best Fit Distribution and Parameter Estimation
Data fitting into various statistical distributions indicates lognormal is the best fit distribution for all subsystems. The probability plot of all the subsystems are depicted in Figures 14 to 17.
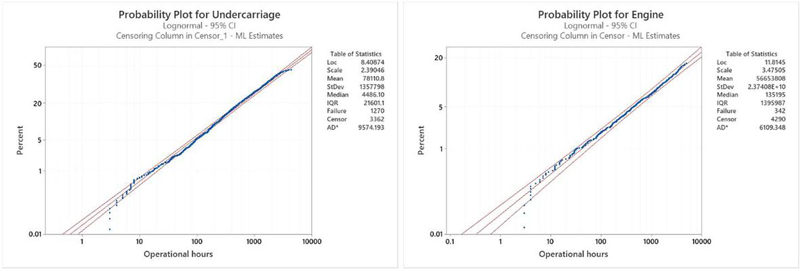
Figure 14 Probability plot of undercarriage & engine.
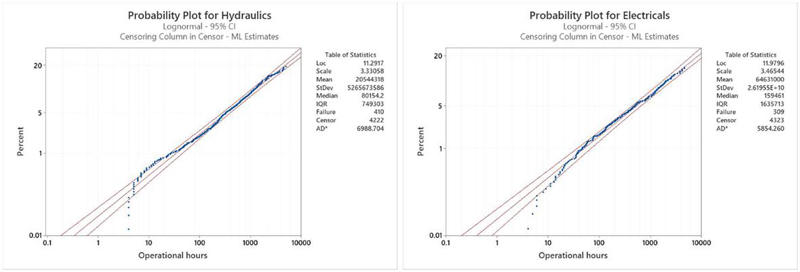
Figure 15 Probability plot of hydraulics & electricals.
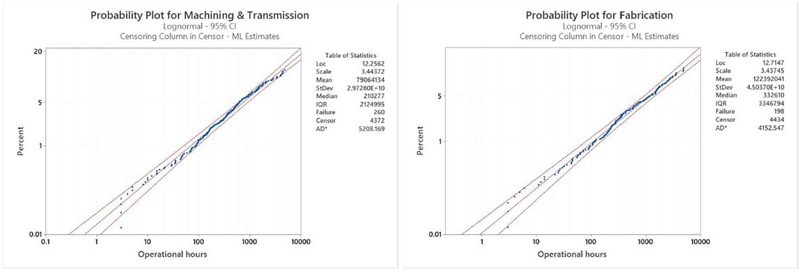
Figure 16 Probability plot of machining & transmission & fabrication.
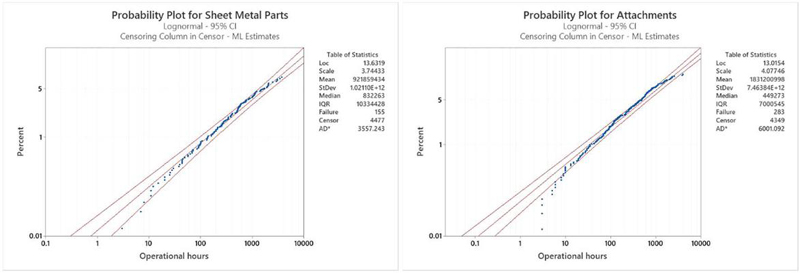
Figure 17 Probability plot of sheet metal parts & attachments.
Distribution parameters along with other information such as median, Interquartile range (IQR), goodness of fit value among others can be referred from probability plot of subsystems. This information was then used to estimate the subsystem reliability.
MTBF and availability values of all subsystems along with distribution parameters were summarized in Table 5.
The analysis shows that the undercarriage is critical from reliability point of view followed by hydraulics, engine, and electricals subsystem; however, due to the parts availability and large service network of concerned manufacturer undercarriage availability is still not alarming.
Summary results also indicates that the availability of attachment, fabrication and others are cause of concern for the manufacturer. However, it is to be noted that others include parts which are non-critical in nature and does not cause stoppage of machine.
Table 5 Summary of subsystems parameter estimation
| Subsystem | Analytical & Graphical Test | Parameter | MTBF (hrs) | Availability |
| Undercarriage | No Trend & No Dependency | LMean: 8.41 LStd: 2.39 | 4,349 | 0.983 |
| Hydraulics | No Trend & No Dependency | LMean: 11.29 LStd: 3.33 | 13,472 | 0.967 |
| Engine | No Trend & No Dependency | LMean: 11.81 LStd: 3.47 | 16,150 | 0.987 |
| Electricals | No Trend & No Dependency | LMean: 11.97 LStd: 3.46 | 17,875 | 0.981 |
| Machining & Transmission | No Trend & No Dependency | LMean: 12.25 LStd: 3.44 | 21,244 | 0.972 |
| Fabrication | No Trend & No Dependency | LMean: 12.71 LStd: 3.43 | 27,896 | 0.933 |
| Attachment | No Trend & No Dependency | LMean: 13.01 LStd: 4.07 | 19,517 | 0.915 |
| Sheet Metal parts | No Trend & No Dependency | LMean: 13.63 LStd: 3.74 | 35,635 | 0.968 |
| Others | No Trend & No Dependency | LMean: 14.51 LStd: 3.75 | 60,037 | 0.943 |
3.3 Subsystem and System Reliability Analysis
For estimation of system reliability, sheet metal parts and other category components are not considered as their failures were non-critical in nature and have not caused operational failure.
Based on distribution parameters, reliability of subsystems is calculated at various operational hours. Reliability analysis (refer, Figure 18) clearly indicates undercarriage is the worst performing sub-system followed by hydraulics and engine whereas fabrication and sheet metal parts are the best performing subsystems.
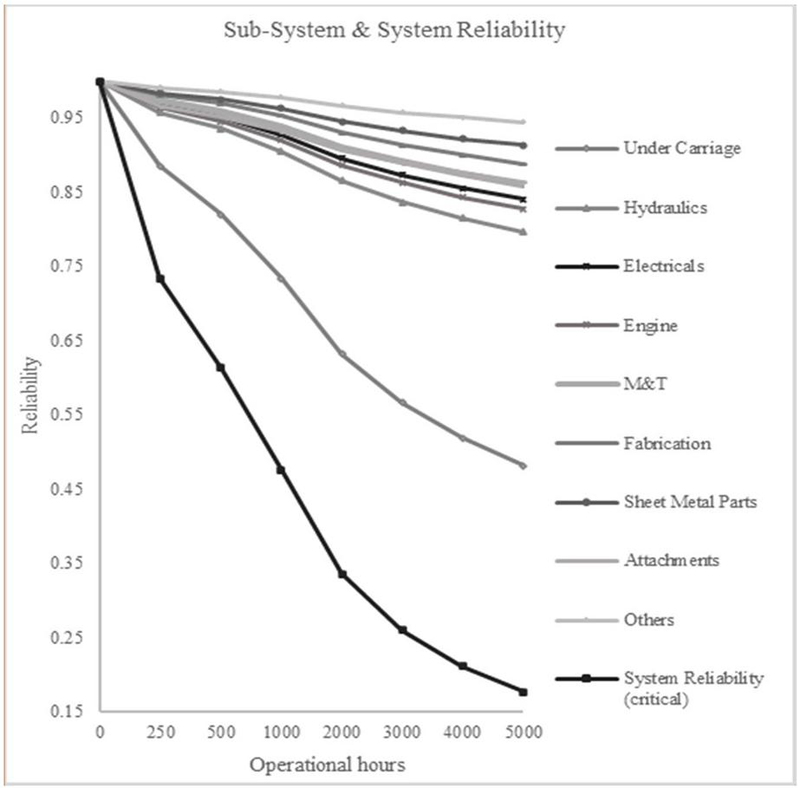
Figure 18 System & subsystem reliability analysis.
Reliability plot of machining & transmission(M&T) and fabrication are quite identical. Undercarriage has a reliability of 0.48 at 5000 hours of operation which is evident from the fact that its performance keeps on degrading compared to other subsystems from the beginning of operation. Since systems are connected in series overall system reliability is also degrading as operational hours increase due to undercarriage and its components. It is quite clear from the analysis that manufacturer must focus on undercarriage to improve system reliability as a whole and in turn customer satisfaction.
3.4 Reliability Based Maintenance Interval
The maintenance interval was calculated by using the best fit distribution for the combined TBF data (refer, Table 6). It is evident that to achieve 95% reliability for undercarriage of hydraulic excavator, PM should be carried out on or before 88.2hrs because after machine has run for 88.2hrs without failure there is only a 0.95 probability that it will not fail. Similarly, the utilization of reliability-based maintenance intervals for other subsystems can be employed to attain the desired level of reliability.
Depending on the safety consequences, cost-benefit analysis, and problem type, the maintenance period for various reliability levels may be utilized for inspection, repair, service, condition monitoring, or replacement.
Table 6 PM interval for different target reliability values
| Target Reliability | ||||
| Subsystem (Operational Hours) | 0.99 | 0.98 | 0.95 | 0.91 |
| Hydraulics | 34.6 | 85.7 | 334.5 | 920.8 |
| Engine | 42.0 | 108.1 | 446.9 | 1283.8 |
| Electrical | 50.4 | 129.5 | 533.2 | 1526.9 |
| Machining & Transmission (M&T) | 69.9 | 178.6 | 729.0 | 2075.2 |
| Fabrication | 113.4 | 288.8 | 1174.0 | 3331.6 |
| Attachment | 34.5 | 104.7 | 553.0 | 1906.7 |
| Undercarriage | 17.3 | 33.2 | 88.2 | 182.3 |
3.5 Quality & Reliability Analysis of Undercarriage
Pareto analysis of undercarriage (Figure 19) suggests that idler is the worst performing part causing 32% failures whereas lower roller and track chain causing 40% failures together.
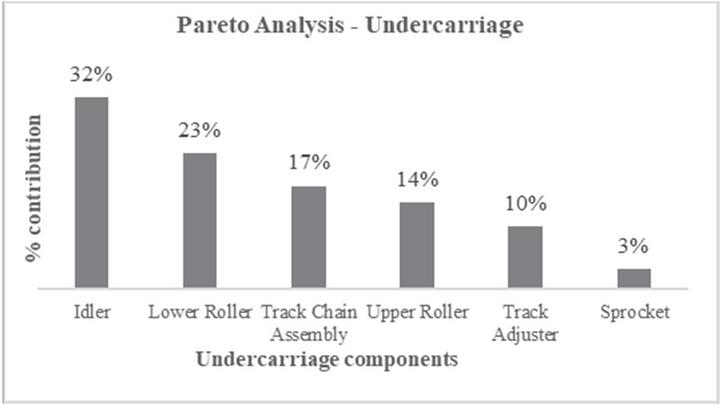
Figure 19 Defect analysis of undercarriage.
Reliability plot of undercarriage components (refer, Figure 20) also revealing the fact that idler has the worst reliability among undercarriage components followed by lower roller and track chain assembly. This is possibly due to the impact of hard application/environment.
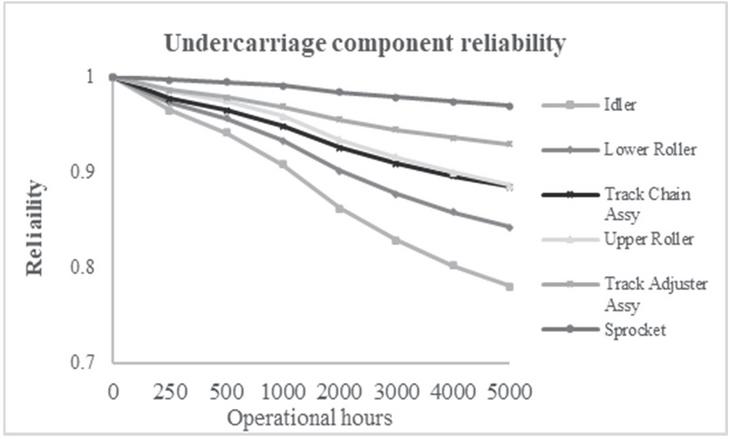
Figure 20 Undercarriage sub-system reliability plot.
To further analyse, we have done a deep-down analysis of idler (refer, Figure 21) and observed that 88% of the failures are happening in granite region (hard application) whereas 64% defects are due to leakage. This gives an indication that we must focus on failure analysis of idlers working in granite application.
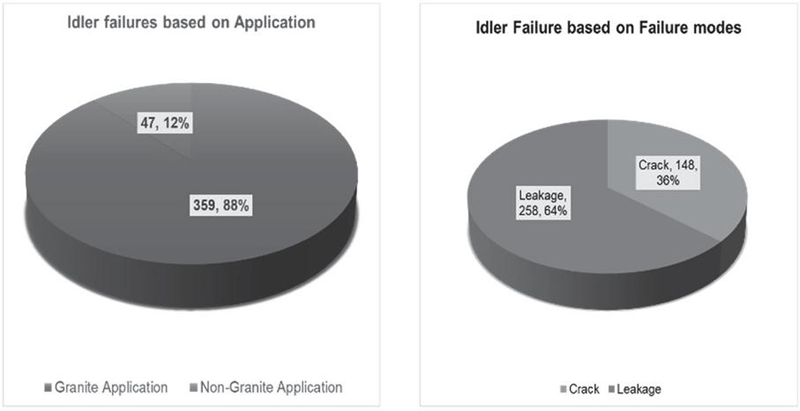
Figure 21 Idler analysis in terms of application and failure modes.
Defect Analysis of Idler
During defect analysis of idler, it was observed that leakage and crack issues were happening due to crack in circular weld joint between center flange and plate weld joint. The primary reason is excess travel of excavators in granite application where excavators need to travel up to 40% carrying the load which have caused failure of not only idler but other undercarriage components as well.
During analysis of circular weld joint of idler, it was found that there is proper fusion and that there is no defect in weld joint. It is also found that the crack started at the root of weld towards flange side, propagating outwards caused the failure. Based on root cause analysis, we can conclude that this is a case of fatigue failure occurring due to high cyclic load.
Recommendations for Improvement
Based on the quality and reliability analysis conducted, following changes can be applied to idler for improvement:
• To change material and dimensions of hub, plate, and rim of idler.
• Do the necessary accelerated testing before implementing the changes in the field.
• Parallelly, assembled few sets of idlers in field machines (in granite application) to check the improvement effectiveness.
• Changing the existing maintenance interval based on the estimated maintenance interval hours (Table 7) to arrest the issue of leakage in particular.
Table 7 Reliability based maintenance interval for different reliability level of idler
| Target Reliability | ||||
| Subsystem | 0.99 | 0.98 | 0.95 | 0.91 |
| Idler (Operational hours) | 57.0 | 124.4 | 405.0 | 972.0 |
Similar quality and reliability analysis exercises were carried out for other components of undercarriage which have helped us in carrying out the life cycle optimization task of undercarriage and helped us in improving the profit margin of concerned class of excavators.
3.6 Life Cycle Cost (LCC) Analysis
Table 8 indicates the summary of undercarriage components parameter estimation, its reliability at 3000 operational hours, mean time between failure (MTBF) and mean time to repair (MTTR). Track adjuster has highest MTTR of 16 hours/failure which is equivalent to two working days, this is due to the fact that track adjuster disassembly is quite complex and requires removal of several undercarriage components whereas upper roller have lowest MTTR of 8 hours.
Table 8 Summary of undercarriage components parameter estimation
| Components | Reliability (t 3000 hrs) | MTBF (hrs) | MTTR (hrs) |
| Track Adjuster | 0.94 | 41,844 | 16 |
| Sprocket | 0.97 | 1,31,510 | 12 |
| Lower Roller | 0.87 | 19,178 | 10 |
| Idler | 0.82 | 13,604 | 10 |
| Track Chain Assy | 0.91 | 25,221 | 12 |
| Upper Roller | 0.92 | 30,182 | 8 |
The acquisition cost of undercarriage is ₹9,41,150.
Operating cost includes working hours of the concerned class of excavator which in this study is considered as 3000 hours per year. The cost of oil consumption per hour is ₹1,870 whereas per hour oil consumption is 22 litres. It gives an annual operating cost of ₹56,10,000. However, this cost is for the entire machine and for undercarriage per se we have not considered operating cost.
Failure cost per failure of undercarriage is ₹1,12,778 where labour charges for repair are considered as ₹500 per hour. Support cost considering annual mean maintenance hour of 2.3 hrs and using part of Equation (3), is ₹8,605.
Life Cycle Cost (LCC)
For an interest rate of 8% and life of 10 years, the annuity factor (P(r, t)) is determined to be 6.7101.
The fixed cost of operating is taken as zero and the number of units to be procured is one. Substituting the calculated values, LCC is estimated by using Equation (3);
• LCC ₹15,21,607
Life Cycle Cost Results
LCC results are depicted in Table 9.
Table 9 Life cycle cost of undercarriage
| Cost Element | Cost in INR | % of LCC |
| Acquisition cost | ₹9,41,150.00 | 61.85% |
| Failure cost | ₹5,22,017.00 | 34.30% |
| support cost | ₹58,440.00 | 3.85% |
| Life Cycle cost | ₹15,21,607.00 | 100.00% |
Cost associated with failure cost is quite significant and it is more than 34% of LCC on the contrary support cost is only 4% of LCC which in a way strengthens the point that manufacturer needs to look and apply reliability-based PM time intervals.
3.7 Life Cycle Cost (LCC) Optimization
The detailed reliability and LCC analysis of undercarriage presented helped in identifying the critical components from reliability and LCC viewpoint. These components are idler, lower roller, and track chain assembly. Concentrating on these components improve the reliability of the machine, which will in turn reduce LCC. The LCC of undercarriage is optimized based on reliability improvement measures. These measures are suggested based on alternative supplier induction, design changes, process improvements, applying different components for different applications and discussion with experts. Based on the reliability improvement measures, improved reliability and improved LCC were estimated.
Reliability Improvement Suggestions/Alternatives
To improve reliability, an idler having a life of around 40000 hours is suggested. Idlers are mainly breaking from circular weld joint. It is found that the current idler is not suitable for high load applications. It is also known that idlers imported from previous supplier provides the life of 40000 hours. Suggestion is to change the supplier for granite application and parallelly do the comparison study of existing idler with previous idler and deploy changes in existing idler along with estimated reliability-based maintenance intervals. This helps to increase the life of an idler by up to 40000 hours. Impact on LCC of undercarriage by adopting different PM interval is depicted in Figure 22. It is evident that the impact of failure improvement of idler would result in considerable improvement in Life cycle cost (LCC) of undercarriage. Though change in PM interval for achieving target reliability of idler would result in significant support cost increase but its impact would meagre in terms of benefits achieved through improvement in failure cost. The cost of idler would change from ₹65,386 to ₹72,796 for alternative 1 whereas cost would be ₹75,819 for alternative 2.
The failure of the lower roller is more frequent. This is because the lower roller carries all the loads and jerks during heavy applications. Adding two more rollers will share the load properly and increase the life of both upper and lower rollers or results of benchmarking study can be applied which requires process improvement and sealing change. Application of this alternative 1 would change the cost from ₹31,007 to ₹41,819 whereas cost of alternative 2 would be ₹37,714.
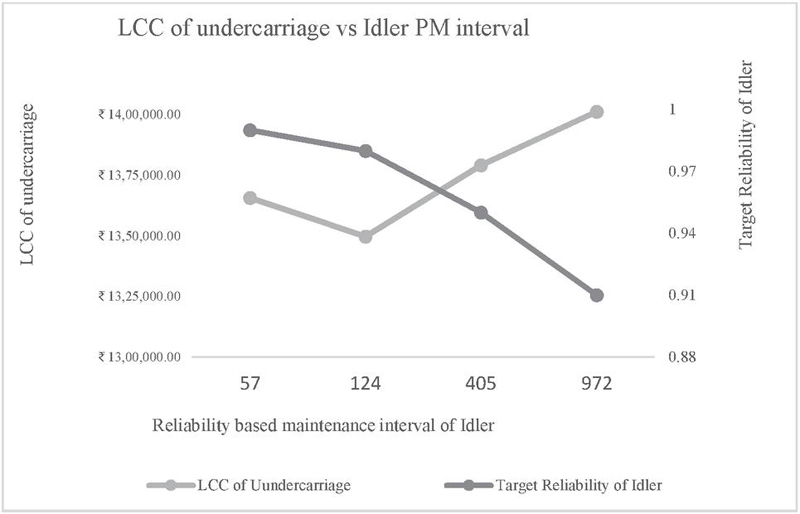
Figure 22 Impact on LCC of undercarriage.
Track chain assembly failures are mainly maintenance related, include bolt loosening, bush wear, faster shoe wear etc. these problems can be taken care off by bush rotation, maintaining track sag, bolt torque cheque during PM. However, for grouser strengthening, material hardening through change in heat treatment is proposed which is likely to provide an estimated life of 30000 hours and this would change the assembly price from ₹6,04,023 to ₹6,09,058 for alternative 1 whereas alternative 2 would cost ₹6,29,305.
Considering the fact that some of the alternatives requires lot of time for implementation, we have considering alternative 1, 2 and 1 for idler, lower roller, and track chain respectively.
If these precautions and improvements are implemented, then there will be no such problem during the useful life of the undercarriage. This will lead to improved reliability and reduced LCC. New cost of idler, lower roller, and track chain assembly were considered while recalculating the failure cost.
Table 10 Improved reliability and MTBF
| Component | Prior Reliability | Improved Reliability | Prior MTBF | Improved MTBF |
| Track Adjuster | 0.94 | 0.94 | 41844 | 41844 |
| Sprocket | 0.97 | 0.97 | 131510 | 131510 |
| Lower Roller | 0.87 | 0.92 | 19179 | 40000 |
| Idler | 0.82 | 0.91 | 13605 | 40000 |
| Track Chain Assy | 0.91 | 0.92 | 25221 | 30000 |
| Upper Roller | 0.92 | 0.92 | 30183 | 30183 |
| Reliability | 0.56 | 0.64 | 4349 | 6758 |
Table 10 indicates 15% improvement in reliability of undercarriage and enhanced MTBF of 6758 hours after the proposed changes in sourcing, material, process, and maintenance procedure of undercarriage components.
Estimation of Failure Cost After Improvement
Failure cost and acquisition cost after applying new component cost and improved MTBF is ₹89,259 and ₹9,63,720 respectively. There would be no change in acquisition, support, and net salvage cost.
Optimized LCC after substituting the value of improved failure cost to in Equation (3), is
• LCC ₹12,88,039
Life Cycle Cost Results
Optimization results shows the cost saving of ₹2,56,138 on failure cost which leads to the saving of 15.3% on LCC of undercarriage.
Table 11 LCC result after optimization
| Cost Element | Prior Cost | Improved Cost | Savings | Cost Savings |
| Acquisition cost | ₹9,41,150 | ₹9,63,720 | ₹22,570 | 2.4% |
| Failure cost | ₹5,22,017 | ₹2,65,879 | ₹2,56,138 | 49% |
| Support cost | ₹58,440 | ₹58,440 | – | – |
| Life Cycle Cost | ₹15,21,607 | ₹12,88,039 | ₹2,33,568 | 15.35% |
4 Conclusion
Reliability and LCC analysis at various assembly levels of systems are found beneficial in evaluating the performance of an excavator and determining effective options for improving system reliability while reducing life cycle cost. We used failure data collected from the field and performed reliability analysis to select critical assemblies or components for improving reliability performance cost effectively. We performed LCC modelling of subsystems and components which helped in selection of reliability improvement approaches which were cost effective. We found deficiencies in maintenance strategies and found changes needed to achieve targeted reliability and availability performance cost. This study highlights the importance of failure, maintenance, and cost data collection for achieving performance targets cost effectively. Reliability based maintenance intervals were also determined for all subsystems which is expected to reduce the downtime and the maintenance cost. The results of the analysis show that undercarriage was most critical from reliability point of view and its aggregates such as idler and rollers were significant contributors towards unreliability and failure cost component of LCC. LCC analysis of undercarriage helps in improving its reliability by 15% and reduce life cycle cost by 15.3%. In the present work we focused on significantly weak assemblies, only keeping in mind practical challenges in implementing large changes. The system reliability improvement exercise will also be performed for improving the performance of other less performing assemblies.
Acknowledgements
This research did not receive any specific grant from funding agencies in the public, commercial, or not-for-profit sectors. The views expressed here are those of the authors and not necessarily the organization to which they belong.
References
Bala, R. J., Govinda, R. M., and Murthy, C. S. N. (2018). Reliability analysis and failure rateevaluation of load haul dump machines using Weibull distribution analysis. Mathematical Modelling of Engineering Problems, 5(2), 116–122. https://doi.org/10.18280/mmep.050209.
Barabady, J., and Kumar, U. (2008). Reliability analysis of mining equipment: A case study of a crushing plant at Jajarm Bauxite Mine in Iran. Reliability Engineering and System Safety, 93(4), 647–653. https://doi.org/10.1016/j.ress.2007.10.006.
Dašić, P., Živković, M., and Karić, M. (2015). Reliability Analysis of the Hydro-System of Excavator SchRs 800 Using Weibull Distribution. Applied Mechanics and Materials, 806, 173–180. https://doi.org/10.4028/www.scientific.net/amm.806.173.
Ebeling, C. E. (1997). An Introduction to Reliability & Maintainability Engineering (p. 486). https://onlinelibrary.wiley.com.
Enyindah, N. C., and Amadi, R. K. (2019). Using Diagnosis and Life Cycle Cost to Improve Reliability of an Excavator. European Journal of Engineering Research and Science, 4(3), 21–26. https://doi.org/10.24018/ejers.2019.4.3.1107.
Lad, B. K., and Kulkarni, M. S. (2008). Integrated reliability and optimal maintenance schedule design: A Life Cycle Cost based approach. International Journal of Product Lifecycle Management, 3(1), 78–90. https://doi.org/10.1504/IJPLM.2008.019971.
Markeset, T., and Kumar, U. (2018). Application of LCC techniques in selection of mining equipment and technology. Mine Planning and Equipment Selection 2000, 635–640. https://doi.org/10.1201/9780203747124-120.
Mukherjee, S. K. (2001). Reliability Analysis of Shovel Machines Used in an. 10(2), 219–231.
Roy, S. K., Bhattacharyya, M. M., and Naikan, V. N. A. (2001). Maintainability and reliability analysis of a fleet of shovels. Institution of Mining and Metallurgy. Transactions. Section A: Mining Technology, 110(SEPT/DEC). https://doi.org/10.1179/mnt.2001.110.3.163.
Taheri, M., and Aghajani, A. (2016). Reliability Analysis of Loader Equipment: A Case Study of a Galcheshmeh Travertine Quarry in Iran. International Black Sea Mining & Tunnelling Symposium, 2–4 November 2016, 327–335.
Usher, J. (1993). Case study: Reliability models and misconceptions. Quality Engineering, 6(2), 261–271. https://doi.org/10.1080/08982119308918723.
Vagenas, N., Runciman, N., and Clement, S. R. (2007). A methodology for maintenance analysis of mining equipment. International Journal of Surface Mining, Reclamation and Environment, January 2014, 37–41.
Waghmode, L. Y., and Patil, R. B. (2016). Reliability analysis and life cycle cost optimization: a case study from Indian industry. International Journal of Quality and Reliability Management, 33(3), 414–429. https://doi.org/10.1108/IJQRM-11-2014-0184.
Waghmode, L. Y., and Sahasrabudhe, A. D. (2008). Product life cycle cost modelling - A suggested framework. Proceedings – 1st International Conference on Emerging Trends in Engineering and Technology, ICETET 2008, 745–748. https://doi.org/10.1109/ICETET.2008.27.
Waghmode, L. Y., and Sahasrabudhe, A. D. (2012). Modelling maintenance and repair costs using stochastic point processes for life cycle costing of repairable systems. In International Journal of Computer Integrated Manufacturing (Vol. 25, Issues 4–5, pp. 353–367). Taylor and Francis Ltd. https://doi.org/10.1080/0951192X.2010.551783.
Biographies

Sandeep Kumar Mishra is a mechanical engineering graduate who has spent over a decade working in India and abroad in the field of quality. He is a N2 Certified Japanese speaker, lead QMS auditor and Six Sigma Black belt analyst. He is currently pursuing MTech. in quality & reliability engineering from Subir Chowdhury School of Quality and Reliability, IIT Kharagpur. His research interest includes fleet reliability analysis of complex systems, life cycle cost optimization, life data analysis, quality control of slow-moving models, etc.

Neeraj Kumar Goyal is currently an Associate Professor in Subir Chowdhury School of Quality and Reliability, Indian Institute of Technology Kharagpur, India. He received his PhD degree from IIT Kharagpur in Reliability Engineering in 2006. His areas of research and teaching are network reliability, software reliability, electronic system reliability, reliability testing, probabilistic risk/safety assessment, and reliability design. He has completed various research and consultancy projects for various organizations, e.g., DRDO, NPCIL, Vodafone, ECIL, etc. He has contributed several research papers to international journals and conference proceedings.

Arup Mukherjee received his B.E. (hons), M.E. (Gold Medallist) and PhD degree in metallurgy engineering from Jadavpur University, Kolkata, India, in 1988, 1993 & 2023 respectively. He has over 30 years of industrial experience, currently serving as Vice President of Tata Hitachi Construction Machinery wherein he is heading & guiding Quality, Design, R&D, Planning and Production engineering departments. His current research interests include metallurgy engineering, new product development, reliability engineering, Failure diagnosis, manufacturing, IOT and Industry 4, etc.
Journal of Reliability and Statistical Studies, Vol. 16, Issue 2 (2023), 297–328.
doi: 10.13052/jrss0974-8024.1626
© 2024 River Publishers