Bayesian Network Approach for Studying the Operational Reliability and Remaining Useful Life
Debasis Jana*, Deepak Kumar, Suprakash Gupta, Sukomal Pal and Sandip Ghosh
Indian Institute of Technology (BHU), Varanasi-221005, India
E-mail: debasis.srf.min21@itbhu.ac.in
*Corresponding Author
Received 04 September 2023; Accepted 16 February 2024
Abstract
Reliability study plays a significant role in supporting the operation of any machinery working in a dynamic and harsh environment such as mining, and construction industries. This quality is inherently uncertain and a stochastic variable of any system. This study focused on the effects of operating conditions (OCs) on the operational reliability and remaining useful life (RUL) of machinery. A probabilistic graphical method called Bayesian Network (BN) was used to study the effect of OCs on the system performance. The developed methodology has been demonstrated by analyzing the operational reliability and predicting the RUL of electrical motors operated in heavy mining machinery. The failure probabilities estimated from the historical data of the motor system are failure likelihood, and OCs are the evidence in the developed BN model. It has been observed that the performance and RUL of the motor are significantly influenced by OCs and maintenance. A threshold value of reliability at which the motor system requires maintenance or replacement has been proposed to guide management in decision-making. This study will be beneficial for designing an appropriate maintenance schedule, reducing unplanned production downtime, and reducing the maintenance cost of electrical motors operated particularly in dynamic and harsh environmental industries.
Keywords: Operational reliability, Bayesian network, Remaining useful life.
1 Introduction
Reliability is commonly used as a dependable performance indicator of a system and it reflects how well the system can consistently fulfill the specified purpose [1, 2]. The manufacturing sector is consistently striving to remain competitive with the help of highly reliable equipment. Increases in the reliability of the equipment lead to increases in both production and profitability. It is necessary to maintain a high level of equipment availability to continuously produce at the target level. However, the harsh workplace environment is a hindrance and needs rigorous maintenance programmes to ensure high equipment reliability. A system’s reliability analysis can demonstrate how potential events such as component failure, maintenance, inspection, and testing can affect system failure. Reliability assessment can serve as a foundation for decisions made during the system life-cycle, like development stages, including design, construction, operation, and maintenance [3].
It is believed that electronic and electrical equipment would perform well in the wide range of environmental conditions that exist around the world. The rate at which a system deteriorates might vary significantly depending on the operating environment. Various operating conditions invariably have an impact on a system’s quality as well as its reliability and lifespan [4, 5] and need to be studied.
Lundteigen & Rausand [4] have defined the reliability index (RI) of a system to study the effect of test and maintenance techniques, human and organizational factors (HOFs), and environmental variables on the system performance. Theoretically, all the relevant reliability index factors can be incorporated into the reliability models, but the precision of the estimated results may not be acceptable with limited data or models built on false assumptions.
An efficient and efficient maintenance programme is of utmost importance to ensure high availability of a production system. Prediction of the remaining usable life (RUL) of a component is an important aspect of predictive maintenance programmes to schedule maintenance, improve operational efficiency, and eliminate unplanned downtime [6]. Therefore, determining the RUL is one of the most important aspects of predictive maintenance programmes.
Mathematical models of reliability like, the parametric distribution functions can simulate and extrapolate reliability, but they consider time-to-event data only and ignore the formulation and quantification of operational and environmental conditions (covariates) that affect the performance and reliability of systems [7, 8]. Numerous studies have examined reliability assessments of engineering systems that take covariates into account [9–11]. Ghodrati and Kumar [12] have used the proportional hazard model (PHM) to study the effect of covariates on the hydraulic jack’s failure of a load-haul-dump (LHD) machine. In their study, the authors assume that the baseline risk function is Weibull and the operator skill, hydraulic system temperature, and environmental factor are the model covariates. To study the effect of the change of system states on the failure intensity, Gasmi et al. [13] have also used PHM and have defined system states into loaded and unloaded states, and the baseline hazards function as the Weibull distribution function. H. Langseth [14] studied the survival times of mechanical equipment of a gas turbine using a Bayesian network. This study uses a Bayesian network for modelling the covariates structure and identifies the covariates that directly influence the time to failure of the equipment. Previous Reported reliability models incorporating the covariates studies mostly focus on identifying and simulating the impact of factors on the hazards function [12, 13]. Recent research has shown that Bayesian Network models, when applied to the performance analysis of equipment and systems, are computationally precise enough to deal with the casual relations that exist between the components and subsystems [15–18]. In the context of performance studies of electrical equipment, Bayesian networks have not yet been properly investigated to their full potential. Additionally, the inference and diagnostic information dissemination capabilities of BNs make it possible for these systems to achieve more precise reliability estimation. Also RUL prediction is important and increasing day by day but the effects of OCs and other influencing factors on the predicted RUL is still in its infancy. The goal of this paper is to construct a probabilistic graphical model for assessing the effects of a set of OCs on the reliability and RUL of electrical motor operated in dynamic and harsh environments.
The rest of the paper is organized as follows. Section II demonstrated the overview of the motor system and its different failure modes along with the data. The methodology has been detailed in Section III of the paper. Section IV demonstrated the results and discussed on it. Finally, the outcomes of the research have been concluded in Section V.
2 Methodology
The research methodology applied in this study is shown in Figure 1. The main three phases of the developed methodology include collection of data, reliability modelling using BN and prediction of RUL.
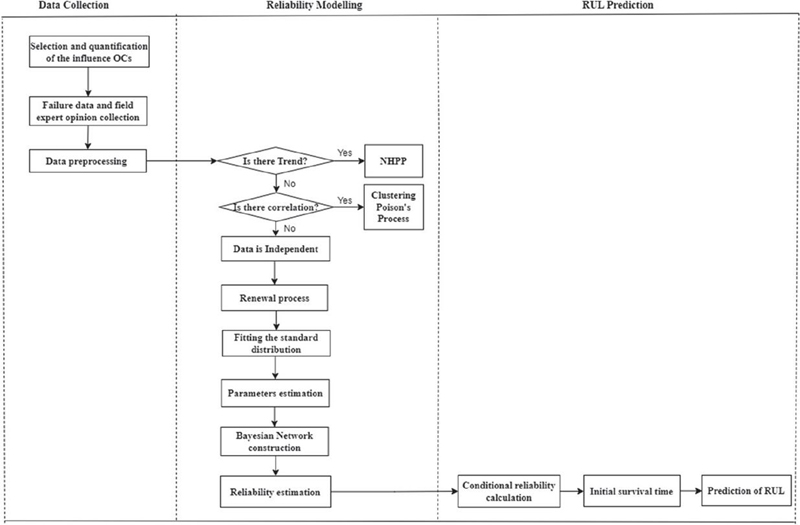
Figure 1 Flowchart of the research methodology.
2.1 Bayesian Network
A Bayesian network (BN) graphically models the conditional dependencies of a set of variables and uses Bayes’ rule to revise the probabilities of expected odds of an event by adding new information. In the discrete case, Bayes’ theorem relates the conditional and marginal probabilities of events A and B, provided that the probability of B does not equal zero:
| (1) |
where, conditional probability of A, given B, and referred to as the posterior probability because it is derived from or depends upon the specified value of B. conditional probability of B given A and is known as the likelihood. prior or marginal probability of B and acts as a normalizing constant. the Bayes factor or likelihood ratio.
The joint probability distribution (JPD) of the network can be obtained from the product of all likelihood probabilities and using the chain rule, it can be expressed as:
| (2) |
where is the parent set of any node .
A Bayesian network is a directed acyclic graph (DAG) consisting qualitative or quantitative components and comprises nodes and directed edges (edges for short).
The BN satisfies the property of Local Markov, which states that a node is conditionally independent of its non-descendants, given its parents. A basic form of BN is presented in Figure 2.
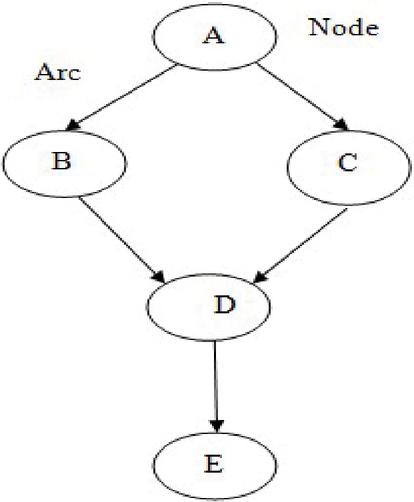
Figure 2 Simple Bayesian Network.
In Fig. 4, node A is the parent node of node of B, and C is the parent of node D. Again node D is the parent node of node E. The joint probability distribution of the Bayesian network (Fig. 3) is given by:
where, Marginal or prior probability of A, conditional probability of B given A, conditional probability of C given A, conditional probability of D given B & C both, and conditional probability of E given D.
The BN model for the motor system has been developed as appeared in the Fig 3. The covariates of each failure mode have been identified based on the retrospective analysis of past operational data, discussion with field experts and questionnaire survey.
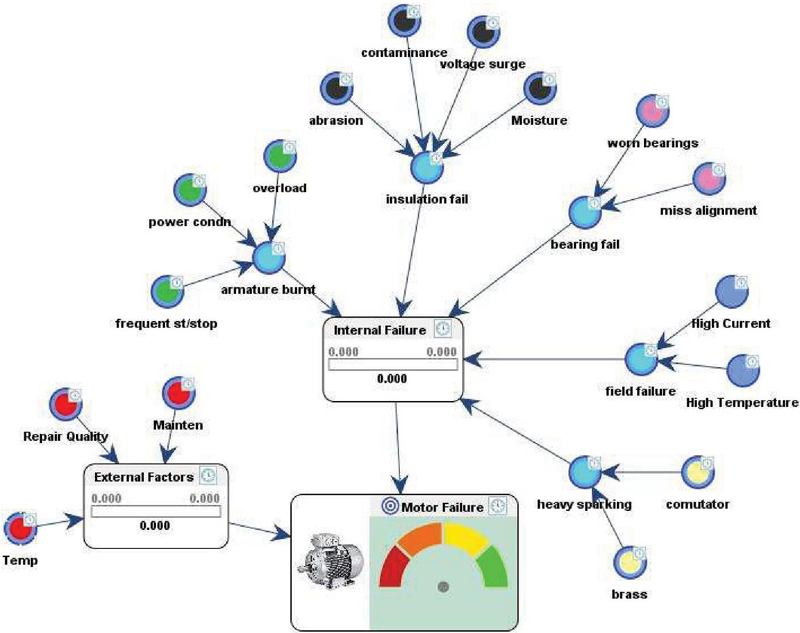
Figure 3 Developed BN model for motor system.
2.2 RUL Modeling
RUL defines the useful life left of any real object (system/component) at a specific time of its operating period. The RUL is an important term in conditioned-based maintenance and prognostic. In essence RUL should have a gradual reduction trend if no intermediate maintenance is done. In practice, RUL fluctuates over time due to the maintenance and operating condition effects [19, 20]. The RUL can be expressed as
| (3) |
where is the health index, and is the operating condition of the object.
The possibility of a system successfully carrying out the operation for which it was designed, at the conditions specified, and for the allotted amount of time without experiencing malfunction is the reliability of the system. An attempt to statistically evaluate the dependability of a system by assigning it a single numerical value, a reliability index is a single-number measure. It is possible to characterize a single system using a variety of distinct indices due to the fact that the set of dependability indices differs based on the area of engineering being discussed. A relevant index is the mean time to failure, which represents an expectation of the object’s service lifespan in the straightforward scenario of an item that cannot be utilized or repaired once it fails. A further example of a cross-disciplinary statistic is the forced outage rate (FOR), which is the chance that a certain category of apparatus is malfunctioning. In today’s system of energy regulation, reliability indices are utilized in a significant way.
This work uses reliability index as a health indicator of the system for RUL estimation. The reliability of a system is greatly influenced by the . This research models the effect of on reliability of the system using a criterion-based approach i.e. Bayesian network and Hazard model [20–22]. The conditional reliability at the lifetime can be calculated as
| (4) |
The RUL function, as defined above, of a system for a life length of can be defined by
| (5) |
The mean time to failure of any system is the mean remaining life that has reached the age . So it can be represented as
| (6) |
So, the remaining useful life function at a working age of can be expressed in the presents of as
| (7) |
3 Case Study: System Description and Data Collection
The developed methodology has been examined through a case study on operational reliability and RUL of electrical motors operated in mining environment. The data used in this study are operational field data and electrical workshop data collected from the failure log book of a 1200W DC motor operated in a 24/88 m dragline deployed in an opencast coal mine located in central India.
Electric motors of varying rated capacities are widely employed prime movers in industries using electrical power, including transportation, mining, petrochemical, and manufacturing. The electrical motors offer high efficiency, short time overloading capability, high degree of reliability, extremely durable and low maintenance. However, just like other machines, they are subjected to wear and tear and, if ignored, could eventually result in catastrophic failure of the system. Some of the important failures causes of electric motors are severe duty cycles, continuous use in overloading conditions, harsh work environment, installation and manufacturing issues, improper upkeep and maintenance [21, 22]. The major components of an electrical motor are presented in Fig. 4.
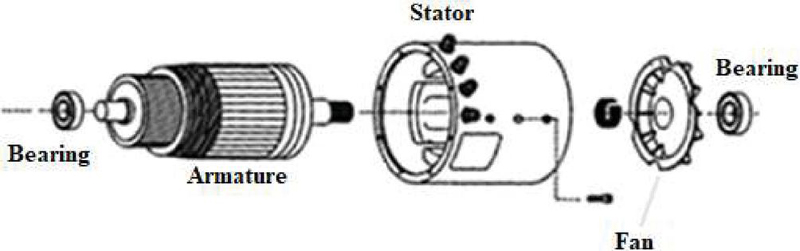
Figure 4 Important components of an electrical motor.
Certain motor parts deteriorate with time and under operating stress. Temperature, voltage fluctuations, over- and under voltage, and voltage imbalance, bearing vibration all contribute to the deterioration of electrical insulation of any electrical machines over time. Dirt, moisture, and corrosive fumes all have an impact on wear and tear of commutator and carbon brash, which further exacerbates when lubricant is improperly applied, gets too hot or contaminated, or isn’t and replaced on a regular basis. The failure of motor can be broadly categorized into two types: external failure and internal failure, as described by the flowchart in Fig. 5.
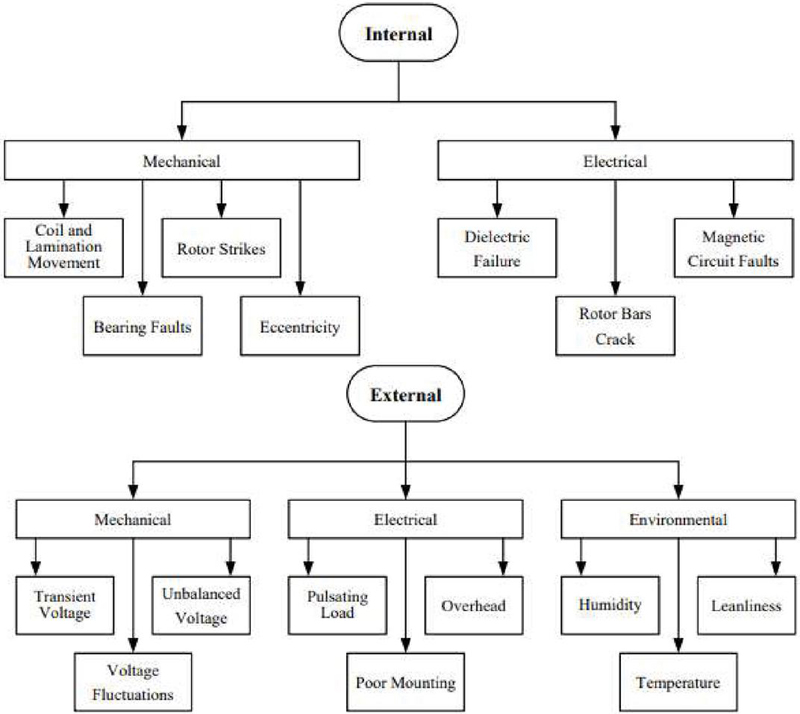
Figure 5 Classification of various causes of motor failures.
The data has also been collected through questionnaires for expert opinion. The collected historical data on motor failure are for a period of 5 years (2016–2020). The frequency of failures, Time to Repair (TTR), and Time to Failure (TTF) have been computed for the motor system from the collected logbook information. Outliers, misinformation, and anomalies in the data have all been examined at this point. The identification and selection of appropriate models for characterizing the TTFs and TTRs data have the greatest significance in estimating the node probabilities of the BN.
4 Results and Discussion
The collected data has been analyzed and it has been observed that the most frequent failure of the motor generator (MG) set assembly of a dragline is armature burn and overheating. The observed failure modes criticality of the MG assembly components according to the failure frequency is presented in Table 1.
Table 1 Criticality ranking of different motor failure modes.
| Failure modes | Criticality |
| Armature Burnt/Flashed/Failed/Overheated | 1 |
| Armature V-Ring Burnt/Flashed, Riser flashing/Problem | 2 |
| Field Fail, M/P Coil Earth/Burnt/Fail/Unbalance | 3 |
| Heavy Sparking | 4 |
| I/P Coil Burnt/Lead Burnt | 5 |
| Stator Earth/ Stator Compensating Bar Earth/Burnt/Melt Down | 6 |
The possible causes of the aforesaid failure modes have been identified from the analysis of data collected through questionnaire survey. The degree of influence of failure causes on various failure modes was assessed based on the experts’ opinion and categorized as High, Low, Moderate, poor, good where applicable. To study the causal relationship between motor failure and identified causes, OCs, the Bayesian network has been developed as presented in figure 5. Calculation of the conditional probability of the nodes is the backbone of a BN model. The likelihood of an event outcome, is dependent on the occurrence probability of a prior event or outcome and is referred to as conditional probability. To get the conditional probability of an event, the likelihood of the event that happens before it has been multiplied by the probability of the event that will happens after it.
The conditional probability for each causal relationship and OCs have been estimated from the experts’ (dragline operator, mining engineer, and maintenance engineer) opinions. For example, the identified causes for insulation failure are contaminants, Temperature, moisture and voltage surge. The conditional probability table for motor insulation failure is revealed in Table 2.
Table 2 Conditional probability of the insulation failure.
| Voltage surge | Contaminants | Temperature | Moisture | P(Motor failure) |
| Yes | Yes | High | High | 0.96 |
| Moderate | 0.88 | |||
| Low | 0.80 | |||
| Moderate | High | 0.95 | ||
| Moderate | 0.82 | |||
| Low | 0.76 | |||
| Normal | High | 0.81 | ||
| Moderate | 0.72 | |||
| Low | 0.65 | |||
| High | High | 0.85 | ||
| Moderate | 0.76 | |||
| Low | 0.71 | |||
| No | Moderate | High | 0.80 | |
| Moderate | 0.69 | |||
| Low | 0.59 | |||
| Normal | High | 0.45 | ||
| Moderate | 0.30 | |||
| Low | 0.05 | |||
| No | Yes | High | High | 0.91 |
| Moderate | 0.82 | |||
| Low | 0.75 | |||
| Moderate | High | 0.89 | ||
| Moderate | 0.69 | |||
| Low | 0.64 | |||
| Normal | High | 0.71 | ||
| Moderate | 0.64 | |||
| Low | 0.51 | |||
| High | High | 0.72 | ||
| Moderate | 0.61 | |||
| Low | 0.41 | |||
| No | Moderate | High | 0.68 | |
| Moderate | 0.51 | |||
| Low | 0.35 | |||
| Normal | High | 0.25 | ||
| Moderate | 0.11 | |||
| Low | 0.01 |
Similarly, the conditional probability for all the failure modes have been tabulated and inputted into the Bayesian network in Figure 6(a) and (b).
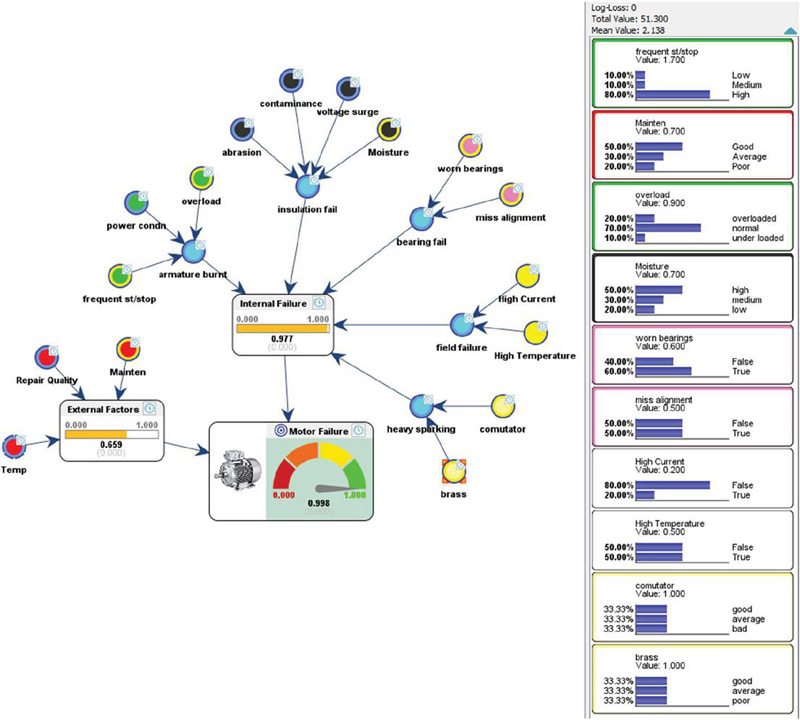
Figure 6a: Bayesian network with evidence of motor system.
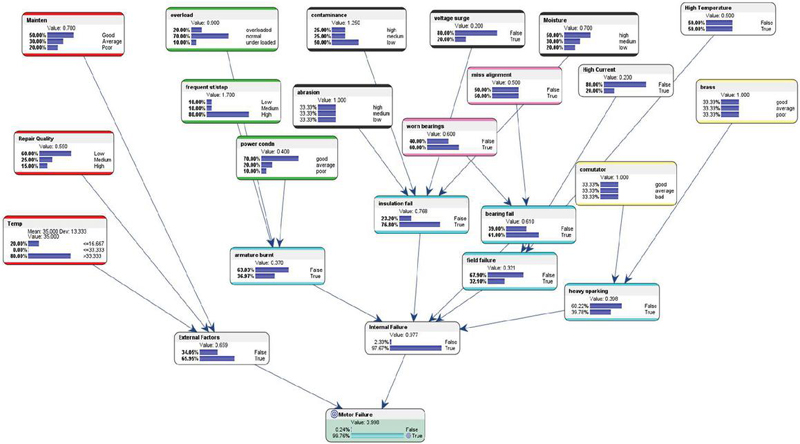
Figure 6b: Bayesian network analysis of motor system.
The developed BN was run in the BayesiaLab 10.0 and the probability of motor failure was noted. By analyzing the developed model, the failure probabilities of the motor were observed at different point of time. The motors reliability values calculated from the observed failure probability is plotted as presented in the Figure 7. It is observed that the developed BN model adequately outlines the effect of cofactors on the motor performance as reflected in the motor reliability curve (Figure 7). For example, the reliability values increase after a maintenance whereas, due to the high temperature, vibration, moisture, and voltage surge, the performance of the motor deteriorates. It is evident that among the studied external factors, maintenance has the highest effect on the motor reliability, followed by the repair quality i.e. how it repairs after a failure.
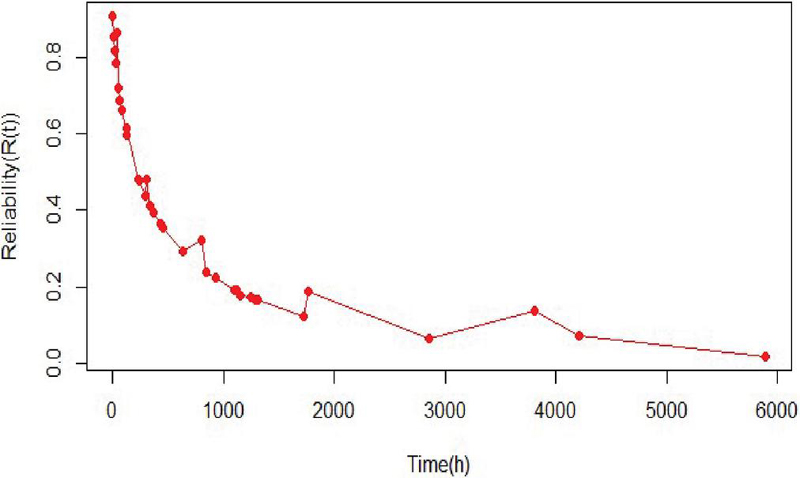
Figure 7 Reliability of motors with OCs.
Reliability analysis of the motor system following the traditional reliability evaluation technique has been done, and the reliability curve of the motor system has been presented in Fig. 8. It is observed that the reliability of the motor system is 89.59% at 1h of operation.
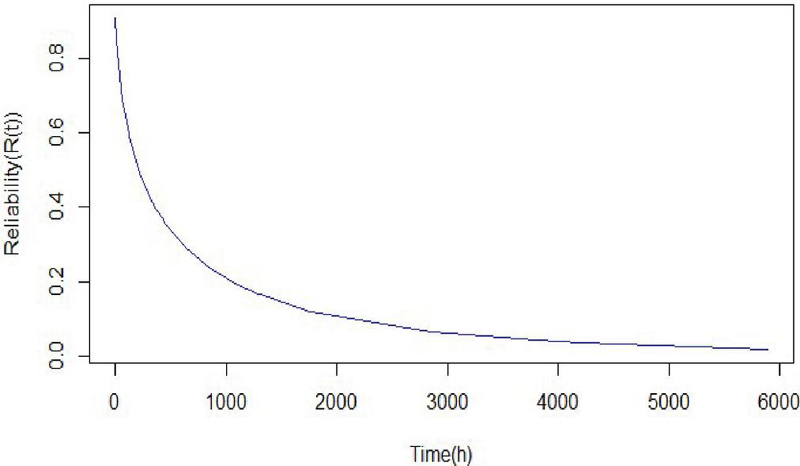
Figure 8 Reliability of the motor system using traditional approach.
Figure 9 presents a composite plot of reliability curves of the case study motor with and without preventive maintenance. The figure clearly shows how preventive maintenance affects the reliability of the motor system. It has been observed that with effective preventive maintenance, the motor reliability is comparatively higher than reliability without preventive maintenance which signifies that preventive maintenance has favorable effects on motor reliability as well as mean residual life of the motor. These positive effects influence the production and productivity of the industry.
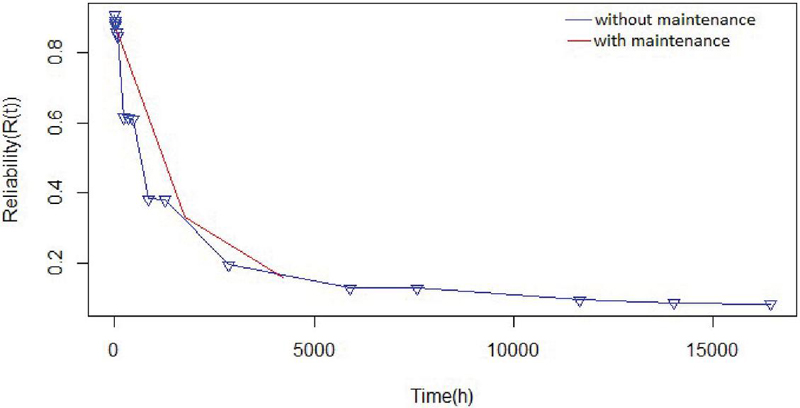
Figure 9 Reliability of motor with and without maintenance effects.
The RUL of the motor has been estimated using equations 1 and 2 and plotted as appeared in Fig. 10. It has been observed that the estimated RUL of the motor drops below its expected value when the effect of the OCs is included in the analysis. At an initial age of 500 hours the estimated RUL of the motor is 7250 hours whereas the RUL is only 5700 hours when the operation conditions are taken into account.
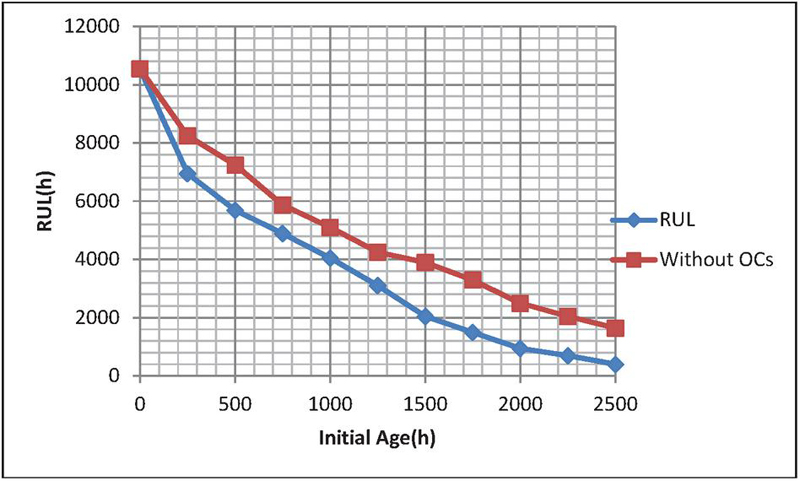
Figure 10 RUL of the motor system with and without OCs.
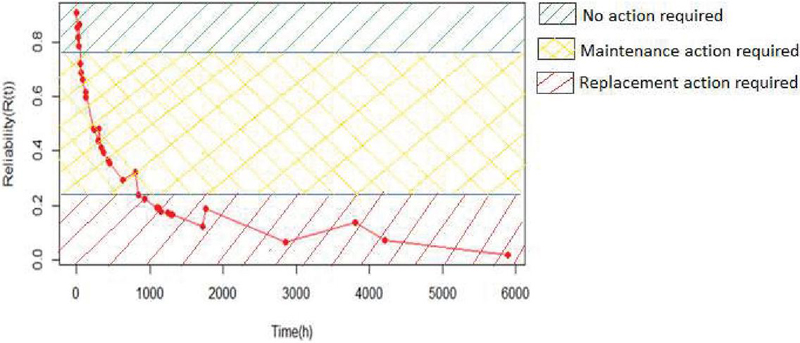
Figure 11 Maintenance and replacement threshold of reliability.
Predictive maintenance is an important part of modern industrial development and has become a research interest in Industry 4.0. As a part of the predictive maintenance strategy, this work proposes a reliability-based strategy with critical reliability value at which maintenance or a replacement decision is sought. The reliability value corresponding to each time to failure has been read on the reliability curve. The reliability frequency at the time to failure vs. time to failure has been plotted. It has been observed that the frequency distribution follows the normal curve. The mean () and standard deviation () for the normal curve has been estimated as the mean, and std. dev .
From the calculated reliability value, the threshold value of reliability for predictive maintenance () and the threshold value of reliability for replacement () has been proposed. Based on the case study system, this research recommends predictive maintenance for the case study motor as and when its reliability reaches around 78.77%, and it is required to be overhauled or replaced when the reliability is 25.24%.
5 Conclusions
In this research a probabilistic graphical method has been developed to study the effect of modes and causes of failure and operating conditions on the operational reliability and RUL of machinery through a case study. It has been observed that the failure of motor and consequently its RUL highly dependent on the operating conditions and maintenance action. The operational reliability is significantly increased after a maintenance action and rapidly decreasing due to effects of OCs. At an initial age of 500 hours the estimated RUL of the motor is 7250 hours whereas the RUL is only 5700 hours when the operation conditions are taken into account. Also a threshold value of reliability-based strategy has been proposed to recommend the critical reliability value at which maintenance or a replacement is required/warranted to avoid unduly long downtime of the system. For the physical asset to function efficiently and dependably, all prescribed conditions are required to be followed. A physical system should have limited reliability issues over its lifetime when installed and operated under stated conditions and maintained following the prescribed procedure. However, when one of the factors, such as environmental factor, or maintenance action, is not met, the system can fail prematurely, reducing its reliability and increasing the industry’s maintenance and operational costs.
References
[1] Ramakumar, R. Engineering reliability fundamentals and applications Prentice-Hall, NJ, 1993.
[2] Rausand, M. and Hoyland, A. System Reliability Theory: Models, Statistical Methods, and Applications. 2nd Ed, John Wiley & Sons, Hoboken, 2004.
[3] Rausand, M. Reliability of Safety-Critical Systems: Theory and Applications. 2nd Ed, John Wiley & Sons, Hoboken, 2014.
[4] Rao S. U. M. Influence of environmental factors on component/equipment reliability, Indian Journal of Engineering & Materials Sciences Vol. 5, June 1998, pp. 121–123.
[5] Wilson, D. S., Smith, R.: ‘Electric motor reliability model’. Final Technical Report, Radc-Tr-77-408, December 1977.
[6] Gomez-Pau Riba and Moreno-Eguilaz M. Time series RUL estimation of medium voltage connectors to ease preventive maintenance, Appl Sci 2020; 10(24):9041.
[7] Rahimel M. J. and Ghodrati B. Remaining useful life improvement for the mining railcars under operational conditions. Int J Min Reclam Evviron 2022; 36(1): 46–67.
[8] Kumar D. and Westberg U. Some reliability models for analyzing the effect of operating conditions. Int J Reliab Qual Safe Eng 1997; 4(2): 133–148.
[9] Ghodrati B. and Kumar U. Reliability and operating environment-based spare parts estimation approach: a case study in Kiruna mine, Sweden. J Qual Maint Eng 2005; 11(2): 169–184.
[10] Gasmi S., Love C. E. and Kahle W. A general repair, proportional-hazards, framework to model complex repairable systems. IEEE T Reliab 2003; 52(1): 26–32.
[11] Barabadi A., Barabady J. and Markeset T. A methodology for throughput capacity analysis of a production facility considering environment condition. Reliab Eng Syst Safe 2011; 96(12): 1637–1646.
[12] Helge L. Analysis of survival times using Bayesian networks. 2002
[13] Langseth, H. Portinale L Bayesian networks in reliability; Reliability Engineering & System Safety, 2007
[14] Cai B. Xiangdi Kong; Yonghong Liu; Jing Lin; Xiaobing Yuan; Hongqi Xu; Renjie Ji “Application of Bayesian Networks in Reliability Evaluation,” IEEE Trans on Ind. Inf., vol. 15, no. 4, pp. 2146–2157, 2019, doi: 10.1109/TII.2018.2858281.
[15] Kumar, D. Jana, D., Gupta S., & Yadav, P. Bayesian Network Approach for Dragline Reliability Analysis: a Case Study. Mining, Metallurgy & Exploration. 40. 2023 10.1007/s42461-023-00729-x.
[16] H. Langseth and L. Portinale, “Bayesian networks in reliability”, Rel. Eng. Syst. Safety, vol. 92, no. 1, pp. 92–108, 2007.
[17] H. A. Khorshidi, I. Gunawan and M. Y. Ibrahim, “Data-driven system reliability and failure behavior modeling using FMECA”, IEEE Trans. Ind. Informat., vol. 12, no. 3, pp. 1253–1260, Jun. 2016.
[18] B. Cai et al., “Application of Bayesian Networks in Reliability Evaluation,” in IEEE Transactions on Industrial Informatics, vol. 15, no. 4, pp. 2146–2157, April 2019, doi: 10.1109/TII.2018.2858281.
[19] Abhilash, B. T., Manjunatha, H. M., Ranjan, N. A., et al.: ‘Reliability assessment of induction motor drive using failure mode effects analysis’, IOSR J. Electr. Electron. Eng. (IOSR-IEEE), 2013, 6, (6), pp. 32–36, E-ISSN: 2278-1676, P-Issn: 2320-3331.
[20] Bonnett, A. H.: “Root cause ac motor failure analysis with a focus on shaft failures”, IEEE Trans. Ind. Appl., 2000, 36, (5), pp. 1435–1448 (doi: https://doi.org/10.1109/28.871294).
[21] Mohammad. R. Residual lifetime estimation for the mining truck tires. Proceedings of the Institution of Mechanical Engineers, Part D: Journal of Automobile Engineering. 2022. 10.1177/09544070221121855.
[22] Rusu-Zagar, C., Petru N., Valentin N., George M., Rusu-Zagar G., Tanta S., Radu. S. Method for estimating the lifetime of electric motors insulation. 2013 - 8th International Symposium on Advanced Topics in Electrical Engineering, ATEE 2013. 1–6. 10.1109/ATEE.2013.6563466.
[23] Kumar D. and Klefsjo B. Proportional hazards model: a review. Reliab Eng Syst Safe 1994; 44(2): 177–188.
[24] Deloux E., Dijoux Y. and Fouladirad M. Generalization of the proportional hazards model for maintenance modelling and optimization. Proc IMechE, Part O: J Risk and Reliability 2012; 226(5): 439–447.
[25] Fuqing Y. and Kumar U. Proportional intensity model considering imperfect repair for repairable systems. Int J Pedag Innov New Technol 2013; 9(2): 163–174.
[26] Morad A. M., Pourgol-Mohammad M. and Sattarvand J. Application of reliability-centered maintenance for productivity improvement of open pit mining equipment: case study of Sungun copper mine. J Central South Univ 2014; 21(6): 2372–2382.
[27] Ann Lundteigen M., Rausand M. Reliability of safety instrumented systems: Where to direct future research? 15 November 2010 https://doi.org/10.1002/prs.10390.
Biographies
Debasis Jana is a senior researcher at the Computer and Data Analytics Lab, Department of Mining Engineering, Indian Institute of Technology (Banaras Hindu University), Varanasi. He earned his Bachelor of Engineering, and Master of Technology in 2011, 2014 respectively. He has so far authored 1 book chapter, about 7 articles in reputed journals and about 10 research papers in conferences or workshops. His research interests include reliability engineering, data analytics, and related areas of statistics.
Deepak Kumar is currently working in Orbit & Skyline semiconductors as the Reliability Engineer. He has earned his PhD from the Indian Institute of Technology (Banaras Hindu University) Varanasi, India. His PhD title was “Reliability Analysis of Dragline Using Bayesian Network”. He has published eight research papers and seven conference papers in reputed international; and national publications. Apart from this, he has attained more than dozens of workshops and FDPs. He is also interested in investigating reliability analysis using repairable and non-repairable concept on component and system level, application of different maintenance schedules and FMECA. Also, he shows an interest in remaining useful life estimation and uses of machine learning techniques like different modes of regression, classifiers, neural networks in reliability estimation, and uses of risk and safety aspects in mining industries. He holds the MTech in Design and Production Engineering from the National Institute of Technology Durgapur, India. He pursued his Bachelor of Engineering from Nagpur University, Nagpur.
Suprakash Gupta is a Professor and Head of the Department of Mining Engineering at the Indian Institute of Technology (Banaras Hindu University), Varanasi. Prof. Gupta completed his B.E. in Mining Engineering from the University of Calcutta (Bengal Engineering College, Shibpure, Howrah, WB) in 1992 securing First class. He did his M.Tech. and Ph.D. in Mining Engineering from Indian Institute of Technology, Kharagpur with First class in his Masters Course. He has been working in the field of in-service reliability estimation and maintenance of equipment and systems for over 25 years. Prof. Gupta has published more than 100 research publications in various international/national Journals and Sem. / Conf. / Symp. till date.
Sukomal Pal is an associate professor in the Department of Computer Science and Engineering at IIT(BHU), India. He earned his Bachelor of Engineering, Master of Technology and Doctor of Philosophy in 1999, 2005 and 2012 respectively. He has been serving as the associate editor of Springer Nature Computer Science journal since 2021. He has so far authored 2 books including an undergraduate textbook, 1 book chapter, about 30 articles in reputable journals and about 50 research papers in conferences or workshops. His research interests include information retrieval, recommender system, data analytics and related areas of text processing.
Sandip Ghosh received Bachelor of Engineering degree in electrical engineering from the Bengal Engineering College (DU), Shibpur, India, in 1999; master’s degree in control system engineering from Jadavpur University, India, in 2003, and Ph.D. degree from IIT Kharagpur, Kharagpur, India, in 2010. He was with the National Institute of Technology, Rourkela, India, and was also a Postdoctoral Fellow with the University of Cape Town, South Africa. He is currently an Associate Professor in electrical engineering with the IIT (BHU), Varanasi, India. His research interests include Robust control design, decentralized control, and networked control systems.
Journal of Reliability and Statistical Studies, Vol. 16, Issue 2 (2023), 373–392.
doi: 10.13052/jrss0974-8024.16210
© 2024 River Publishers