Design of Control Charts Using Repetitive Sampling: A Comparative Study of Conditional Expected Delay
Nasrullah Khan1, Muhammad Aslam2,* and Mohammed Albassam2
1College of Statistical Sciences, University of the Punjab, Lahore 54000, Pakistan
2Department of Statistics, Faculty of Science, King Abdulaziz University, Jeddah, 21551, Saudi Arabia
E-mail: nasrullah.stat@pu.edu.pk; aslam_ravian@hotmail.com; malbassam@kau.edu.sa
*Corresponding Author
Received 12 March 2024; Accepted 11 July 2024
Abstract
Repetitive sampling is a valuable technique in statistical quality control, especially when industrial engineers face uncertainty with initial sample information. This study aims to develop a Conditional Expected Delay (CED) metric, focusing on scenarios without false alarms prior to a process shift, by using repetitive sampling for control charts. Additionally, we will evaluate the performance of control charts with repetitive sampling against traditional EWMA control charts in terms of CED, considering various smoothing constants and shift values. Our results demonstrate that control charts using repetitive sampling consistently outperform EWMA control charts. Therefore, based on our comprehensive analysis, we conclude that control charts with repetitive sampling are more efficient and effective than EWMA control charts.
Keywords: Control chart, repetitive sampling, simulation, CED, efficiency.
1 Introduction
Shewhart control charts offer a straightforward and user-friendly approach to monitor industrial processes effectively. Typically, these charts are tailored for making decisions based on individual sample data. The operational mechanism of Shewhart control charts revolves around the utilization of three distinct control limits: the lower control limit (LCL), central limit (CL), and upper control limit (UCL). If the statistical data plotted on the chart exceeds either the LCL or UCL, it signals that the process is considered out of control. For further details, refer to Fu et al. [1] for additional information. In practical scenarios, there are instances where decision-makers find it challenging to determine the state of a process definitively. They may be unable to conclusively classify it as either in-control or out-of-control based on a single sample. When faced with such indecision, one approach is to employ a control chart that utilizes repetitive sampling. The sampling process continues until a final determination regarding the state of the controlled process can be confidently reached. It’s worth noting that the control chart employs repetitive sampling functions similarly to the Shewhart control chart when the sample size is less than or equal to the average sample number but exhibits greater efficiency in the case of repetitive sampling. The use of repetitive sampling plans for inspecting finished lots is exemplified in the work of Sherman [2]. The introduction of repetitive sampling into the realm of control charts was pioneered by Aslam et al. [3]. Furthermore, Aslam et al. [4] demonstrated the advantages of repetitive sampling over the Shewhart control chart, particularly when the sample size matches the average sample number. For further applications of the control chart employing repetitive sampling, additional resources can be explored in Mughal et al. [5], Olatunde A Adeoti and Olaomi [6], Enami and Torabi [7], Al Nasser et al. [8], Nezhad and Nesaee [9], Olatunde Adebayo Adeoti and Rao [10] and [11].
Roberts [12] was a trailblazer in introducing the exponential weighted moving average statistic as a means to enhance the sensitivity of control charts in detecting subtle shifts within a process. In a subsequent development, Olatunde Adebayo Adeoti [13] explored the application of the double EWMA method in the design of control charts through repetitive sampling. Building on this foundation, Aslam et al. [14] conducted research on EWMA with repetitive sampling. Finally, Naveed et al.[15] introduced a modified EWMA-based control chart utilizing repetitive sampling techniques. Saleh et al. [16] suggested that the control chart using repetitive sampling should be designed to ensure that the average sample number (ASN) is as close as possible to the fixed sample size.
While there exists a substantial body of literature on control charts employing repetitive sampling for zero-state scenarios, a noticeable gap exists when it comes to the design of control charts using repetitive sampling in steady-state situations. This paper aims to bridge this gap by introducing a control chart designed with repetitive sampling techniques and assessing its performance using the conditional expected delay (CED) under condition on having no false alarms prior to the process shift. We will demonstrate the effectiveness of this newly proposed control chart compared to the conventional EWMA control chart across different control chart parameter values.
2 EWMA and Repetitive Charts
Assume a random variable Y with a normal distribution, denoted as . Additionally, let represent the value observed at time from , which provides the mean and variance for each and . Define as the shifted mean, given by , where: represents the mean for the in-control process, represents the magnitude of the shift in the process and represents the standard deviation. With this information in mind, we can describe the EWMA control chart using both single sampling and repetitive sampling as follows:
2.1 EWMA Chart Using Single Sampling
EWMA control charts are specifically crafted to detect subtle shifts within a process. These charts leverage both current and historical data to assess the process’s condition. When employing the EWMA control chart, greater emphasis is placed on the most recent observations. The EWMA statistic , which hinges on the smoothing constant ranging from 0 to 1, is defined as follows:
| (1) |
The initial value is set to . The observation at time , denoted as , is generated from the standard normal distribution. Assume that and the EWMA statistic reduces to Shewhart chart control chart when , [17]. The time varying lower control chart (LCL) and upper control limit (UCL) with control limit coefficient are given as
| (2) | |
| (3) |
A single sample is selected and statistic is calculated, the process is declared to be out-of-control when or .
2.2 EWMA Chart Using Repetitive Sampling
Here, we introduce the operational procedure for the EWMA control chart employing repetitive sampling. This particular type of control chart is employed when decision-makers remain uncertain after reviewing the initial sample. The chart operates with the utilization of four control limits: two inner control limits denoted as and two outer limits denoted as . These control limits are defined as follows:
| (4) | |
| (5) | |
| (6) | |
| (7) |
A sample is drawn from the production process, and the process is considered in control if the value of falls within the range defined by and . If there is uncertainty, the sampling process is repeated until a conclusive decision regarding the process’s in-control or out-of-control status is reached. The ASN for the repetitive sampling is expressed by
| (8) |
where is the probability of repetition.
3 Conditional Expected Delay
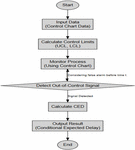
In this section, we will explore the distinction between the zero-state and steady-state concepts in control chart design. When designing a control chart in the zero-state scenario, a process shift is introduced immediately at time without allowing any subgroups to be in-control initially. It’s important to note that the performance of a zero-state control chart is assessed using the average run length (ARL), which represents the expected number of samples required before the process goes out of control. When comparing control charts, the one with the smaller ARL is considered more efficient than others. Conversely, in the steady-state evaluation of control charts, we use the concept of conditional expected delay (CED)under condition on having no false alarms prior to the process shift. In steady-state control charts, a chart with a lower CED is deemed more efficient than its counterparts. CED is determined by establishing specific subgroups as in-control before any process shift occurs. More information can be seen in Knoth et al. [18], Riaz et al. [19], and Knoth [20]. The flow chart indicates the simulation process is shown in Figure 1.
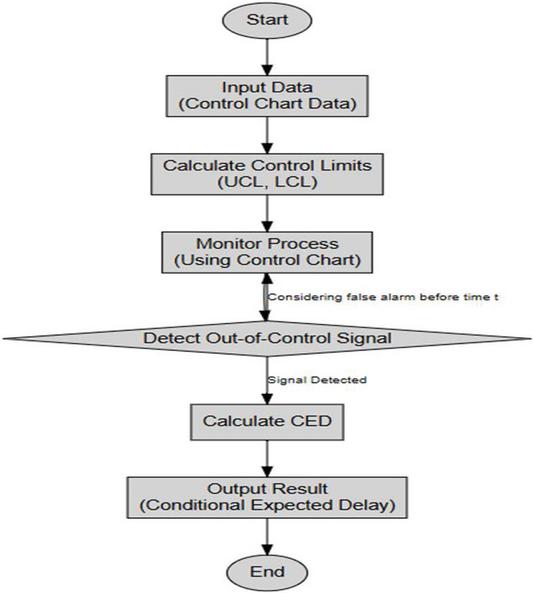
Figure 1 The flow chart indicate the simulation process.
4 Performance Evaluation of the Proposed Chart
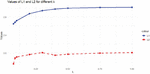
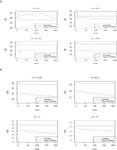
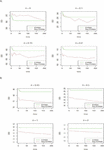
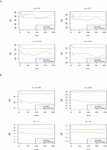
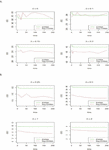
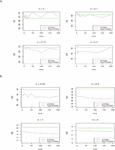
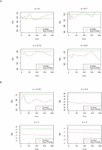
In this section, we will present the performance of the proposed control chart using the CED. We used the several values of and in calculating the values of CEDcondition on having no false alarms prior to the process shift. The control limits coefficients for two charts are shown in Table 1. We also reported the values of ASN for the in-control process in Table 1. We reported the ASN for various shifts in Table 2. From Table 2, it can be seen that the values of ASN are close to the fixed sample size 1. For a large , the values of ASN are slightly away from the sample size. The algorithm used to determine the values of CED at various values of , and are shown in Figure 1. The curves illustrate the behavior of the smoothing constant for various values of lambda are shown in Figure 2. Figure 3 is presented for , Figure 4 is presented for , Figure 5 is presented for , Figure 6 is presented for , Figure 7 is presented for and Figure 8 is presented for . We used in Figures 2–7. From Figures 2–3, it can be noted that the CED of the control chart using repetitive sampling is less than the CED of the EWMA control chart using single sampling. In addition, it is clear from Figure 1, the difference between CED of two control chart increase as increase. From Figures 3–8, it can be see that the CED of the control chart using repetitive sampling and control chart using single sampling are near to each other when . In addition, for larger values of , the proposed control chart using repetitive sampling is more efficient than the control chart using single sampling when .
Table 1 Control limits coefficients
| Repetitive Sampling | Single | |||
| ASN | ||||
| 0.075 | 2.649 | 1.758 | 2.6198 | 1.06 |
| 0.0875 | 2.685 | 1.888 | 2.6645 | 1.04 |
| 0.1 | 2.718 | 1.913 | 2.7015 | 1.04 |
| 0.2 | 2.875 | 1.967 | 2.859 | 1.04 |
| 0.3 | 2.94 | 2.01 | 2.925 | 1.04 |
| 0.4 | 2.975 | 1.95 | 2.959 | 1.05 |
| 0.5 | 2.995 | 1.974 | 2.977 | 1.04 |
| 0.75 | 3.011 | 1.998 | 2.997 | 1.04 |
| 1.0 | 3.014 | 2.01 | 2.9997 | 1.04 |
Table 2 ASN for various shifts
| 0 | 0.1 | 0.15 | 0.2 | 0.25 | 0.5 | 1 | 2 | |||
| ASN | ||||||||||
| 0.075 | 2.649 | 1.758 | 1.066 | 1.089 | 1.118 | 1.157 | 1.207 | 1.552 | 1.993 | 1.864 |
| 0.0875 | 2.685 | 1.888 | 1.046 | 1.062 | 1.080 | 1.107 | 1.140 | 1.361 | 1.692 | 1.649 |
| 0.1 | 2.718 | 1.913 | 1.045 | 1.058 | 1.075 | 1.098 | 1.127 | 1.345 | 1.686 | 1.653 |
| 0.2 | 2.875 | 1.967 | 1.045 | 1.053 | 1.063 | 1.077 | 1.096 | 1.257 | 1.757 | 1.865 |
| 0.3 | 2.94 | 2.01 | 1.042 | 1.047 | 1.054 | 1.063 | 1.075 | 1.186 | 1.658 | 1.955 |
| 0.4 | 2.975 | 1.95 | 1.052 | 1.056 | 1.062 | 1.070 | 1.081 | 1.179 | 1.709 | 2.410 |
| 0.5 | 2.995 | 1.974 | 1.049 | 1.052 | 1.057 | 1.063 | 1.071 | 1.143 | 1.535 | 2.509 |
| 0.75 | 3.011 | 1.998 | 1.047 | 1.049 | 1.051 | 1.055 | 1.059 | 1.098 | 1.306 | 2.675 |
| 1 | 3.014 | 2.01 | 1.046 | 1.047 | 1.048 | 1.051 | 1.053 | 1.076 | 1.187 | 2.142 |
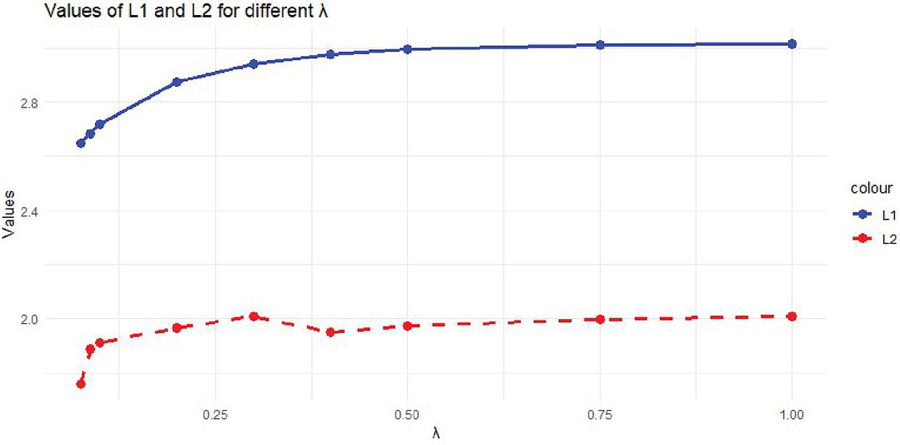
Figure 2 The curves illustrate the behavior of the smoothing constant for various values of lambda.
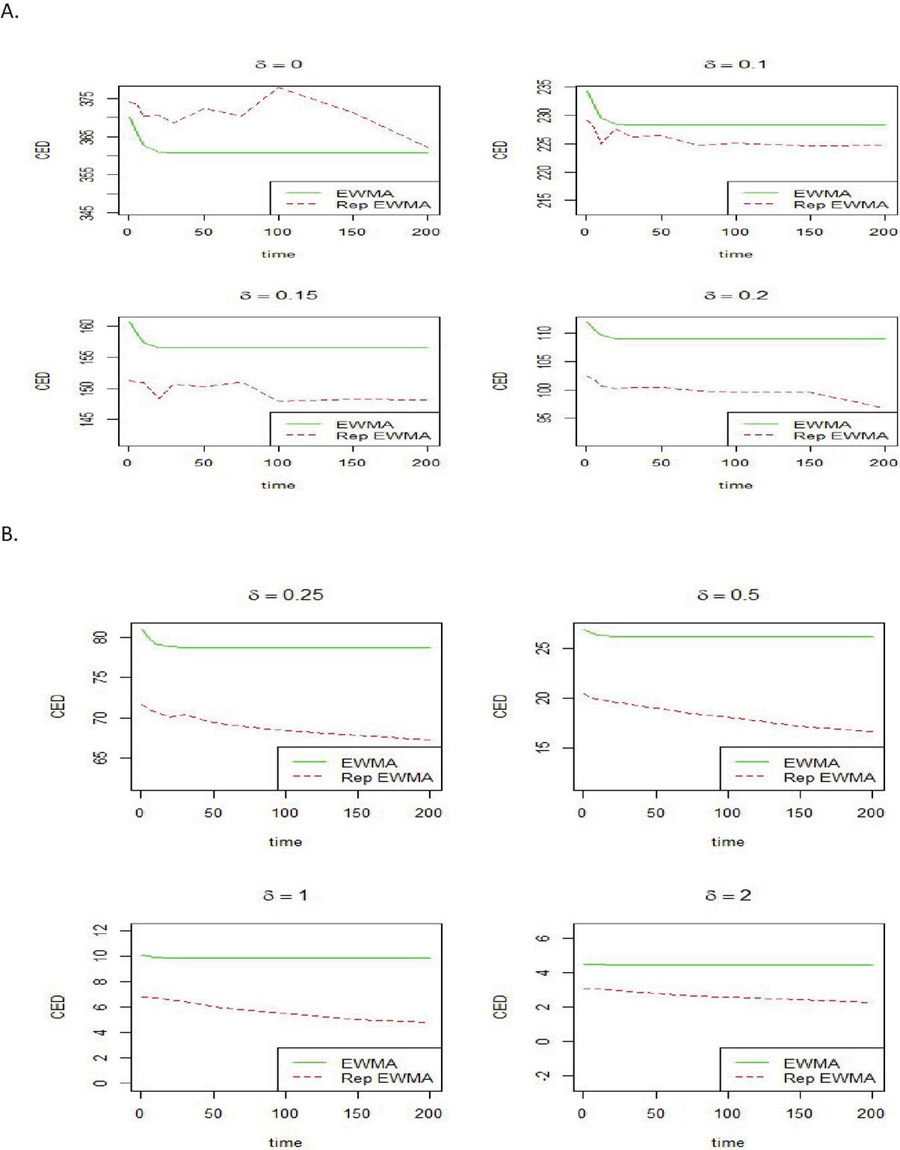
Figure 3 CED of two control charts when .
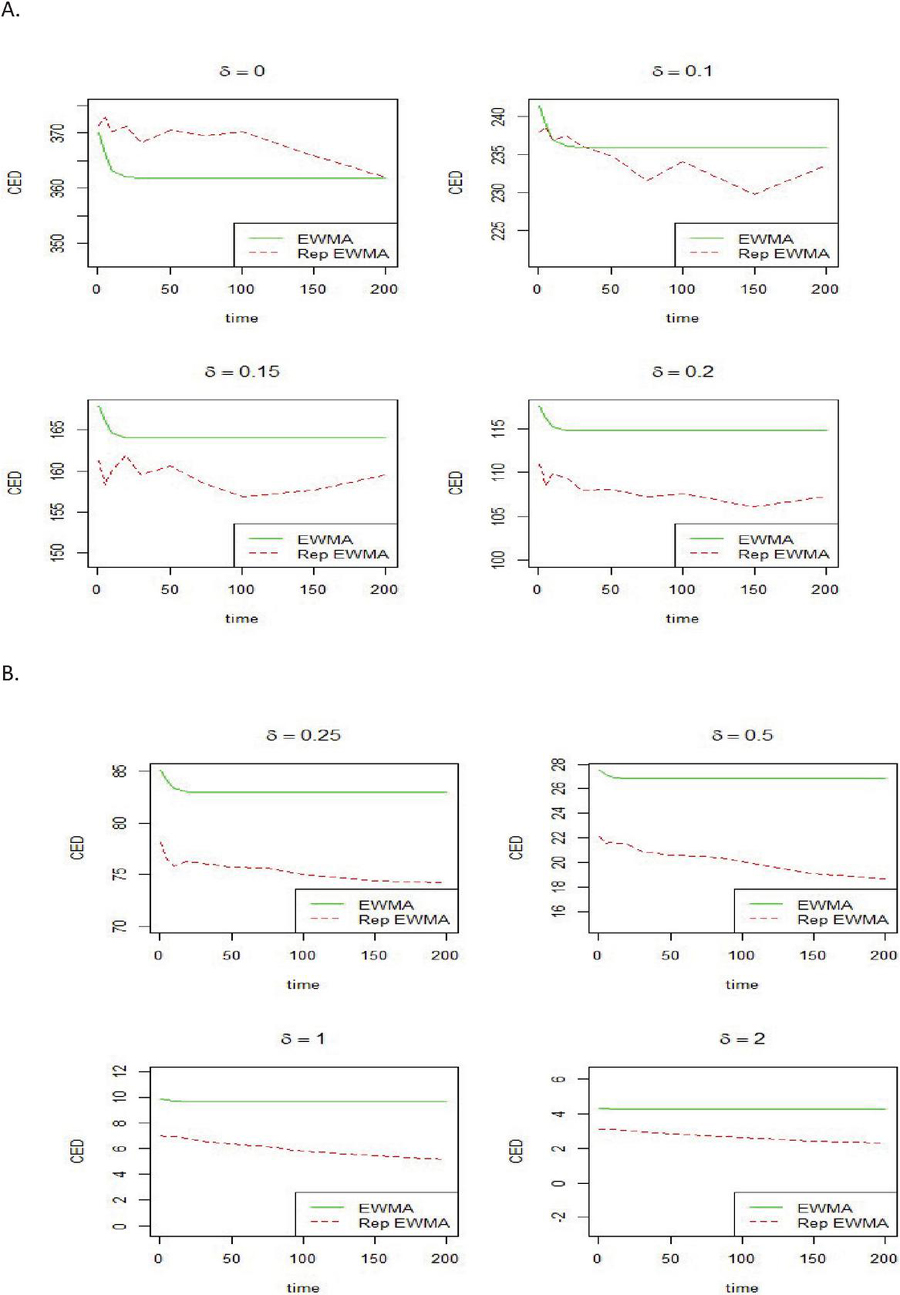
Figure 4 CED of two control charts when .
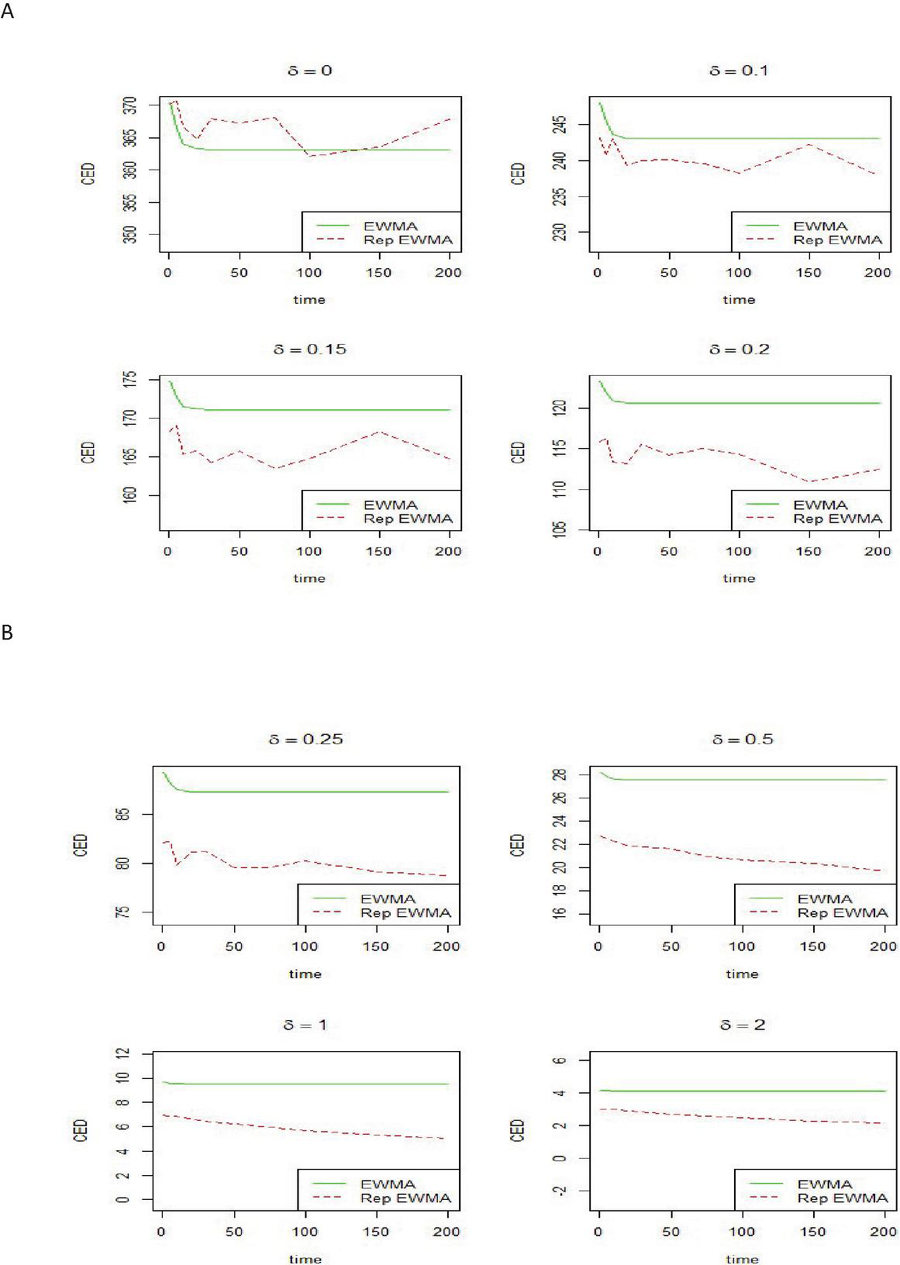
Figure 5 CED of two control charts when .
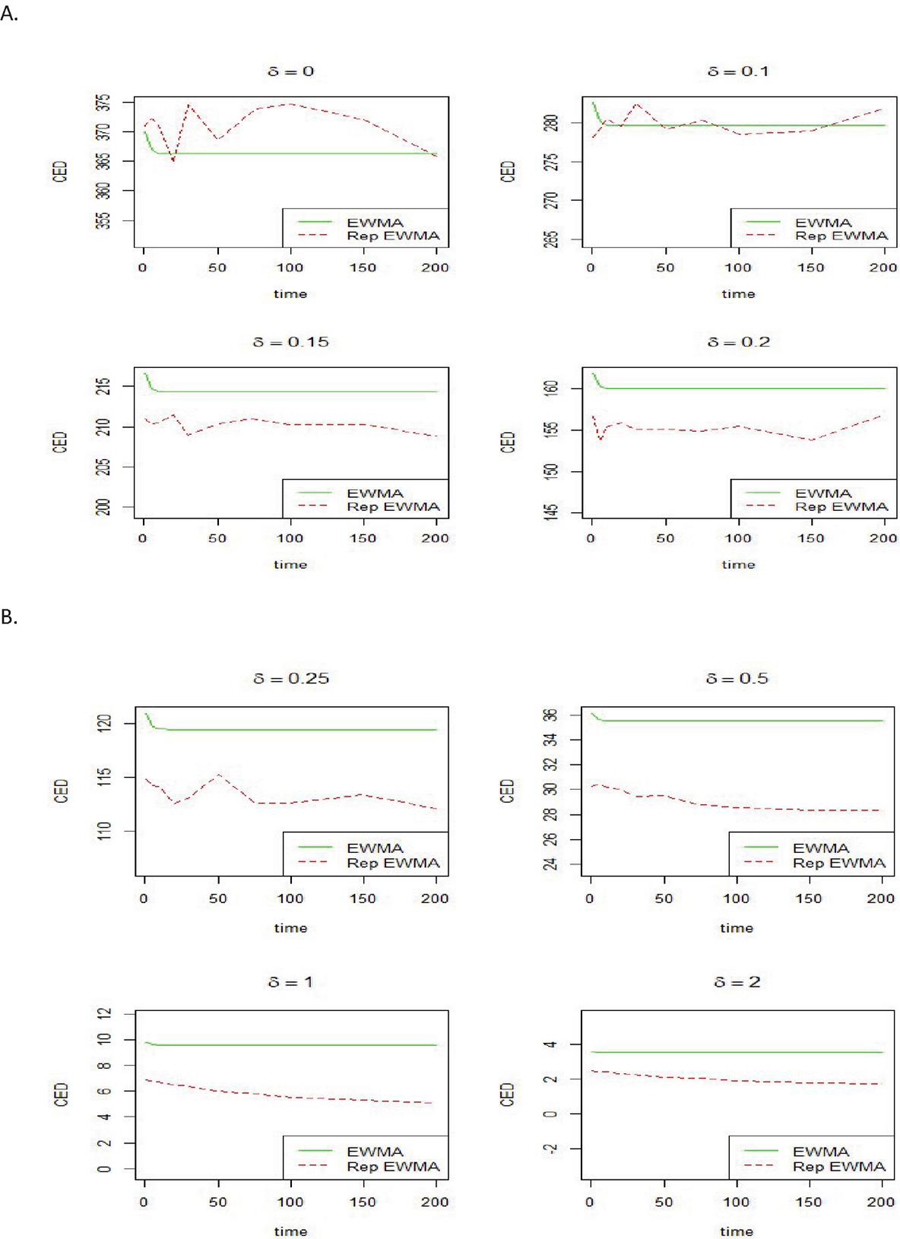
Figure 6 CED of two control charts when .
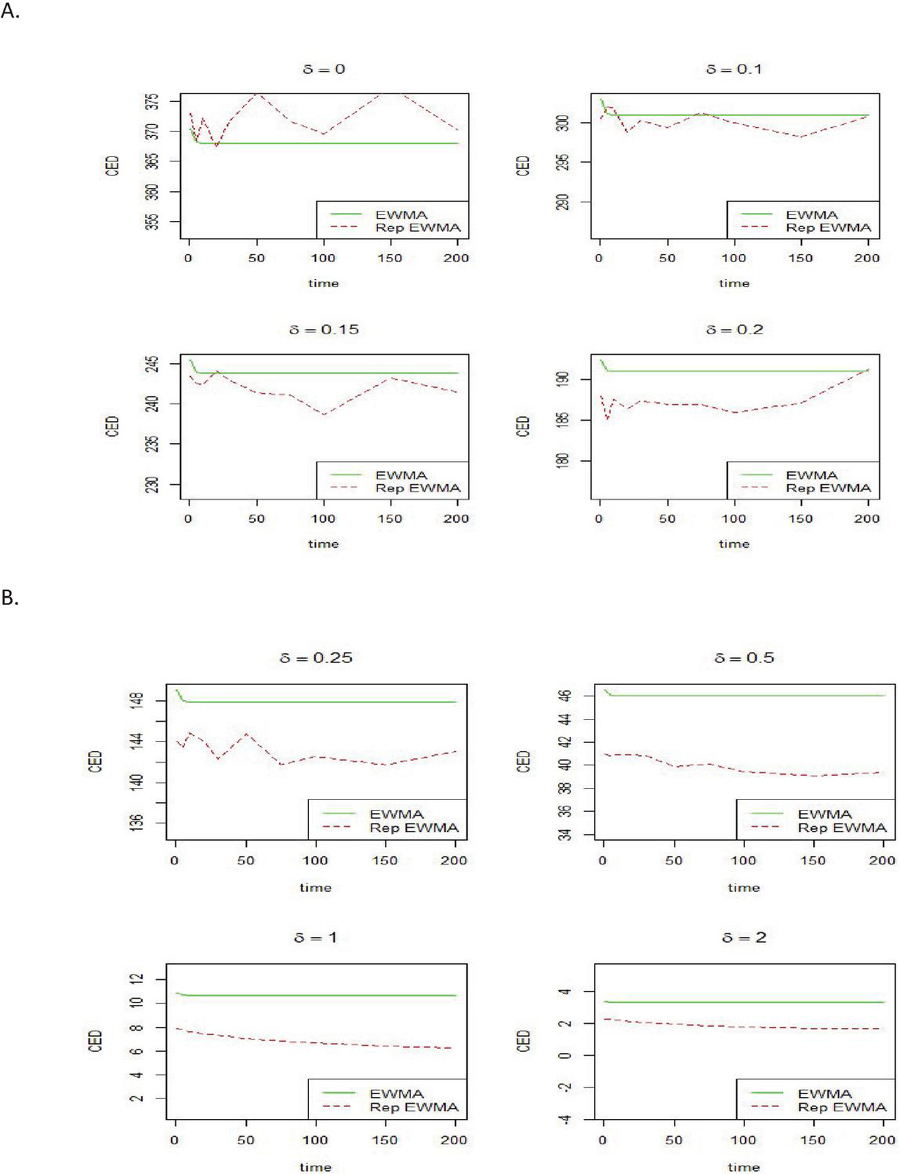
Figure 7 CED of two control charts when .
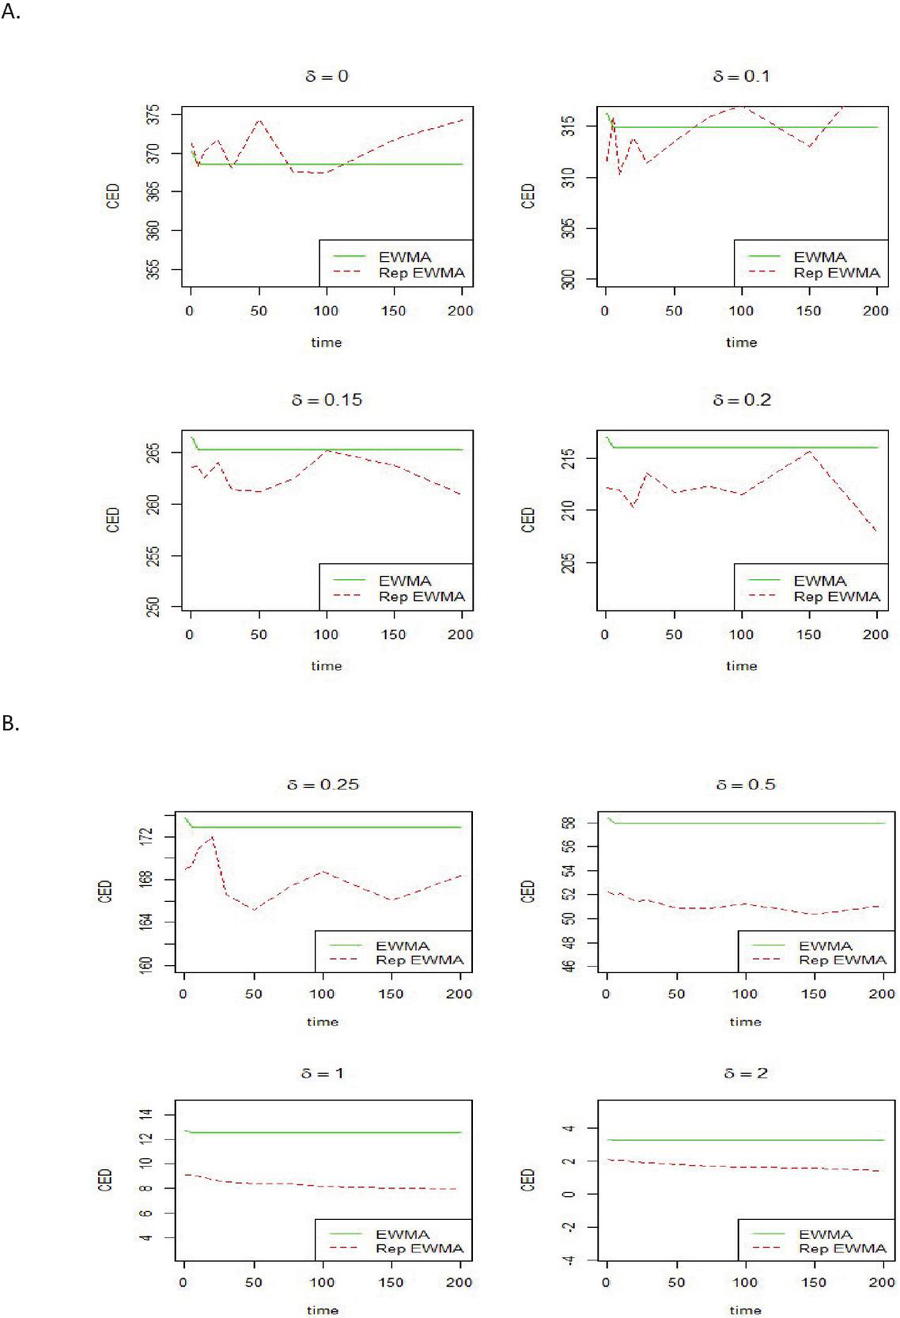
Figure 8 CED of two control charts when .
5 Concluding Remakes
In this study, we have explored the application of repetitive sampling in the design of control charts, with a particular focus on the Conditional Expected Delay (CED) process. Through extensive simulation and analysis, we have demonstrated the effectiveness and efficiency of control charts using repetitive sampling compared to the traditional EWMA control charts. Our findings highlight the potential for significant improvements in quality control processes when facing uncertainty in decision-making. The results of our study consistently demonstrated the superiority of control charts employing repetitive sampling. These charts consistently outperformed EWMA control charts across various values of smoothing constants and shifts. The CED profiles clearly indicated that the control chart using repetitive sampling significantly reduced the expected delay in detecting process shifts, thus improving the overall efficiency of quality control. In conclusion, our study underscores the value of repetitive sampling as a powerful tool for enhancing statistical quality control. We encourage further research and practical implementation of control charts employing repetitive sampling to capitalize on the efficiency gains and decision-making improvements demonstrated in this study. Ultimately, embracing these innovative approaches can lead to more effective quality control practices and better outcomes for industries worldwide. The proposed control chart could be linked to time-dependent information measures, in order to quantify the uncertainty of the process Contreras-Reyes et al. [21].
Acknowledgments
The authors are deeply thankful to the editor and reviewers for their valuable suggestions to improve the quality and presentation of the paper.
References
[1] Fu, X., R.-f. Wang, and Z.-y. Dong, Application of a Shewhart control chart to monitor clean ash during coal preparation. International Journal of Mineral Processing, 2017. 158: p. 45–54.
[2] Sherman, R.E., Design and evaluation of a repetitive group sampling plan. Technometrics, 1965. 7(1): p. 11–21.
[3] Aslam, M., M. Azam, and C.-H. Jun, New attributes and variables control charts under repetitive sampling. Industrial Engineering and Management Systems, 2014. 13(1): p. 101–106.
[4] Aslam, M., N. Khan, and C.-H. Jun, A new S 2 control chart using repetitive sampling. Journal of Applied Statistics, 2015. 42(11): p. 2485–2496.
[5] Mughal, M.A., M. Azam, and M. Aslam, Restricted Repetitive Sampling in Designing of Control Charts. Pakistan Journal of Statistics and Operation Research, 2017: p. 297–312.
[6] Adeoti, O.A. and J.O. Olaomi, Capability index-based control chart for monitoring process mean using repetitive sampling. Communications in Statistics-Theory and Methods, 2018. 47(2): p. 493–507.
[7] Enami, S. and H. Torabi, A Repetitive Sampling-based Control Chart for Multivariate Weighted Poisson Distribution with Two Different Indices. Journal of Statistical Research of Iran JSRI, 2019. 16(1): p. 245–254.
[8] Al-Nasser, A.D., E. Ciavolino, and A. Al-Omari, Extreme ranked repetitive sampling control charts. Pesquisa Operacional, 2020. 40.
[9] Nezhad, F. and M. Nesaee, Development of a new variable repetitive group sampling plan based on EWMA yield index. Scientia Iranica, 2021. 28(4): p. 2457–2476.
[10] Adeoti, O.A. and G.S. Rao, Attribute Control Chart for Rayleigh Distribution Using Repetitive Sampling under Truncated Life Test. Journal of Probability and Statistics, 2022. 2022.
[11] Sathya Narayana Sharma, K., Design of multiple deferred state repetitive group sampling plans for life tests based on generalized gamma distribution. Quality Engineering, 2023. 35(2): p. 248–257.
[12] Roberts, S., Control chart tests based on geometric moving averages. Technometrics, 1959. 1(3): p. 239–250.
[13] Adeoti, O.A., A new double exponentially weighted moving average control chart using repetitive sampling. International Journal of Quality & Reliability Management, 2018. 35(2): p. 387–404.
[14] Aslam, M., et al., EWMA control chart using repetitive sampling for monitoring blood glucose levels in type-II diabetes patients. Symmetry, 2019. 11(1): p. 57.
[15] Naveed, M., et al., Designing of control chart of extended EWMA statistic using repetitive sampling scheme. Ain Shams Engineering Journal, 2021. 12(1): p. 1049–1058.
[16] Saleh, N.A., M.A. Mahmoud, and W.H. Woodall, A re-evaluation of repetitive sampling techniques in statistical process monitoring. Quality Technology & Quantitative Management, 2023: p. 1–19.
[17] Montgomery, D.C., Introduction to statistical quality control2020: John Wiley & Sons.
[18] Knoth, S., et al., The impracticality of homogeneously weighted moving average and progressive mean control chart approaches. Quality and Reliability Engineering International, 2021. 37(8): p. 3779–3794.
[19] Riaz, M., et al., On reassessment of the HWMA chart for process monitoring. Processes, 2022. 10(6): p. 1129.
[20] Knoth, S., Another objection to the homogeneously weighted moving average control chart. Quality and Reliability Engineering International, 2023. 39(1): p. 353–362.
[21] Contreras-Reyes, J.E., D.I. Gallardo, and O. Kharazmi, Time-dependent residual Fisher information and distance for some special continuous distributions. Communications in Statistics-Simulation and Computation, 2022: p. 1–21.
Biographies

Nasrullah Khan is currently working as Associate Professor in the College of Statistical and Actuarial Sciences, University of the Punjab. He has diverse experience of working in the various institute. He started his carrier from Crop Reporting Services, Punjab after that he joined Pakistan Bureau of Statistics, where he remained involve in the processing of Survey and Census data. He joined lectureship in FGEI institutes in 2010 after that in 2015 he joined Jhang Campus of University of Veterinary and animal Sciences, Lahore. He has published more than 60 research articles in national and international Journals. He has interest to work in the field of Biostatistics, Statistical Quality Control and Official Statistics.

Muhammad Aslam is a distinguished academic in the Department of Statistics at King Abdulaziz University, Saudi Arabia. With extensive expertise in statistical methods and applications, Prof. Aslam has made significant contributions to the field, particularly in the development and application of advanced statistical techniques such as neutrosophic statistics. His research focuses on innovative approaches to handling uncertainty and imprecision in data analysis. Prof. Aslam’s work is recognized for its impact on both theoretical developments and practical applications in various domains.

Mohammed Albassam received his B.Sc. degree from Mathematics department at King Abdulaziz University in 1990, M.Sc. and Ph.D. degrees from School of Mathematics and Statistics at University of Sheffield, UK, in 1995 and 2000. He is currently working as a Professor at Statistics department in King Abdulaziz University. He has published many articles in International journals. His fields of interest are Statistical inference, Distributions theory, Neutrosophic Statistics and Time series Analysis.
Journal of Reliability and Statistical Studies, Vol. 17, Issue 1 (2024), 223–240.
doi: 10.13052/jrss0974-8024.1719
© 2024 River Publishers