Reliability Estimation of Parallel Systems with Diverse Failure Modes: Semi-Markov Model Approach
Priya Baloda, Amit Kumar* and Vikas Garg
Department of Mathematics, Chandigarh University, Gharuan, Mohali, Punjab, India-140413
E-mail: priyabaloda17@gmail.com; amitk251@gmail.com; gargvikas0314@gmail.com
*Corresponding Author
Received 26 August 2024; Accepted 11 November 2024
Abstract
This paper introduces a novel system consisting of two dissimilar units operating in parallel, each with distinct failure modes. This flexibility in units characteristics minimizes the risk of simultaneous failures due to common causes. The system’s mathematical model is developed using a semi-Markov approach, and a numerical method based on the regenerative point technique is applied to estimate various reliability measures, such as the mean time to system failure (MTSF) and system availability. Failure rates are modeled as exponentially distributed, while repair rates are allowed to follow arbitrary distributions. Additionally, the proposed model undergoes graphical analysis to evaluate system performance under varying parameters.
Keywords: Parallel unit system, semi-Markov process, reliability, sensitivity analysis.
1 Introduction
Reliability and redundancy are essential concepts in engineering, computing, and systems design, significantly impacting performance and user satisfaction. Reliability refers to a system’s ability to consistently perform its intended functions without failure, which is crucial for safety-critical applications such as aviation and medical devices. High reliability builds user trust and confidence, leading to improved customer retention and brand reputation. Moreover, reliable systems can enhance cost efficiency by minimizing downtime and reducing maintenance needs. In many industries, compliance with regulatory requirements for system reliability is necessary, emphasizing the importance of adherence to established safety and performance standards. Additionally, reliability is vital for maintaining data integrity in storage and processing systems, ensuring that data remains accurate and accessible over time. On the other hand, redundancy is a critical strategy for enhancing system resilience and fault tolerance. Redundant systems can maintain operation even when one or more components fail, thus improving overall availability and reliability. This feature is particularly important for critical applications that require uninterrupted service. Redundancy can also facilitate load balancing in computing environments, distributing workloads across multiple components to optimize performance and efficiency. Furthermore, it plays a crucial role in disaster recovery, providing backup options for data restoration and ensuring continuity in the event of catastrophic failures. By incorporating redundancy, organizations can effectively mitigate risks associated with hardware malfunctions, software bugs, and unforeseen events. In summary, both reliability and redundancy are vital for developing robust systems capable of withstanding challenges while effectively meeting user needs.
The pursuit of increased reliability is essential for long-term performance and operational efficiency in today’s industrial and technological environment. Additionally, the configurations and designs of industrial systems are becoming more complex, which affects their reliability. Experts are continuously striving to develop more productive and lucrative models despite the fact that society’s ever-increasing demands are complicating system designs. Moreover, the strength and effectiveness of such systems in the face of failures must be controlled. Strategies for improving reliability proposed by researchers include the provision of spare units, high-quality components, optimal configurations, and appropriate repair mechanisms.
Reliability analysis plays a crucial role in assessing the performance of systems with parallel units, particularly in the context of varying operational conditions and failure modes. Kumar and Gupta [1] analyzed a single-unit system model with a helping unit. Their study focused on the reliability of the system by incorporating the concept of a supplementary unit, which aids in reducing downtime and improving system performance. Kumar and Sirohi [2] examined a two-unit cold standby system where the repair of a partially failed unit is delayed. Their analysis emphasized the significance of this delay on system profitability and how better utilization of the units could lead to optimized system operation. Kumar and Sharma [3] investigated a system with two non-identical units operating in parallel, where inspection intervals and correlated lifetimes played a critical role in system reliability. They highlighted that non-identical units, when subjected to inspection, can offer practical insights into improving system efficiency. Singh and Poonia [4] used a probabilistic approach to evaluate the reliability of a two-unit parallel system with correlated lifetimes, considering the inspection process. They applied the regenerative point technique to demonstrate the impact of lifetime correlation on system reliability, underscoring the importance of this factor in reliability assessments.
Kumar, A. et al. [5] analyzed the cost implications of a finite capacity queue with server failures, balking, and a threshold-driven recovery policy, highlighting how these factors impact system costs and performance optimization. Shekhar, C., et al. [7] studied load-sharing redundant repairable systems with switching and reboot delays, addressing the challenges in reliability management under these conditions. Additionally, Shekhar, C. et al. [8] examined fault-tolerant redundant repairable systems with various failures and delays, offering valuable insights into the impact of delay factors on system performance. In recent, matrix method approach was used for sensitive analysis for standby ,vacation and common cause failure events in safety assessment (c.f. [7, 9, 10, 11, 13, 14, 6, 12]). Hu et al. [15] introduced a parallel Bayesian probabilistic integration framework for structural reliability analysis, focusing on small failure probabilities to enhance assessment accuracy. Ahmadi et al. [16] emphasized state-dependent mean residual time in their reliability modeling and maintenance planning for parallel systems, improving maintenance strategies. Bo et al. [17] proposed a DNN-based reliability evaluation method for multi-state series-parallel systems using a semi-Markov process, showcasing the potential of machine learning in reliability assessments.
Most studies are based on the assumption that all units operating in parallel are either identical or have identical failure rates. However, parallel systems consisting of dissimilar units with different modes of failure have not been investigated so far. Additionally, it is not always practical to use standard quality units due to their high cost. Different quality units may be utilized to enhance the profitability of the system. Furthermore, the dissimilar nature of these system units ensures that they are less likely to fail simultaneously due to common causes of failure. In this article, a profit analysis of a stochastic model with two dissimilar units is conducted. One unit is of merit quality and has two types of failures: partial and total failure, while the other unit of low merit quality has only one mode of failure. A single server is available for the repair of both types of units. Numerical and sensitivity analyses are also performed using the Regenerative Point Technique and the semi-Markov process. To illustrate the simulated results, graphs have been created.
2 System Description
The system model consists of various states representing the operational and repair conditions of two dissimilar parallel units. In the state , the first unit is operative while the second unit is also operative. In the partially failed state of the first unit, denoted as , the first unit remains operative while undergoing simultaneous repairs. The state signifies that the repair process of the partially failed and operative first unit is continuing from a previous state. When the system is in the state , the first unit is completely failed while the second unit is under repair. Similarly, in the state , the totally failed first unit is under repair, and the second unit is also under repair from its previous state. The notation represents a partially failed first unit that remains operative but is waiting for repair. Finally, the state indicates that the totally failed first unit is waiting for repair, and the state signifies that the failed second unit is either waiting for repair or waiting for repair from a previous state. In the following analysis, a model consisting of two dissimilar parallel units is examined based on the assumptions outlined below:
∙ Unit 1 experiences two types of failures, while Unit 2 is characterized by a single mode of failure.
∙ Unit 1 operates in a partial failure mode, with repairs being conducted simultaneously during its operation.
∙ A single server facility is available to facilitate the repair processes for both units.
∙ The failure rates of both units are assumed to follow negative exponential distributions.
∙ The repair rates are treated as variable, allowing for a range of scenarios to be analyzed within the model.
∙ In the proposed model, are regenerative states.
2.1 Notations
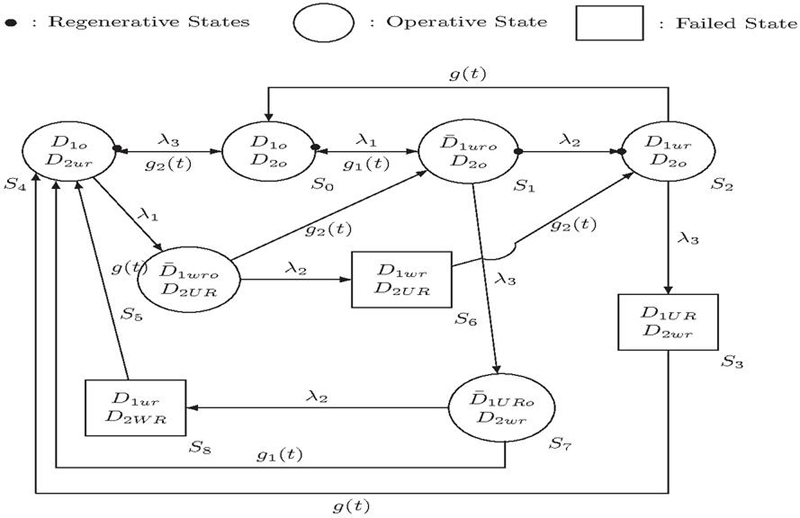
Figure 1 State transition diagram.
3 Reliability Characteristics
3.1 Transition Probabilities and Sojourn Times
The expressions specifying the probability of transition form any state to are:
The different system related transition probabilities are given by:
| (1) |
Also,
| (2) | ||
The mean sojourn times corresponding to various transition states indulged in system are:
| (3) | ||
3.2 Mean Time to System Failure
Assume is used to denote the C.D.F of first passage time from any regenerative state to any failed state where failed state is regarded as an absorbing state, the following recursive relations are defined for :
Laplace-Stieltjes transform of will provide solution for . If represents the reliability of the system, then it is defined as:
| (4) |
Inverse Laplace Transform of will measure the reliability R(t) of the system. Also, mean time to system failure of the system is given by:
| (5) | |
| (6) |
where A and B are .
3.3 Availability Analysis
Suppose the system entered any regenerative state at and let it be in upstate at any instant . Recursive relations for are given by:
| (7) | ||
where
| (8) |
L.T. of relations (7) determines the value of , which further defines the steady state availability of the system as follows:
| (9) |
where
| (10) | ||
3.4 Busy Period Analysis of Server
Assuming that the system gets into regenerative state at and to be the probability that server is engaged in at any time , then abides by the following relations:
| (11) | ||
Here,
| (12) |
L.T. of relations (11) will estimate the value of and the time for which server is occupied in steady state is defined by:
| (13) | |
| (14) |
and is already established in (10).
3.5 Server’s Expected Number of Visits
Assuming that system works initially from regenerative state at , let be the expected times for server’s visit in , the following relations holds for :
| (15) | ||
L.S.T. of (15) and further solving for , the expected number of times of server’s visit are given by:
| (16) |
where
| (17) | ||
and is already described in (10).
3.6 Profit Analysis
The system’s profit (P) at steady state can be calculated as follows:
| (18) |
where = Revenue generated by system per unit up time. = Server’s cost per unit time for repairing. = Server’s cost per visit.
4 Numerical Illustration
For performing sensitivity analysis of proposed model, consider specific case by assuming . The effect of various limiting factors like failure rates, repair rates has been probed on reliability measures like MTSF, availability and profit of the system model. Tables 1 and 2 represent the changes in MTSF and availability of system with respect to failure rates and repair rates respectively.
Table 1 Effect of failure rates on MTSF and availability
| MTSF | Availability | ||||||
| 0.1 | 16.0398 | 13.6538 | 12.1014 | 0.830523 | 0.807273 | 0.782298 | |
| 0.2 | 8.84855 | 7.33333 | 6.35003 | 0.729469 | 0.694315 | 0.660111 | |
| 0.3 | 6.48438 | 5.24904 | 4.44811 | 0.662362 | 0.619724 | 0.58189 | |
| 0.4 | 5.32288 | 4.22131 | 3.50711 | 0.614556 | 0.567061 | 0.527523 | |
| 0.5 | 4.63986 | 3.61458 | 2.94949 | 0.578771 | 0.527828 | 0.487542 | |
| 0.6 | 4.19345 | 3.21725 | 2.58289 | 0.55098 | 0.497468 | 0.456905 | |
| 0.7 | 3.88336 | 2.93878 | 2.32493 | 0.528772 | 0.473277 | 0.432679 | |
| 0.8 | 3.65559 | 2.73402 | 2.1345 | 0.51062 | 0.453548 | 0.413042 | |
| 0.9 | 3.48266 | 2.57797 | 1.98881 | 0.495505 | 0.437151 | 0.396804 | |
Table 2 Effect of repair rates on MTSF and availability
| , | , | , | ||||
| MTSF | Availability | MTSF | Availability | MTSF | Availability | |
| 0.1 | 5.05682 | 0.411506 | 5.23214 | 0.42893 | 5.28716 | 0.466486 |
| 0.2 | 5.17857 | 0.533897 | 5.35448 | 0.557874 | 5.43246 | 0.599591 |
| 0.3 | 5.27289 | 0.586968 | 5.44879 | 0.614451 | 5.54589 | 0.656539 |
| 0.4 | 5.34810 | 0.614556 | 5.52372 | 0.644243 | 5.63688 | 0.685962 |
| 0.5 | 5.40948 | 0.630555 | 5.58468 | 0.661763 | 5.71151 | 0.702969 |
| 0.6 | 5.46053 | 0.640544 | 5.63525 | 0.672868 | 5.77381 | 0.713567 |
| 0.7 | 5.50364 | 0.647122 | 5.67787 | 0.680300 | 5.82661 | 0.720536 |
| 0.8 | 5.54054 | 0.651629 | 5.71429 | 0.685484 | 5.87193 | 0.725308 |
| 0.9 | 5.57248 | 0.654815 | 5.74576 | 0.689219 | 5.91126 | 0.728679 |
Profitability of system is evaluated by letting Table 3 shows how failure as well as repair rates affects the profit of system.
Table 3 Effect of failure rates and repair rates on profit
| 0.1 | 3940.69 | 3811.34 | 3797.88 | 0.1 | 1911.31 | 1997.95 | 2178.13 | ||||
| 0.2 | 3439.81 | 3258.95 | 3250.65 | 0.2 | 2484.69 | 2603.44 | 2804.92 | ||||
| 0.3 | 3106.08 | 2901.25 | 2899.65 | 0.3 | 2735.73 | 2871.49 | 3075.7 | ||||
| 0.4 | 2867.61 | 2650.62 | 2633.43 | 0.4 | 2867.61 | 3013.98 | 3217.09 | ||||
| 0.5 | 2688.6 | 2465.19 | 2442.01 | 0.5 | 2944.98 | 3098.63 | 3299.76 | ||||
| 0.6 | 2549.22 | 2322.41 | 2293.5 | 0.6 | 2993.9 | 3152.86 | 3351.94 | ||||
| 0.7 | 2437.58 | 2209.07 | 2174.88 | 0.7 | 3026.55 | 3189.56 | 3386.72 | ||||
| 0.8 | 2346.13 | 2116.89 | 2077.91 | 0.8 | 3049.25 | 3215.46 | 3410.89 | ||||
| 0.9 | 2269.82 | 2040.46 | 1997.14 | 0.9 | 3065.56 | 3234.36 | 3428.24 |
0.13940.693811.343797.880.11911.311997.952178.13
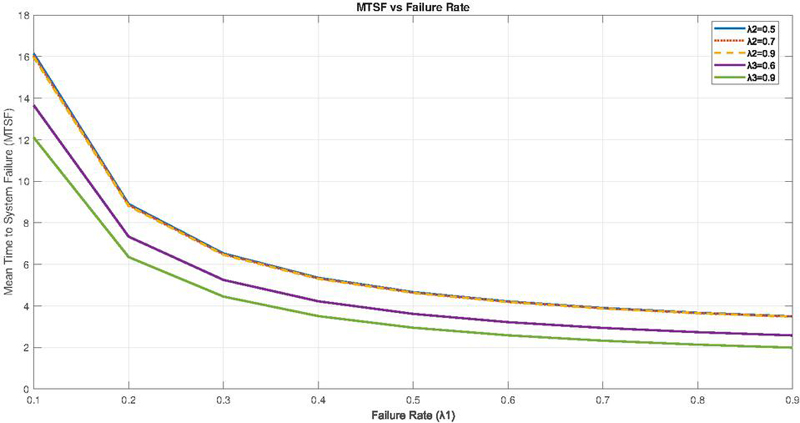
Figure 2 MTSF vs Failure rate ().
The numerical and graphical analyses of the system in relation to various factors reveal distinct behavioral patterns exhibited by different performance metrics. As the failure rates of both units increase, the Mean Time to System Failure (MTSF) of the system exhibits a declining trend, as illustrated in Figure 2. Notably, numerical experiments indicate that variations in the value of (ranging from partial failure to total failure of the merit quality unit) have minimal impact on the MTSF. In contrast, the failure rate of the second unit () significantly influences the MTSF of the system. Figure 4 illustrate the changes in the MTSF with varying repair rates, further highlighting the system’s sensitivity to repair strategies.
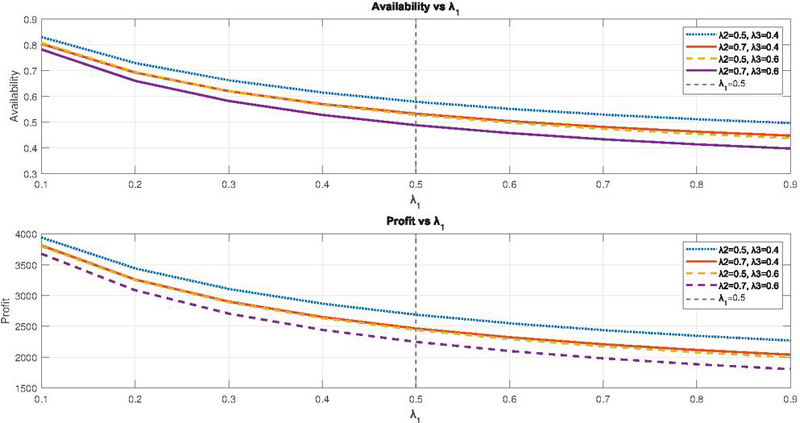
Figure 3 Availability and Profit vs Failure rate ().
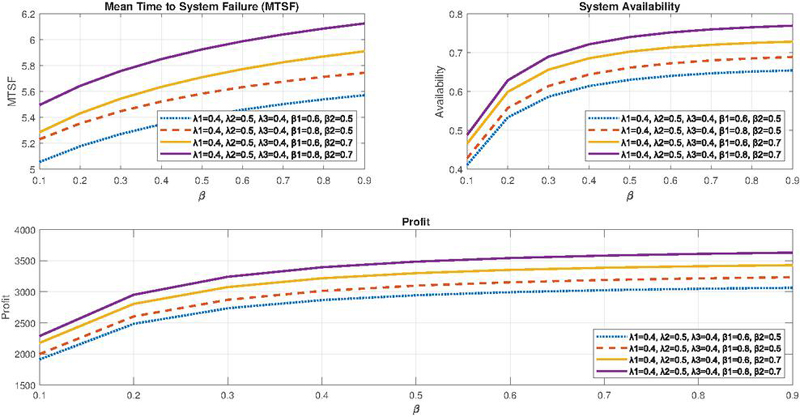
Figure 4 MTSF, Availability and Profit vs repair rate ().
The analysis of system availability is illustrated in Figure 3. Initially, the system’s availability exhibits a sharp decline as the failure rate increases. Furthermore, a significant decrease in availability is observed when the failure rate of the second unit () rises. The impact of different repair rates on system availability varies, with an increase in the repair rate of the second unit contributing to a more substantial enhancement in availability compared to an equivalent increase in the repair rate of the first unit, as demonstrated in Figure 4. Additionally, the profitability of the system can be improved by effectively managing the behavior of various parameters. Figure 3 indicates that profit declines as the failure rate increases. Meanwhile, Figure 4 illustrates the relationship between profit and repair rates, showcasing how adjustments in repair strategies can influence overall profitability.
5 Conclusion
In this study, the performance of a system with two dissimilar parallel units was evaluated by analyzing the effects of varying failure and repair rates on key metrics such as Mean Time to System Failure (MTSF), availability, and profitability. The results demonstrate that an increase in failure rates leads to a noticeable reduction in both MTSF and system availability. Among the failure parameters, the failure rate of the second unit () has a more significant impact on the system’s performance, particularly on the MTSF. The repair rates of the units, especially the repair rate of the second unit (), play a crucial role in improving both availability and profitability. Higher repair rates, particularly for the second unit, result in better system performance and greater profitability, underscoring the importance of repair efficiency in maintaining system reliability. Additionally, profitability is found to decline with increasing failure rates but improves significantly with higher repair rates, highlighting the potential for optimizing system performance by controlling these parameters.
The study emphasizes the importance of prioritizing the reduction of failure rates, especially for the second unit, and enhancing repair strategies to improve both operational efficiency and profitability. These findings offer valuable insights for reliability engineers in industries where maintaining system uptime and profitability is critical. Future research could explore more complex systems and maintenance strategies under different stochastic scenarios to further optimize system performance.
References
[1] Kumar, P. and Gupta, R. Reliability analysis of a single unit system model with helping unit. J. Comb. Info. & System Sciences, 32(1–4):209–219, 2007.
[2] Kumar, P. and Sirohi, A. Profit analysis of a two-unit cold standby system with delayed repair of partially failed unit and better utilization of units. Int. J. Comput. Appl., 117(1):41–46, 2015.
[3] Kumar, P. and Sharma, S. K. A two non-identical unit parallel system with inspection and correlated lifetimes. J. Rajasthan Acad. Phys. Sci., 5(3):301–318, 2006.
[4] Singh, V. V. and Poonia, P. K. Probabilistic assessment of two units parallel system with correlated lifetime under inspection using regenerative point technique. Int. J. Reliab. Risk Saf. Theory Appl., 2(1):5–14, 2019.
[5] Kumar, A., Savita, and Shekhar, C. (2024). Cost Analysis of a Finite Capacity Queue with Server Failures, Balking, and Threshold-Driven Recovery Policy. International Journal of Mathematical, Engineering and Management Sciences, 9(5):1198–1209.
[6] Kumar, A., Savita and Shekhar, C. (2024). Optimizing Resource Allocation in Queues with Feedback, Discouraged Arrivals, and Reneging for Enhanced Service Delivery. Journal of Reliability and Statistical Studies, 17(1), 1–16.
[7] Shekhar, C., Kumar, A., and Varshney, S. (2020). Load Sharing Redundant Repairable Systems with Switching and Reboot Delay. Reliability Engineering & System Safety, 193:106656.
[8] Shekhar, C., Kumar, A., Varshney, S., and Ammar, S. I. (2022). Fault-Tolerant Redundant Repairable System with Different Failures and Delays. Engineering Computations, 37(3):1043–1071.
[9] Shekhar, C., Raina, A. A., Kumar, A., and Iqbal, J. (2017). A survey on queues in machining system: progress from 2010 to 2017. Yugoslav Journal of Operations Research, 27(4):391–413.
[10] Shekhar, C., Kumar, N., Gupta, A., Kumar, A., and Varshney, S. (2020). Warm-spare provisioning computing network with switching failure, common cause failure, vacation interruption, and synchronized reneging. Reliability Engineering & System Safety, 199:106910.
[11] Lin, Z., Tao, L., Wang, S., Yong, N., Xia, D., Wang, J., and Ge, D. (2024). A subset simulation analysis framework for rapid reliability evaluation of series-parallel cold standby systems. Reliability Engineering & System Safety, 241:109706.
[12] Kumar, A. (2023). Single server multiple vacation queue with discouragement solve by confluent hypergeometric function. Journal of Ambient Intelligence and Humanized Computing, 14(5), 6411–6422.
[13] Bhandari, A. S., Kumar, A., and Ram, M. (2024). Hybrid PSO‐GWO algorithm for reliability redundancy allocation problem with Cold Standby Strategy. Quality and Reliability Engineering International, 40(1):115–130.
[14] Qi, F. Q., Wang, Y. K., and Huang, H. Z. (2024). Optimal maintenance policy considering imperfect switching for a multi‐state warm standby system. Quality and Reliability Engineering International, 40(5):2423–2443.
[15] Hu, Z., Dang, C., Wang, L., and Beer, M. (2024). Parallel Bayesian probabilistic integration for structural reliability analysis with small failure probabilities. Structural Safety, 106:102409.
[16] Ahmadi, R., Castro, I. T., and Bautista, L. (2024). Reliability modeling and maintenance planning for a parallel system with respect to the state-dependent mean residual time. Journal of the Operational Research Society, 75(2):297–313.
[17] Bo, Y., Bao, M., Ding, Y., and Hu, Y. (2024). A DNN-based reliability evaluation method for multi-state series-parallel systems considering semi-Markov process. Reliability Engineering & System Safety, 242:109604.
Biographies
Priya Baloda is a research scholar in the Department of Mathematics at Chandigarh University. She earned her M.Sc. degree from Kurukshetra University, Kurukshetra in 2020. Her primary research interests lie in the field of queueing theory and stochastic processes. She has actively participated in several national and international conferences.
Amit Kumar is an Assistant Professor at the University Institute of Science, Chandigarh University, India. He holds a Ph.D. from the Birla Institute of Technology and Science, Pilani Campus, Rajasthan. His research interests encompass queueing theory, the machine repair problem, optimal control, reliability and maintainability, stochastic modeling, sensitivity analysis, evolutionary computation, statistical analysis, and fuzzy sets and logic. Dr. Kumar has published numerous research articles in reputable journals such as Reliability Engineering and System Safety, the Journal of Computational and Applied Mathematics, Quality Technology and Quantitative Management, and the Arabian Journal of Science and Engineering. He actively participates in conferences, Faculty Development Programs (FDPs), workshops, and symposiums as both a presenter and invited speaker. In addition, Dr. Kumar also serves as a reviewer for several prestigious journals and has professional experience with the Irrigation Department in Roorkee, India (ORCID: 0000-0001-5347-1808).
Vikas Garg is a Professor in the Department of Mathematics at Chandigarh University, Mohali. He earned his Ph.D. in Statistics from Kurukshetra University. His research interests include Reliability Theory and Stochastic Processes. Prof. Garg has delivered numerous invited talks and published extensively in these fields, making significant contributions to the advancement of knowledge in mathematics and statistics.
Journal of Reliability and Statistical Studies, Vol. 17, Issue 2 (2024), 351–366.
doi: 10.13052/jrss0974-8024.1725
© 2024 River Publishers